Download to read offline


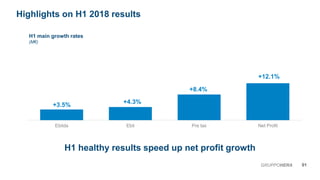
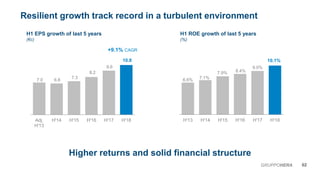
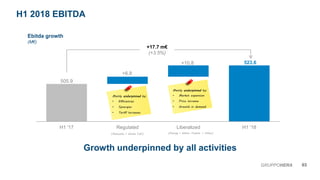
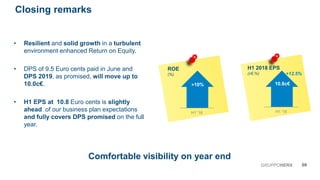
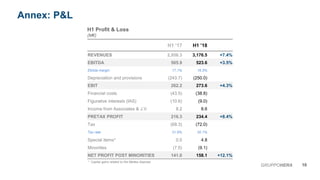
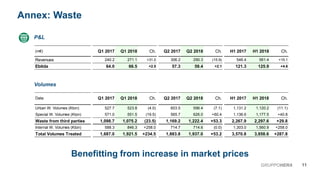

The document summarizes the H1 2018 financial results of an unnamed company. Key points include: - Revenue increased 7.4% and net profit increased 12.1% compared to H1 2017. - EBITDA grew 3.5% to €523.6 million, driven by growth across all business segments. - Solid growth was achieved despite operating in a turbulent market environment.


