FULL ENJOY Call Girls In Mahipalpur Delhi Contact Us 8377877756
Nima Okinawa.Pptx
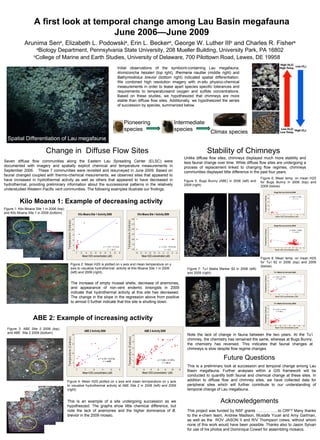
1. A first look at temporal change among Lau Basin megafauna June 2006—June 2009 Arunima Sen a , Elizabeth L. Podowski a , Erin L. Becker a , George W. Luther III b and Charles R. Fisher a a Biology Department, Pennsylvania State University, 208 Mueller Building, University Park, PA 16802 b College of Marine and Earth Studies, University of Delaware, 700 Pilottown Road, Lewes, DE 19958 Initial observations of the symbiont-containing Lau megafauna, Alviniconcha hessleri (top rght) , Ifrermeria nautliei (middle right) and Bathymodiolus brevior (bottom right) indicated spatial differentiation. We combined high resolution imagery with in-situ physico-chemical measurements in order to tease apart species specific tolerances and requirements to temperatureand oxygen and sulfide concentrations. Based on these studies, we hypothesized that chimneys are more stable than diffuse flow sites. Additionally, we hypothesized the series of succession by species, summarized below. Spatial Differentiation of Lau megafauna Change in Diffuse Flow Sites Stability of Chimneys Seven diffuse flow communities along the Eastern Lau Spreading Center (ELSC) were documented with imagery and spatially explicit chemical and temperature measurements in September 2006. These 7 communities were revisited and resurveyed in June 2009. Based on faunal changed coupled with thermo-chemical mesurements, we observed sites that appeared to have increased in hydrothermal activity as well as others that appeared to have decreased in hydrothermal, providing preliminary information about the successional patterns in the relatively understudied Western Pacific vent communities. The following examples illustrate our findings. Unlike diffuse flow sites, chimneys displayed much more stability and less faunal change over time. While diffuse flow sites are undergoing a process of replacement linked to changing flow regimes, chimneys communities displayed little difference in the past four years. The increase of empty mussel shells, decrease of anemones, and appearance of non-vent endemic brisingids in 2009 indicate that hydrothermal activity at this site has decreased . The change in the slope in the regression above from positive to almost 0 further indicate that this site is shutting down. Kilo Moana 1: Example of decreasing activity ABE 2: Example of increasing activity Note the lack of change in fauna between the two years. At the Tu’i chimney, the chemistry has remained the same, whereas at Bugs Bunny, the chemistry has reversed. This indicates that faunal changes at chimneys is slow despite flow regime changes. Future Questions Acknowledgements This is an example of a site undergoing succession as we hypotheszed. The graphs show little chemical difference, but note the lack of anemones and the higher dominance of B. brevior in the 2009 mosaic. This is a preliminary look at succession and temporal change among Lau Basin megafauna. Further analyses within a GIS framework will be conducted to quantify both faunal and chemical change at these sites. In addition to diffuse flow and chimney sites, we have collected data for peripheral sites which will further contribute to our understanding of temporal change of Lau megafauna. This project was funded by NSF grants ……………..to CRF? Many thanks to the e-chem team, Andrew Madison, Mustafa Yucel and Amy Gartman, as well as the ROV JASON II and R/V Thompson crews, without whom none of this work would have been possible. Thanks also to Jason Sylvan for use of his photos and Dominique Cowart for assembling mosaics. Pioneering species Intermediate species Climax species Figure 1: Kilo Moana Site 1 in 2006 (top) and Kilo Moana Site 1 in 2009 (bottom) Figure 2: Mean H2S is plotted on x axis and mean temperature on y axis to visualize hydrothermal activity at Kilo Moana Site 1 in 2006 (left) and 2009 (right). y = 2.26 – 0.0516x r 2 = 0.5 Figure 3: ABE Site 2 2006 (top) and ABE Site 2 2009 (bottom) y = 4.19 + 0.513 x r 2 = 64.5 y = 3.58 + 0.18 7x r 2 = 80.4 Figure 4: Mean H2S plotted on x axis and mean termperature on y axis to visualize hydrothermal activity at ABE Site 2 in 2006 (left) and 2009 (right) Figure 5: Bugs Bunny (ABE) in 2006 (left) and 2009 (right) Figure 6: Mean temp. on mean H2S for Bugs Bunny in 2006 (top) and 2009 (below) y = 18.0 + 0.76 x r 2 = 1.7 y = 6.89 - 0.282 x r 2 = 21.0 Figure 7: Tu’i Malila Marker 62 in 2006 (left) and 2009 (right) Figure 8: Mean temp. on mean H2S for Tu’i 62 in 2006 (top) and 2009 (below) y = 3.62 + 0.197 x r 2 = 63.3 y = 3.19 + 0.141 x r 2 = 45.2 y = 3.81 + 0.122x r 2 = 56.2