A Lake Erie Twofer: Tiny Plastic Particles and Toxic Algae Threaten Lake Waters
Macroinvertebrate_Poster_Summer2012-NOV-2012
1. 1
5
2
3 4
Sunbury
Generation, LP
Byers
Island
Sunbury
Transect
Shady Nook
The Susquehanna River ecosystem has been monitored for macroinvertebrate composition during
the summer months of 2009, 2010, and 2012. Macroinvertebrates are significant determinants of
stream health based on how sensitive they are to pollution. Our study utilized artificial substrates,
rock baskets and Hester-Dendy samplers, at sites on the upper main stem along a transect that
straddled Byers Island near Shamokin Dam, PA. The collection and identification of these
organisms to family allowed us to determine pollution tolerance values and other comparative
metrics. During the study, biological diversity declined as Ephemeroptera, Decapoda, and
Amphipoda began to dominate causing the Hilsenhoff Biotic Index values to rise, and the percent
EPT to fall. Overall, the pollution-tolerant macroinvertebrates increased in relative dominance
since 2009; however, the difference likely is related to summer discharge levels. Our results
underscore the need for more bioassessment studies to cover a wide range of flow regimes.
A Comprehensive Analysis of Benthic Macroinvertebrate Diversity on the Susquehanna River
At the Byers Island Transect from 2009-2012
Department of Biology, Susquehanna University, 514 University Avenue, Selinsgrove, PA 17870
Katherine Guild, John Kilmer, David Haklar, Michael Bilger, and Jack Holt
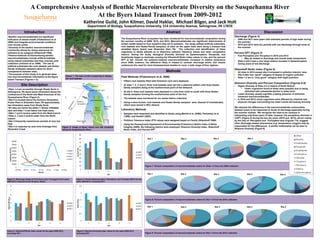
Figure 2: Image of Byers Island and site locations
along the Susquehanna River.
Field Methods (Flotemersch et al. 2006)
• Fifteen rock baskets filled with limestone rock were deployed.
• At sites 1, 2, 3, and 5, three rock baskets were set into a diamond pattern with three Hester-
Dendy samplers being at the southernmost point of the diamond.
• At site 4, three rock baskets were deployed in a line from north to south with three Hester-
Dendy samplers forming the southernmost point of the line.
• The baskets were monitored for six weeks before collection.
• Using a sieve bucket, rock baskets and Hester-Dendy samplers were cleaned of invertebrates,
which were stored in 95% ethanol.
Laboratory Methods
• Samples were separated and identified to family using Merritt et al. (2008), Peckarsky et al.
(1990), and Voshell (2002).
• Pollution Tolerance Index (PTI) values were assigned based on Family (Hilsenhoff 1988).
• Using the Pennsylvania Department of Environmental Protection’s Bethic Index of Biotic
Integrity (2009), the following metrics were employed: Shannon Diversity Index, Hilsenhoff
Biotic Index, and Percent EPT
S R HC E S
Susquehanna River Heartland Coalition for Environmental Studies
0
10
20
30
40
50
60
70
80
90
1 2 3 4 5
Percent(%)
Site
2009
2010
2012
0
1
2
3
4
5
6
7
8
1 2 3 4 5
HilsenhoffValue
Site
2009
2010
2012
0
0.5
1
1.5
2
2.5
1 2 3 4 5
IndexValue
Site
2009
2010
2012
0
10000
20000
30000
40000
50000
60000
70000
80000
26-May 10-Jun 25-Jun 10-Jul 25-Jul 9-Aug 24-Aug
Discharge(ft^3/s)
Month
2009
2010
2011
2012
•Benthic macroinvertebrates are significant
indicators of stream health (Flotemersch et al.
2006) and integrate environmental conditions
over annual cycles.
•Diversity of the benthic macroinvertebrate
community allows for stress tolerances for
pollution to be assigned (Hilsenhoff 1988).
•Passive methods of biomonitoring benthic
macroinvertebrates include artificial habitats
using natural substrates that they colonize until
collection (Johnson et al. 2006). The use of
artificial substrates like rock baskets and Hester-
Dendy multiplate samplers allow for direct
comparisons between sites.
•The purpose of this study is to generate base-
line macroinvertebrate information at the Byers
Island Transect (Figures 1-2).
Shamokin
Creek
•Sites 1-4 are accessible through Shady Nook in
Selinsgrove, PA about seven kilometers below the
confluence of the North and West branches of the
Susquehanna River (Figure 2).
•Site 5 is located above the Sunbury Generation
Power Plant in Shamokin Dam, PA approximately
two kilometers away from Shady Nook.
•All sites are below the Adam T. Bower inflatable
dam and sites 1-4 are below low head dams.
•Sites 1 and 5 receive water from the West branch.
•Sites 2, 3 and 4 receive water from the North
branch.
•Site 3 frequently experiences periods of very low
flow.
•Site 4 is impacted by acid mine drainage from
Shamokin Creek.
Figure 4: Percent Ephemeroptera, Plecoptera, and Tricoptera (EPT) for the
years 2009-2012, excluding 2011
Figure 3: Discharge values (in ft3/s) from June 1 to August 15 for years
2009-2012 measured at the Sunbury station
Figure 5: Hilsenhoff Biotic Index values for the years 2009-2012,
excluding 2011
Figure 6: Shannon Diversity Index values for the years 2009-2012,
excluding 2011
Figure 7: Percent composition of macroinvertebrate orders for Sites 1-4 from the 2009 collection
Site 1 Site 2 Site 3 Site 4
Site 1 Site 3Site 2 Site 4
Site 1 Site 2 Site 3 Site 4 Site 5
Site 5
Figure 8: Percent composition of macroinvertebrate orders for Site 1-5 from the 2010 collection
Figure 9: Percent composition of macroinvertebrate orders for Site 1-5 from the 2012 collection
Site Description
Introduction
Methods
Discharge (Figure 3)
• 2009 and 2011 were years with extended periods of high water during
the summer.
• 2010 and 2012 were dry periods with low discharge through most of
the summer.
Percent EPT (Figure 4)
• Few Plecoptera and Tricoptera in 2010 and 2012
• May be related to discharge and overall water temperature
• Sites 2 and 3 saw a very large relative increase in Ephemeroptera
during years of low discharge.
Hilsenhoff Biotic Index (Figure 5)
• All sites in 2012 except site 4 increased in pollution tolerant taxa.
• Site 5 falls into “good” category of degree of organic pollution
• Sites 1-4 are in “very good” category with slight pollution
Shannon Diversity and Percent Composition (Figures 6-9)
• Higher diversity at Sites 2-4 in waters of North Branch
• Fewer organisms found at these sites possibly due to being
disturbed with substantial decline in water level
• Lower diversity usually signifies a fading presence of pollutant-
intolerant macroinvertebrates
• In 2010 and 2012, some organisms were affected by chemical and
physical changes surrounding low water events decreasing diversity
We interpret the differences in the macroinvertebrate communities
between years to be responses to levels of discharge especially during
the summer months. We recognize the need to be cautious in
interpreting only three years of data; however, the precipitous declines in
%EPT, (Figure 4) during the two dry years (2010 and 2012), driven mainly
by the loss of Plecoptera and Trichoptera taxa (Figures 7-9), suggest
other discharge-related phenomena (e.g. temperature, oxygen) may be
responsible for the differences. A similar relationship can be seen in
Shannon Diversity (Figure 6).
Discussion
Figure 1: The team at site 4 preparing to deploy
the rock baskets
Abstract
Adam T. Bower Dam
Low Head Dams