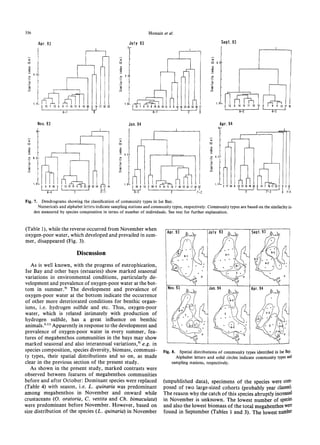
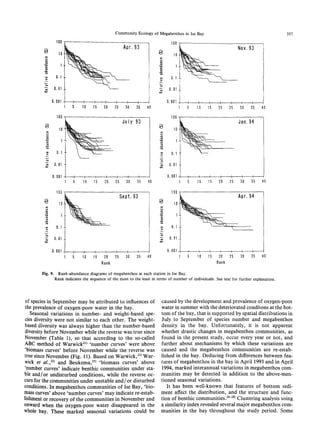
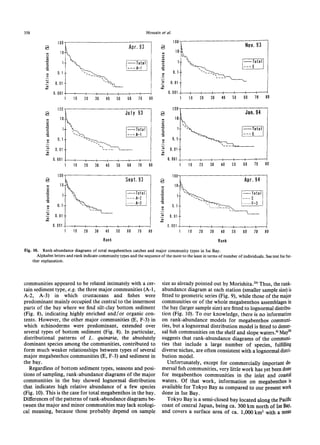
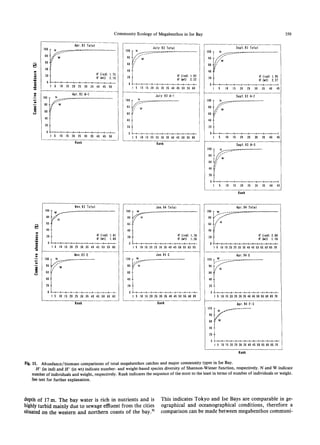
SlideShare a Scribd company logo
1 of 12
Download to read offline
See discussions, stats, and author profiles for this publication at: https://www.researchgate.net/publication/283253816
Density, Biomass and Community Structure of Megabenthos in Ise Bay,
Central Japan
Article  in  Fisheries Science · June 1996
CITATIONS
15
READS
8
3 authors, including:
Some of the authors of this publication are also working on these related projects:
Genetic transformation View project
Crops and vegetables View project
Md Ismail Hossain
Manarat International University
845 PUBLICATIONS   5,235 CITATIONS   
SEE PROFILE
Hideo Sekiguchi
Mie University
91 PUBLICATIONS   948 CITATIONS   
SEE PROFILE
All content following this page was uploaded by Hideo Sekiguchi on 14 December 2015.
The user has requested enhancement of the downloaded file.
Fisheries Science 62(3), 350-360 (1996)
Density, Biomass and Community Structure of Megabenthos
in Ise Bay, Central Japan
Moazzem Hossain, Tetsuya Amakawa, and Hideo Sekiguchi
Faculty of Bioresources, Mie University, Kamihama-cho, Tsu, Mie 514, Japan
(Received June 19, 1995)
In order to know the general features of megabenthos in Ise Bay in relation to the development and
prevalence of oxygen-poor water in summer, an investigation was undertaken throughout the year from
April 1993 to April 1994. Crustaceans and fishes were absolutely dominant from April to September
1993, while echinoderms being dominant since November. Five species of megabenthos were absolutely
dominant: Oratosquilla oratoria (Stomatopoda), Carcinoplax vestita, Charybdis bimaculata
(Brachyura), Luidia quinaria (Asteroidea), and Repomucenus valenciennei (Pisces). Community struc
ture (e.g. species diversity, ABC-comparison, rank-abundance relationships and community type) of
megabenthos in Ise Bay drastically changed with season, intimately related with development and
perishment of oxygen-poor water at the bottom of the bay.
Key words: megabenthos, community ecology, oxygen-poor water
A relatively large number of studies have been carried
out on the slope and deep-sea megabenthos communit
ies1,2) and commercially important demersal fish communi
ties,3-6) but it is ironical that there is little information avail
able on megabenthos communities in the inlet and coastal
waters.
In the inlet and coastal waters, oxygen-poor water de
velops and prevails in the bottom layer every summer
mainly due to eutrophication. Consequently defaunation
takes place. In particular, mass mortality of macrobenthos
and commercially important megabenthos (e.g. bivalves,
fishes etc.) caused by the development of oxygen-poor
water has frequently been reported.7-11)Unfortunately, ex
cept for comprehensive works on commercially important
megabenthos done in Tokyo Bay,10,12)Ifeatures of megaben
thos communities in the inlet and coastal waters and fur
ther influences upon the communities of oxygen-poor
water have not yet been examined in detail.
The present study was undertaken in order to know
seasonal variations in the general features of megabenthos
communities in Ise Bay, particularly focussing on the
influences upon megabenthos communities of oxygen
poor water which develops every summer in the bay.
Materials and Methods
Study Area
Ise Bay is a semi-closed bay located along the Pacific
coast of central Japan and covers a surface area of 1,738
km2 with a mean depth of 19.5 m'3) (Fig. 1). The depth is
slightly more than 30 m in the main basin and separated
from the Pacific Ocean through the Irago passage, 13 km
wide and 73 m deep. The Kiso Rivers (Kiso, Nagara and
Ibi), one of the biggest rivers in Japan, flow into the inner
most part of the bay. The northern and central parts of the
bay have silt-clay bottom sediments, while the south and
southwestern parts have bottom sediments of sand,
muddy sand and sandy gravel (Fig. 2).
The water in the bay is rich in nutrients and highly tur
bid due to the freshwater discharge and sewage effluent
from the cities situated on the western and northern coasts
of the bay. With the recent progress of eutrophication in
the bay, red tides have often been observed, so that the dis
Fig. 1. Ise Bay and the location of sampling stations
.
The solid circles and lines indicate sampling stations and depth
isopleth in meter, respectively.
Community Ecology of Megabenthos in Ise Bay 351
Fig. 2. Bottom sediment types in Ise Bay (from Kitamori et al.30))
C-f sand indicates coarse to fine sand.
solved oxygen content in the bottom layer of the bay
shows remarkable changes with the season, particularly
oxygen-poor water prevailing mainly in the central part of
the bay every summer.9)
Seasonal and spatial distributions of the dissolved
oxygen content in the bay are shown in Fig. 3. In the
present study oxygen-poor water (i.e. 2 ppm or less) oc
curred and prevailed widely in the bottom layer (1 m above
the bay bottom) of the central part of the bay mainly dur
ing July to October, particularly in August. Of course, a
similar situation has often been observed in the bay in the
previous years.9,13) However, strong mixing of water due to
typhoons passing by the bay more times in the summer of
1993 prevented extreme oxygen-poor water from develop
ing and prevailing in the bottom layer of the central part
of the bay.
Sampling and Data Processing
Samples were obtained six times (27-28 April 1993, 1-2
July 1993, 13, 17 September 1993, 24-25 November 1993,
19-20 January 1994 and 13-14 April 1994) in Ise Bay on
board the T/V Seisui Maru of Mie University, and at 15
19 sampling stations during each sampling time (Fig. 1).
For sampling megabenthos, a gear (a small fishing trawl
net) was towed on the bottom with a 900 m distance, usu
ally done for 15 minutes with a ship speed of 2 knots (1 m/
sec) at each station. But a sampling in September 1993 was
done on board a small fishing boat. The gear was towed
with a ship speed of 3 knots. Accordingly, the bottom area
covered at each station is equivalent to ca. 1500 m2. This
gear has an iron frame fixed to the net that is 4.4 m length
with a stretch mesh size of 27 mm (Fig. 4). This iron frame
has a length and height of 165 cm and 30 cm, respectively,
and is provided with a number of thorns (13 cm height)
along the bottom side of the frame. We define here the
term 'megabenthos' as benthic animals collected using this
gear, though we neglected fish with total lengths exceeding
15 cm (except R. valenciennei) because of avoiding ex
treme bias due to the occurrence of a few species.
Catches, being frozen immediately after sampling, were
identified, to the specific level, and numbers and weights
of specimens of each species were measured in the labora
tory.
As measures of species diversity, the number of species
Fig. 3. Seasonal change of the dissolved oxygen content (ppm) in water 1 m just above the bottom in Ise Bay (from Prompt Report of Mie Prefectur
al Institute of Fisheries Technology).
The shady area indicates the area with the dissolved oxygen content less than 2 ppm.
352 Hossain et at.
Fig. 4. Schematic illustration of a megabenthos sampling gear .
(SR), Shannon-Wiener function (H•Œ) and equitability in
dex (E) (Pielou's evenness component of diversity, see J•Œ
in Pielou14)) were used. The later two indices, based on in
formation theory, were calculated from the following:
Where SR=number of species in a sample, Ni=number of
individuals (or weights) of the i-th species in the sample
and N=total number of individuals (or total weights) of
the sample.
For classification of community types based on the spe
cies composition, the similarity index C,n15)was used. The
index between the i-th sample and j-th sample is:
where nik and n;k are the density of species k in samples i
and j, respectively. A BASIC program of clustering by
group average method16) was employed for the between
sample similarity matrices constructed by the Cn index.
Known as one way to characterize a community is a
rank-abundance diagram.17) The diagram shows the
relationship between relative abundance Pi and rank i,
where i is the sequence of species from the most to least
abundance based on the number of individuals or on
weights. The observed patterns were compared to the fol
Table 1. Seasonal variations in number of megabenthos taxa and species diversity in Ise Bay
H•Œ (in ind.), number-based species diversity of Shannon-Wiener function; H•Œ (in wt.)
, weight-based species diversity of Sbannon-Wiener function
.
Community Ecology of Megabenthos in Ise Bay 353
lowing three models: geometric series,18) broken stick
modell9) and lognormal distribution.20)
Results
Seasonal and Spatial Distributions of the Number of Spe
cies and Species Diversity of Megabenthos in the Bay
T he total number of 132 megabenthos species were iden
tified in the bay, so the number of species ranged from 45
(in September 1993) to 73 (in April 1994) (Table 1). Four
taxa (crustaceans, molluscans, echinoderms and fishes)
were predominant throughout the investigations; the num
bers of species of crustaceans, molluscans, echinoderms
and fishes were 32, 33, 13 and 39, respectively. On the
other hand, the overall species diversity H•Œ that was based
on the number of individuals ('number diversity') ranged
from 1.62 (0.48-2.38 at each station in July) to 2.60 (1.24
2.59 at each station in April 1994), while that based on
weights ('biomass diversity') ranged from 1.18 (0.5-2.40 at
each station in November 1993) to 2.17 (1.08-2.77 at each
station in April 1993) (Table 1). Seasonal variations were
not similar between these two indices. Interestingly, the
'biomass diversity' was clearly higher than the 'number
diversity' from April to September 1993, while the reverse
occurred from November 1993 to April 1994.
Spatial distributions of the number of species per sta
tion are shown in Fig. 5. In April 1993, higher numbers of
species were found mainly in the central part of the bay
with the highest being 31 at stn. 9. Then, a decrease of the
numbers was detected in the same part in July and Septem
ber with the highest being 23. Although the number of spe
cies of megabenthos continued to decrease at most of the
stations, particularly at stations within the central part of
the bay from April to September 1993, the total number of
species were a little higher in July than in April 1993
(Table 1). Interestingly, in April 1994, a higher number of
species were found mainly in the southern part of the bay,
much different from the case in April 1993 (Fig. 5). On the
Fig. 5. Spatial distributions of species richness (number of species per
station) of megabenthos in Ise Bay.
Solid circles indicate sampling stations.
Table 2. Relationships between species diversity and density of
megabenthos in Ise Bay
+, positive type of correlation; -, negative type of correlation; P, level of sig
nificance (F-test); H•Œ, Shannon-Wiener function; SR, number of species; E,
equitability index; ind, individual; wt, weight; ns, not significant.
other hand, spatial distributions of species diversities were
not similar to those of the number of species per station,
rather higher diversities were found mainly in the areas
where the number of species was lower. This indecates that
species diversities are influenced strongly by distribution
of individuals among species rather than the number of
species.
Relationships between species diversity (H•Œ) and den
sity, between number of species (SR) and density, between
equitability index (E) and density, and between species
diversity and number of species are shown in Table 2. Simi
354 Hossain et al.
lar tendencies were found between the number-based and
weight-based relationships. According to our investiga
tions, both of the species diversity and equitability index
fluctuated in inverse proportion to density (except Sept.
93), while the number of species was proportional to den
sity (except July 93). Furthermore, relationships between
species diversity and species richness were not significant
statistically at any sampling time except for September
1993. Whether establishment of the relationships occur or
not clearly depended on sampling times and/or on seasons
(Table 2).
Seasonal and Spatial Distributions of the Biomass and
Density of Megabenthos
The biomass of megabenthos and percentages in weights
of different taxa are shown in Table 3. The biomass of
megabenthos and crustaceans (one of the dominant taxa
among megabenthos) showed a similar tendency to
decrease from April towards September 1993. Three taxa
(crustaceans, molluscans and fishes) were predominant
from April to September 1993: biomass of crustaceans was
first in rank, occupying 70% or more of the megabenthos
biomass while that of fish was second in rank, occupying
10% or more of the same. On the other hand, since Novem
ber 1993 the biomass of megabenthos increased again with
the highest being in April 1994. The biomass of
echinoderms was in first rank during this period.
Of the megabenthos species collected in the present
study, the following five species were absolutely dominant
in biomass: O. oratoria (Stomatopoda), C. vestita, Ch. bi
maculata (Brachyura), L. quinaria (Asteroidea) and R.
valenciennei (Pisces). Seasonal changes of biomasses of
these species are shown in Table 4. The five species occu
pied 32% of megabenthos biomass in November 1993 and
82% in April 1994. These five species can broadly be clas
sified into two groups according to seasonal variations in
their biomass (Table 4). Biomass of the first group (R.
valenciennei, C. vestita, Ch. bimaculata and O. oratoria)
occurred abundantly during April to September 1993 and
decreased drastically in November. Among the species of
the first group, biomasses of R. valenciennei, C. vestita
and Ch. bimaculata were highest in April and decreased
toward July 1993, while the biomass of O. oratoria was
highest in September 1993 and decreased toward January
1994. On the other hand, biomass of the second group (L.
quinaria) was abundantly found in November and con
Fig. 6. Spatial distributions of density (wet weight, gram per station) of
megabenthos in Ise Bay.
Solid circles indicate sampling stations.
Table 3. Seasonal variations in megabenthos biomass in Ise Bay
Community Ecology of Megabenthos in Ise Bay 355
Table 4. Seasonal variations in biomass of five dominant megabenthos species in Ise Bay
tinued to be predominant among the megabenthos since
then.
Spatial distributions of megabenthos density (weight per
station) are shown in Fig. 6. Higher densities were found
mainly in the whole central part of the bay in April to July
1993with the highest being 5 kg/stn and 7 kg/stn, respec
tively. Then, in September several higher densities of more
than 3 kg/stn were located separately at the marginal sta
tions within the central part of the bay. In November 1993
to April 1994, higher densities were found at western or
eastern sides of the central to the southern parts of the
bay. From April to September 1993, spatial distributions
of the C. vestita density were similar to those of the
megabenthos density, while since November the distribu
tions of L. quinaria were similar to those of the megaben
thos density.
Marked contrasts were detected in dominant species,
biomasses and spatial distributions of megabenthos den
sitybetween April of both years (1993 and 1994) (Tables 3,
4; Fig. 6).
Community Types Based on Species Composition
Clustering analysis, that used the similarity index (Ca)
measured by the number of individuals or by weights of
each megabenthos species at each station, revealed several
community types as shown in Fig. 7. Clustering patterns
were similar between the clustering analyses based on num
ber of individuals and on weights, so in the following we
refer only to the analysis based on the number of individ
uals. We defined A-1, A-2, A-3, E and F-3 as the major
communities, while the others were done as minor com
munities. However, some communities that occupied one
or two stations with meager number of megabenthos were
neglected.
Spatial distributions of different community types are
shown in Fig. 8. The major community type A-1 was de
tected in April and July 1993. This community occupied
the central to innermost part of the bay, and was dominat
ed by four species (C. vestita, Ch. bimaculata, 0. oratoria
and R. valenciennei). The community B in April 1993 was
composed of species other than the four dominant species
mentioned above, while the community C in July was
dominated by Styela clava (Ascidiacea). In September
1993 the community A-1 was divided into two communi
ties A-2 and A-3. The community A-2, that was dominat
ed by 0. oratoria, occupied the western area of the central
to innermost parts of the bay, while the community A-3
was dominated by C. vestita and Ch. bimaculata and occu
pied the eastern area of the same parts.
However, a drastic change of megabenthos communities
was observed in November as indicated in the previous sec
tion (Table 3; Fig. 6). Since November 1993 one major
community E, that was dominated by L. quinaria, occu
pied wider part of the bay (Fig. 8) while the other minor
communities (A-4, A-5, F-1, F-2, F-4, G) were composed
mainly of C. vestita, 0. oratorio, Echinocardium corda
tum (Echinoidea) and Fulvia mutica (Bivalvia).
The rank-abundance diagram of megabenthos at each
station, based on the number of individuals, is shown in
Fig. 9. Since the patterns of number-based and weight
based rank-abundance diagrams were found to be almost
similar, so in the following we refer only to the diagram
based on the number of individuals. Most of the stations
indicated linear arrangement of rank-abundance diagrams
that suggested geometric series with high abundance of a
few species. However, patterns of the diagrams differed
much depending on station and season.
Rank-abundance diagrams of each community type and
of the whole megabenthos in the bay are shown in Fig. 10.
Regardless of seasons and types of major communities,
patterns of the diagrams were similar to each other,
though the dominant species were replaced according to
seasons and types of community as mentioned above and
also as shown in Tables 3 and 4. The major communities
(A-1, A-2, A-3, E and F-3) including many stations (i.e.
larger sample sizes) showed that the observed patterns are
more likely fitted to lognormal distribution, while those in
the minor communities are fitted to geometric series (Figs.
9, 10).
The combined 'number and biomass curves' are shown
in Fig. 11. The 'number curves' were above the 'biomass
curves' from April to September 1993 for the major com
munities and also the whole megabenthos in the bay, in
dicating higher 'biomass diversity' than 'number diversity'
356 Hossain et al.
Fig. 7. Dendrograms showing the classification of community types in Ise Bay.
Numericals and alphabet letters indicate sampling stations and community types, respectively. Community types are based on the similarlity in
dex measured by species composition in terms of number of individuals. See text for further explanation.
(Table 1), while the reverse occurred from November when
oxygen-poor water, which developed and prevailed in sum
mer, disappeared (Fig. 3).
Discussion
As is well known, with the progress of eutrophication,
Ise Bay and other bays (estuaries) show marked seasonal
variations in environmental conditions, particularly de
velopment and prevalence of oxygen-poor water at the bot
tom in summer.9) The development and prevalence of
oxygen-poor water at the bottom indicate the occurrence
of other more deteriorated conditions for benthic organ
isms, i.e. hydrogen sulfide and etc. Thus, oxygen-poor
water, which is related intimately with production of
hydrogen sulfide, has a great influence on benthic
animals.8,11)Apparently in response to the development and
prevalence of oxygen-poor water in every summer, fea
tures of megabenthos communities in the bays may show
marked seasonal and also interannual variations,9) e.g. in
species composition, species diversity, biomass, communi
ty types, their spatial distributions and so on, as made
clear in the previous section of the present study.
As shown in the present study, marked contrasts were
observed between features of megabenthos communities
before and after October: Dominant species were replaced
(Table 4) with season, i.e. L. quinaria was predominant
among megabenthos in November and onward while
crustaceans (0. oratoria, C. vestita and Ch. bimaculata)
were predominant before November. However, based on
size distribution of the species (L. quinaria) in November
Fig. 8. Spatial distributions of community types identified in Ise Bay.
Alphabet letters and solid circles indicate community types and
sampling stations, respectively.
(unpublished data), specimens of the species were com
posed of two large-sized cohorts (probably year classes),
The reason why the catch of this species abruptly increased
in November is unknown. The lowest number of species
and also the lowest biomass of the total megabenthos were
found in September (Tables 1 and 3). The lowest number
Community Ecology of Megabenthos in Ise Bay 357
Fig. 9. Rank-abundance diagrams of megabenthos at each station in Ise Bay.
Rank indicates the sequence of the most to the least in terms of number of individuals. See text for further explanation.
of species in September may be attributed to influences of
the prevalence of oxygen-poor water in the bay.
Seasonal variations in number and weight-based spe
ciesdiversitywere not similar to each other. The weight
based diversitywas always higher than the number-based
diversitybefore November while the reversewas true since
November (Table 1), so that according to the so-called
ABCmethod of Warwick21) 'number curves' were above
'biomasscurves' before November while the reverse was
truesinceNovember (Fig. 11). Based on Warwick,21)War
wick et al.,22)and Beukema,25)'biomass curves' above
' numbercurves' indicate benthic communities under sta
ble and/or undisturbed conditions, while the reverse oc
cursfor the communities under unstable and/or disturbed
conditions.In megabenthos communities of Ise Bay, 'bio
masscurves'above 'number curves' may indicate re-estab
lishmentor recovery of the communities in November and
onward when the oxygen-poor water disappeared in the
whole bay. These marked seasonal variations could be
caused by the development and prevalence of oxygen-poor
water in summer with the deteriorated conditons at the bot
tom of the bay, that is supported by spatial distributions in
July to September of species number and megabenthos
density in the bay. Unfortunately, it is not apparent
whether drastic changes in megabenthos communities, as
found in the present study, occur every year or not, and
further about mechanisms by which these variations are
caused and the megabenthos communities are re-estab
lished in the bay. Deducing from differences between fea
tures of megabenthos in the bay in April 1993 and in April
1994, marked interannual variations in megabenthos com
munities may be detected in addition to the above-men
tioned seasonal variations.
It has been well-known that features of bottom sedi
ment affect the distribution, and the structure and func
tion of benthic communities .26-28)Clustering analysis using
a similarity index revealed several major megabenthos com
munities in the bay throughout the study period. Some
358 Hossain et al.
Fig. 10. Rank-abundance diagrams of total megabenthos catches and major community types in Ise Bay.
Alphabet letters and rank indicate community types and the sequence of the most to the least in terms of number of individuals. See text for fur
ther explanation.
communities appeared to be related intimately with a cer
tain sediment type, e.g. the three major communities (A-l,
A-2, A-3) in which crustaceans and fishes were
predominant mainly occupied the central to the innermost
parts of the bay where we find silt-clay bottom sediment
(Fig. 8), indicating highly enriched and/or organic con
tents. However, the other major communities (E, F-3) in
which echinoderms were predominant, extended over
several types of bottom sediment (Fig. 8). In particular,
distributional patterns of L. quinaria, the absolutely
dominant species among the communities, contributed to
form much weaker relationships between types of several
major megabenthos communities (E, F-3) and sediment in
the bay.
Regardless of bottom sediment types, seasons and posi
tions of sampling, rank-abundance diagrams of the major
communities in the bay showed lognormal distribution
that indicates high relative abundance of a few species
(Fig. 10). This is the case for total megabenthos in the bay.
Differences of the patterns of rank-abundance diagrams be
tween the major and minor communities may lack ecologi
cal meaning, because those probably depend on sample
size as already pointed out by Morishita.24) Thus, the rank
abundance diagram at each station (smaller sample size)is
fitted to geometric series (Fig. 9), while those of the major
communities or of the whole megabenthos assemblages in
the bay (larger sample size) are fitted to lognormal distribu
tion (Fig. 10). To our knowledge, there is no information
on rank-abundance models for megabenthos communi
ties, but a lognormal distribution model is fitted to demer
sal fish communities on the shelf and slope waters.) May29)
suggests that rank-abundance diagrams of the communi
ties that include a large number of species, fulfilling
diverse niches, are often consistent with a lognormal distri
bution model.
Unfortunately, except for commercially important de
mersal fish communities, very little work has yet been done
for megabenthos communities in the inlet and coastal
waters. Of that work, information on megabenthos is
available for Tokyo Bay as compared to our present work
done in Ise Bay.
Tokyo Bay is a semi-closed bay located along the Pacific
coast of central Japan, being ca. 300 km north of Ise Bay,
and covers a surface area of ca. 1,000 km2 with a mean
Community Ecology of Megabenthos in Ise Bay 359
Fig. 11. Abundance/biomass comparisons of total megabenthos catches and major community types in Ise Bay.
H•Œ (in ind) and H•Œ (in wt) indicate number and weight-based species diversity of Shannon-Wiener function, respectively. N and W indicate
number of individuals and weight, respectively. Rank indicates the sequence of the most to the least in terms of number of individuals or weight.
See text for further explanation.
depth of 17 m. The bay water is rich in nutrients and is
highly turbid mainly due to sewage effluent from the cities
situated on the western and northern coasts of the bay.9)
This indicates Tokyo and Ise Bays are comparable in ge
ographical and oceanographical conditions, therefore a
comparison can be made between megabenthos communi
360 Hossain et al.
ties of Tokyo and Ise Bays.
Dr. Shimizu and his colleaguest10,12)have done much
work on the megabenthos community in Tokyo Bay,
though concentrating on commercially important groups
and using a sampling method different from ours (see,
Shimizu 10))According to Shimizu10)and Tokimura,12) fish
es and crustaceans were the predominant groups in the bay
(excluding Asteroidea), of which two species were
predominant in numbers throughout the year: R. valen
ciennei (Pisces) and O. oratoria (Stomatopoda). Oxygen
poor water develops every summer in the northern to cen
tral part of the bay where defaunation took place, so that
megabenthos were mainly found in the southern part of
the bay during summer, while in other seasons they were
distributed in the central to innermost parts probably in
response to recovery of the environmental conditions in
the bay.
Being similar to the megabenthos communities in Tokyo
Bay as referred above, fishes, crustaceans and echinoderms
were predominant groups in IssseBay, of which the follow
ing five species were predominant and drastically replaced
with season: R. valenciennei (Pisces), C. vestita and Ch. bi
maculata (Brachyura), O. oratoria (Stomatopoda) and L.
quinaria (Asteroida). It remains difficult to say whether
seasonal replacement of the dominant species is a regular
event in the bay every year or not. The total number of
megabenthos species collected in Tokyo Bay is 198 while
the total collected in Ise Bay is 132. In summary, although
the two bays are comparable in geographical and
oceanographical conditions, features of megabenthos com
munities are much different between the two bays.
References
1) R. L. Haedrich, G. T. Rowe, and P. T. Polloni: The megabenthic
fauna in the deep sea south of New England, USA. Mar. Biol., 57,
165-179 (1980).
2) J. D. Gage and P. A. Tyler: Deep-Sea Biology, Cambridge Univer
sity Press, Cambridge, 1991, p. 504.
3) T. Hanaoka: Characteristics of commercial catches in inlet water of
Japan. Bull. Coast. Oceanogr., 7, 24-27 (1969) (in Japanese).
4) K. Mito: Food relationships in the demersal fish community in the
Bering Sea. 1. Community structure and distributional patterns of
fish species. Res. Inst. North Pacific Fish. Fac. Fish. Hokkaido
Univ., Special volume, 205-258 (1977) (in Japanese).
5) G. S. Hefman: Patterns of community structure in fishes: summma
ry and overview. Envir. Biol. Fish., 3, 129-148 (1978).
6) T. Fujita, T. Inada, and Y. Ishito: Density, biomass and communi
ty structure of demersal fishes off the Pacific coast of northeastern
Japan. J. Oceanogr., 49, 211-229 (1993).
7) S. L. Santos and J. L. Simons: Response of soft-bottom benthos to
annual catastrophic disturbance in a south Florida estuary. Mar.
Ecol. Prog. Ser., 3, 347-355 (1980).
8) H. Imabayashi: Effects of oxygen-deficient water on the benthic
communities. Nippon Suisan Gakkaishi, 49, 7-16 (1983) (in
Japanese).
9) Oceanographic Society of Japan: Coastal Oceanography of
Japanese Islands, Tokai Univ. Press, Tokyo, 1983, p. 839 (in
Japanese).
10) M. Shimizu: Distribution of benthic fishes and shellfishes in Tokyo
Bay. Bull, Coast. Oceanogr., 25, 96-103 (1988) (in Japanese).
11) T. Furota: Effects of low-oxygen water on benthic sessile animal
communities in Tokyo Bay. Bull. Coast. Oceanogr., 25, 104-113
(1988) (in Japanese).
12) M. Tokimura: On the structure of the distribution of demersalfish
and shellfishin the inner part of Tokyo Bay, Ph. D. thesis, Univer
sity of Tokyo, Tokyo, 1985, p. 156 (in Japanese).
13) Y. Saijo and S. Unoki: Oceanographic conditions and
phytoplankton production in Ise and Mikawa Bays. Bull. Coast.
Oceanogr., 14, 10-18 (1988) (in Japanese).
14) E. C. Pielou: Mathematical Ecology, John Wiley & Sons, New
York, 1977,p. 384.
15) S. Kimoto: Some quantitative analysis on the Chrysomelid fauna of
the Ryukyu Archipelago. Esakia, Kyusyu Univ., 6, 27-54 (1967).
16) Y. Tanaka, T. Tarumi, and K. Wakimoto: Handbook for Statisti
cal Analysis by Personal Computers, II. Multivariate Analysis,
Kyoritsu, Tokyo, 1984, p. 403 (in Japanese).
17) T. Fujita: Community ecology of offshore demersal fish assem
blages. Benthos Res. (Bull. Japan Ass. Benthol.), 44, 1-17 (1993)
(in Japanese).
18) I. Motomura: A stastical treatment of associations. Japan. J.
Zool., 44, 379-383 (1931) (in Japanese).
19) R. H. MacArthur: On the relative abundance of species. Amer.
Nat., 94, 25-36 (1960).
20) F. W. Preston: The commonness and rarity of species.Ecology,29,
254-283 (1948).
21) R. M. Warwick: A new method for detecting pollution effectson
marine macrobenthic communities. Mar. Biol., 92, 557-562 (1986).
22) R. M. Warwick, T. H. Pearson, and Ruswahyuni: Detectionof pol
lution effects on marine macrobenthos: further evaluation of the
species abundance/biomass method. Mar. Biol., 95, 193-200
(1987).
23) J. L. Simons and D. M. Dauer: Reestablishment of a benthiccom
munity following natural defaunation, in "Ecology of MarineBen
thos" (ed. by B. C. Coul), Belle W. Baruch Library in Marine
Science, Columbia, 1977, pp. 139-154.
24) M. Morishita: Animal population ecology, in "Animal Ecology"
(ed. by D. Miyadi, S. Mori, and M. Morishita), Asakura Shoten,
Tokyo, 1961, pp. 193-292 (in Japanese).
25) J. J. Beukema: An evaluation of the ABC-method (abundance/bio
mass comparison) as applied to macro-zoobenthic communitiesliv
ing on tidal flats in the Dutch Wadden Sea. Mar. Biol., 99,425-433
(1988).
26) D. C. Rhoads: Organism-sediment relations on the muddy sea
floor. Oceanogr. Mar. Biol. Ann. Rev., 12, 263-300 (1974).
27) J. Y. Yingst and D. C. Rhoads: The structure of soft-bottom ben
thic communities in the vicinity of the Texas Flower Garden Banks,
Gulf of Mexico. Estu. Coast. Shelf Sci., 20, 569-592 (1985).
28) S. Nakao, S. Goshima, H. Nomura, H. Yamaguchi, and S.
Yoshitake: Relationships between macrobenthos communitiesand
sediment types in Mutsu Bay. Bull. Fac. Fish. Hokkaido Univ.,40,
159-168 (1989) (in Japanese).
29) R. M. May: Patterns of species abundance and diversity, in "Ecolo
gy and Evolution of Communities" (ed. by M. L. Cody and J. M.
Diamond), Harvard Univ. Press, Cambridge, Massachusetts, 1975,
pp. 81-120.
30) R. Kitamori, T. Sugino, and T. Sawada: Bottom quality and ben
thic animals in Ise Bay, in "Report on the Survey for Developing
Fisheries in the Recessof Ise Bay" (ed. by Ise Wan Fish. Exp.Stn.,),
1970, vol. 1, pp. 5-40 (in Japanese).
View publication statsView publication stats

More Related Content

What's hot

3 ijfaf jul-2017-1-evaluation of the ichthyofaunal
3 ijfaf jul-2017-1-evaluation of the ichthyofaunal3 ijfaf jul-2017-1-evaluation of the ichthyofaunal
3 ijfaf jul-2017-1-evaluation of the ichthyofaunalAI Publications
 
2011 nutrient enrichment caused by marine cage
2011 nutrient enrichment caused by marine cage2011 nutrient enrichment caused by marine cage
2011 nutrient enrichment caused by marine cageearambulm3
 
Differential Impacts of 2016 Coral Bleaching on Coral Reef Benthic communitie...
Differential Impacts of 2016 Coral Bleaching on Coral Reef Benthic communitie...Differential Impacts of 2016 Coral Bleaching on Coral Reef Benthic communitie...
Differential Impacts of 2016 Coral Bleaching on Coral Reef Benthic communitie...anbiocore
 
Science Seminar Series 11 Camille Mellin
Science Seminar Series 11 Camille MellinScience Seminar Series 11 Camille Mellin
Science Seminar Series 11 Camille MellinUniversity of Adelaide
 
Environmental conditions and zooplankton community structure in five ponds in...
Environmental conditions and zooplankton community structure in five ponds in...Environmental conditions and zooplankton community structure in five ponds in...
Environmental conditions and zooplankton community structure in five ponds in...Innspub Net
 
11.assessment of the vulnerability of water supply aquifers in parts of imo r...
11.assessment of the vulnerability of water supply aquifers in parts of imo r...11.assessment of the vulnerability of water supply aquifers in parts of imo r...
11.assessment of the vulnerability of water supply aquifers in parts of imo r...Alexander Decker
 
Inva_poster_FINAL
Inva_poster_FINALInva_poster_FINAL
Inva_poster_FINALInva Braha
 
Local human perturbations increase lakes vulnerability to climate changes: A ...
Local human perturbations increase lakes vulnerability to climate changes: A ...Local human perturbations increase lakes vulnerability to climate changes: A ...
Local human perturbations increase lakes vulnerability to climate changes: A ...Lancaster University
 
Changes in benthic communities in the Middle Atlas springs (Morocco) and thei...
Changes in benthic communities in the Middle Atlas springs (Morocco) and thei...Changes in benthic communities in the Middle Atlas springs (Morocco) and thei...
Changes in benthic communities in the Middle Atlas springs (Morocco) and thei...Innspub Net
 
The International Journal of Engineering and Science (The IJES)
 The International Journal of Engineering and Science (The IJES) The International Journal of Engineering and Science (The IJES)
The International Journal of Engineering and Science (The IJES)theijes
 
2013 Vianna et al. Vertical movements of grey reef shark
2013 Vianna et al. Vertical movements of grey reef shark2013 Vianna et al. Vertical movements of grey reef shark
2013 Vianna et al. Vertical movements of grey reef sharkGabriel Maciel de Souza Vianna
 
Zander 2007 - Allochthonous DOC in floodplain rivers
Zander 2007 - Allochthonous DOC in floodplain riversZander 2007 - Allochthonous DOC in floodplain rivers
Zander 2007 - Allochthonous DOC in floodplain riversAlek Zander
 
MyctophidFeedingEcology
MyctophidFeedingEcologyMyctophidFeedingEcology
MyctophidFeedingEcologyWalter Conley
 
SSFSaltMarshWriteUp
SSFSaltMarshWriteUpSSFSaltMarshWriteUp
SSFSaltMarshWriteUpUlrich Kakou
 
Trophic state indices and Phytoplankton quotients for the Kisumu Bay, Lake Vi...
Trophic state indices and Phytoplankton quotients for the Kisumu Bay, Lake Vi...Trophic state indices and Phytoplankton quotients for the Kisumu Bay, Lake Vi...
Trophic state indices and Phytoplankton quotients for the Kisumu Bay, Lake Vi...Douglas Anyona
 

What's hot (18)

Sedimentation Rateand Total Suspended Solid (TSS) In Melombo Area, Salurang ...
Sedimentation Rateand Total Suspended Solid (TSS)  In Melombo Area, Salurang ...Sedimentation Rateand Total Suspended Solid (TSS)  In Melombo Area, Salurang ...
Sedimentation Rateand Total Suspended Solid (TSS) In Melombo Area, Salurang ...
 
Fahlevy et al 2018
Fahlevy et al 2018Fahlevy et al 2018
Fahlevy et al 2018
 
3 ijfaf jul-2017-1-evaluation of the ichthyofaunal
3 ijfaf jul-2017-1-evaluation of the ichthyofaunal3 ijfaf jul-2017-1-evaluation of the ichthyofaunal
3 ijfaf jul-2017-1-evaluation of the ichthyofaunal
 
2011 nutrient enrichment caused by marine cage
2011 nutrient enrichment caused by marine cage2011 nutrient enrichment caused by marine cage
2011 nutrient enrichment caused by marine cage
 
Differential Impacts of 2016 Coral Bleaching on Coral Reef Benthic communitie...
Differential Impacts of 2016 Coral Bleaching on Coral Reef Benthic communitie...Differential Impacts of 2016 Coral Bleaching on Coral Reef Benthic communitie...
Differential Impacts of 2016 Coral Bleaching on Coral Reef Benthic communitie...
 
Science Seminar Series 11 Camille Mellin
Science Seminar Series 11 Camille MellinScience Seminar Series 11 Camille Mellin
Science Seminar Series 11 Camille Mellin
 
Environmental conditions and zooplankton community structure in five ponds in...
Environmental conditions and zooplankton community structure in five ponds in...Environmental conditions and zooplankton community structure in five ponds in...
Environmental conditions and zooplankton community structure in five ponds in...
 
11.assessment of the vulnerability of water supply aquifers in parts of imo r...
11.assessment of the vulnerability of water supply aquifers in parts of imo r...11.assessment of the vulnerability of water supply aquifers in parts of imo r...
11.assessment of the vulnerability of water supply aquifers in parts of imo r...
 
Grimaldo_et_al_2004
Grimaldo_et_al_2004Grimaldo_et_al_2004
Grimaldo_et_al_2004
 
Inva_poster_FINAL
Inva_poster_FINALInva_poster_FINAL
Inva_poster_FINAL
 
Local human perturbations increase lakes vulnerability to climate changes: A ...
Local human perturbations increase lakes vulnerability to climate changes: A ...Local human perturbations increase lakes vulnerability to climate changes: A ...
Local human perturbations increase lakes vulnerability to climate changes: A ...
 
Changes in benthic communities in the Middle Atlas springs (Morocco) and thei...
Changes in benthic communities in the Middle Atlas springs (Morocco) and thei...Changes in benthic communities in the Middle Atlas springs (Morocco) and thei...
Changes in benthic communities in the Middle Atlas springs (Morocco) and thei...
 
The International Journal of Engineering and Science (The IJES)
 The International Journal of Engineering and Science (The IJES) The International Journal of Engineering and Science (The IJES)
The International Journal of Engineering and Science (The IJES)
 
2013 Vianna et al. Vertical movements of grey reef shark
2013 Vianna et al. Vertical movements of grey reef shark2013 Vianna et al. Vertical movements of grey reef shark
2013 Vianna et al. Vertical movements of grey reef shark
 
Zander 2007 - Allochthonous DOC in floodplain rivers
Zander 2007 - Allochthonous DOC in floodplain riversZander 2007 - Allochthonous DOC in floodplain rivers
Zander 2007 - Allochthonous DOC in floodplain rivers
 
MyctophidFeedingEcology
MyctophidFeedingEcologyMyctophidFeedingEcology
MyctophidFeedingEcology
 
SSFSaltMarshWriteUp
SSFSaltMarshWriteUpSSFSaltMarshWriteUp
SSFSaltMarshWriteUp
 
Trophic state indices and Phytoplankton quotients for the Kisumu Bay, Lake Vi...
Trophic state indices and Phytoplankton quotients for the Kisumu Bay, Lake Vi...Trophic state indices and Phytoplankton quotients for the Kisumu Bay, Lake Vi...
Trophic state indices and Phytoplankton quotients for the Kisumu Bay, Lake Vi...
 

Similar to 1996 hossainfs62 350 (2)

2009 assessment effects of cage culture on nitrogen
2009 assessment effects of cage culture on nitrogen2009 assessment effects of cage culture on nitrogen
2009 assessment effects of cage culture on nitrogenearambulm3
 
Raoui s.m rjpbcs 9(2), 1100 1110, 2018
Raoui s.m rjpbcs 9(2), 1100 1110, 2018Raoui s.m rjpbcs 9(2), 1100 1110, 2018
Raoui s.m rjpbcs 9(2), 1100 1110, 2018sidi mohammed RAOUI
 
Article Raoui S.M., rjpbcs 9(2), 1100 1110, 2018
Article Raoui S.M., rjpbcs 9(2), 1100 1110, 2018Article Raoui S.M., rjpbcs 9(2), 1100 1110, 2018
Article Raoui S.M., rjpbcs 9(2), 1100 1110, 2018sidi mohammed RAOUI
 
Raoui s.m rjpbcs 9(2), 1100 1110, 2018
Raoui s.m rjpbcs 9(2), 1100 1110, 2018Raoui s.m rjpbcs 9(2), 1100 1110, 2018
Raoui s.m rjpbcs 9(2), 1100 1110, 2018sidi mohammed RAOUI
 
Diversity and abundance of Macrobenthos in a subtropical estuary, Bangladesh
Diversity and abundance of Macrobenthos in a subtropical estuary, BangladeshDiversity and abundance of Macrobenthos in a subtropical estuary, Bangladesh
Diversity and abundance of Macrobenthos in a subtropical estuary, BangladeshAbdullaAlAsif1
 
Population dynamics of 15 fish species in Grand-Lahou lagoon (West Africa, Cô...
Population dynamics of 15 fish species in Grand-Lahou lagoon (West Africa, Cô...Population dynamics of 15 fish species in Grand-Lahou lagoon (West Africa, Cô...
Population dynamics of 15 fish species in Grand-Lahou lagoon (West Africa, Cô...Open Access Research Paper
 
The CARCACE project deepwater platforms - modular designs for in situ experim...
The CARCACE project deepwater platforms - modular designs for in situ experim...The CARCACE project deepwater platforms - modular designs for in situ experim...
The CARCACE project deepwater platforms - modular designs for in situ experim...Ædel Aerospace GmbH
 
Trends in Macrophyte Diversity in Anthropogenic Perturbed Lentic Ecosystems w...
Trends in Macrophyte Diversity in Anthropogenic Perturbed Lentic Ecosystems w...Trends in Macrophyte Diversity in Anthropogenic Perturbed Lentic Ecosystems w...
Trends in Macrophyte Diversity in Anthropogenic Perturbed Lentic Ecosystems w...Premier Publishers
 
Olamide Olabisi Final Year Project
Olamide Olabisi Final Year ProjectOlamide Olabisi Final Year Project
Olamide Olabisi Final Year ProjectOlamide Olabisi
 
The Potential use of Aquatic Ecosystems for Enhancement of the Rehabilitation...
The Potential use of Aquatic Ecosystems for Enhancement of the Rehabilitation...The Potential use of Aquatic Ecosystems for Enhancement of the Rehabilitation...
The Potential use of Aquatic Ecosystems for Enhancement of the Rehabilitation...Quarry Life Award by HeidelbergCement
 
Seasonal Histopathological Changes in Gill Structure of Orecohromis niloticus...
Seasonal Histopathological Changes in Gill Structure of Orecohromis niloticus...Seasonal Histopathological Changes in Gill Structure of Orecohromis niloticus...
Seasonal Histopathological Changes in Gill Structure of Orecohromis niloticus...iosrjce
 
Update Pamphlet for Hui Aloha O Kiholo Community Group
Update Pamphlet for Hui Aloha O Kiholo Community GroupUpdate Pamphlet for Hui Aloha O Kiholo Community Group
Update Pamphlet for Hui Aloha O Kiholo Community GroupChristine A. Waters
 
Analyses of Community Attributes of Meiofauna Under A Pollution Regime in the...
Analyses of Community Attributes of Meiofauna Under A Pollution Regime in the...Analyses of Community Attributes of Meiofauna Under A Pollution Regime in the...
Analyses of Community Attributes of Meiofauna Under A Pollution Regime in the...Agriculture Journal IJOEAR
 
Study of Seasonal Variations in Oxygen Consumption of Estuarine Clam, Meretri...
Study of Seasonal Variations in Oxygen Consumption of Estuarine Clam, Meretri...Study of Seasonal Variations in Oxygen Consumption of Estuarine Clam, Meretri...
Study of Seasonal Variations in Oxygen Consumption of Estuarine Clam, Meretri...ijtsrd
 
DuballPoster_CERFconference2015_PortlandOR
DuballPoster_CERFconference2015_PortlandORDuballPoster_CERFconference2015_PortlandOR
DuballPoster_CERFconference2015_PortlandORChelsea Duball
 
Condition index, meat yield and population structure of the
Condition index, meat yield and population structure of theCondition index, meat yield and population structure of the
Condition index, meat yield and population structure of theAlexander Decker
 

Similar to 1996 hossainfs62 350 (2) (20)

2009 assessment effects of cage culture on nitrogen
2009 assessment effects of cage culture on nitrogen2009 assessment effects of cage culture on nitrogen
2009 assessment effects of cage culture on nitrogen
 
The Characteristic Algal Mats and Flora of El-Timsah Lake
The Characteristic Algal Mats and Flora of El-Timsah LakeThe Characteristic Algal Mats and Flora of El-Timsah Lake
The Characteristic Algal Mats and Flora of El-Timsah Lake
 
Raoui s.m rjpbcs 9(2), 1100 1110, 2018
Raoui s.m rjpbcs 9(2), 1100 1110, 2018Raoui s.m rjpbcs 9(2), 1100 1110, 2018
Raoui s.m rjpbcs 9(2), 1100 1110, 2018
 
Article Raoui S.M., rjpbcs 9(2), 1100 1110, 2018
Article Raoui S.M., rjpbcs 9(2), 1100 1110, 2018Article Raoui S.M., rjpbcs 9(2), 1100 1110, 2018
Article Raoui S.M., rjpbcs 9(2), 1100 1110, 2018
 
Raoui s.m rjpbcs 9(2), 1100 1110, 2018
Raoui s.m rjpbcs 9(2), 1100 1110, 2018Raoui s.m rjpbcs 9(2), 1100 1110, 2018
Raoui s.m rjpbcs 9(2), 1100 1110, 2018
 
Diversity and abundance of Macrobenthos in a subtropical estuary, Bangladesh
Diversity and abundance of Macrobenthos in a subtropical estuary, BangladeshDiversity and abundance of Macrobenthos in a subtropical estuary, Bangladesh
Diversity and abundance of Macrobenthos in a subtropical estuary, Bangladesh
 
The Influence of Vertical Thermal and Dissolved Oxygen (DO) Trend on Some Fis...
The Influence of Vertical Thermal and Dissolved Oxygen (DO) Trend on Some Fis...The Influence of Vertical Thermal and Dissolved Oxygen (DO) Trend on Some Fis...
The Influence of Vertical Thermal and Dissolved Oxygen (DO) Trend on Some Fis...
 
Population dynamics of 15 fish species in Grand-Lahou lagoon (West Africa, Cô...
Population dynamics of 15 fish species in Grand-Lahou lagoon (West Africa, Cô...Population dynamics of 15 fish species in Grand-Lahou lagoon (West Africa, Cô...
Population dynamics of 15 fish species in Grand-Lahou lagoon (West Africa, Cô...
 
The CARCACE project deepwater platforms - modular designs for in situ experim...
The CARCACE project deepwater platforms - modular designs for in situ experim...The CARCACE project deepwater platforms - modular designs for in situ experim...
The CARCACE project deepwater platforms - modular designs for in situ experim...
 
Trends in Macrophyte Diversity in Anthropogenic Perturbed Lentic Ecosystems w...
Trends in Macrophyte Diversity in Anthropogenic Perturbed Lentic Ecosystems w...Trends in Macrophyte Diversity in Anthropogenic Perturbed Lentic Ecosystems w...
Trends in Macrophyte Diversity in Anthropogenic Perturbed Lentic Ecosystems w...
 
Olamide Olabisi Final Year Project
Olamide Olabisi Final Year ProjectOlamide Olabisi Final Year Project
Olamide Olabisi Final Year Project
 
The Potential use of Aquatic Ecosystems for Enhancement of the Rehabilitation...
The Potential use of Aquatic Ecosystems for Enhancement of the Rehabilitation...The Potential use of Aquatic Ecosystems for Enhancement of the Rehabilitation...
The Potential use of Aquatic Ecosystems for Enhancement of the Rehabilitation...
 
Mt lasut 2008-hg-cms
Mt lasut 2008-hg-cmsMt lasut 2008-hg-cms
Mt lasut 2008-hg-cms
 
Seasonal Histopathological Changes in Gill Structure of Orecohromis niloticus...
Seasonal Histopathological Changes in Gill Structure of Orecohromis niloticus...Seasonal Histopathological Changes in Gill Structure of Orecohromis niloticus...
Seasonal Histopathological Changes in Gill Structure of Orecohromis niloticus...
 
Update Pamphlet for Hui Aloha O Kiholo Community Group
Update Pamphlet for Hui Aloha O Kiholo Community GroupUpdate Pamphlet for Hui Aloha O Kiholo Community Group
Update Pamphlet for Hui Aloha O Kiholo Community Group
 
Analyses of Community Attributes of Meiofauna Under A Pollution Regime in the...
Analyses of Community Attributes of Meiofauna Under A Pollution Regime in the...Analyses of Community Attributes of Meiofauna Under A Pollution Regime in the...
Analyses of Community Attributes of Meiofauna Under A Pollution Regime in the...
 
Study of Seasonal Variations in Oxygen Consumption of Estuarine Clam, Meretri...
Study of Seasonal Variations in Oxygen Consumption of Estuarine Clam, Meretri...Study of Seasonal Variations in Oxygen Consumption of Estuarine Clam, Meretri...
Study of Seasonal Variations in Oxygen Consumption of Estuarine Clam, Meretri...
 
DuballPoster_CERFconference2015_PortlandOR
DuballPoster_CERFconference2015_PortlandORDuballPoster_CERFconference2015_PortlandOR
DuballPoster_CERFconference2015_PortlandOR
 
Condition index, meat yield and population structure of the
Condition index, meat yield and population structure of theCondition index, meat yield and population structure of the
Condition index, meat yield and population structure of the
 
Mpeza publication
Mpeza publicationMpeza publication
Mpeza publication
 

Recently uploaded

Russian Call Girls Nashik Anjali 7001305949 Independent Escort Service Nashik
Russian Call Girls Nashik Anjali 7001305949 Independent Escort Service NashikRussian Call Girls Nashik Anjali 7001305949 Independent Escort Service Nashik
Russian Call Girls Nashik Anjali 7001305949 Independent Escort Service Nashikranjana rawat
 
(NANDITA) Hadapsar Call Girls Just Call 7001035870 [ Cash on Delivery ] Pune ...
(NANDITA) Hadapsar Call Girls Just Call 7001035870 [ Cash on Delivery ] Pune ...(NANDITA) Hadapsar Call Girls Just Call 7001035870 [ Cash on Delivery ] Pune ...
(NANDITA) Hadapsar Call Girls Just Call 7001035870 [ Cash on Delivery ] Pune ...ranjana rawat
 
Call Girls Pune Airport Call Me 7737669865 Budget Friendly No Advance Booking
Call Girls Pune Airport Call Me 7737669865 Budget Friendly No Advance BookingCall Girls Pune Airport Call Me 7737669865 Budget Friendly No Advance Booking
Call Girls Pune Airport Call Me 7737669865 Budget Friendly No Advance Bookingtanu pandey
 
Call Girls In Okhla DELHI ~9654467111~ Short 1500 Night 6000
Call Girls In Okhla DELHI ~9654467111~ Short 1500 Night 6000Call Girls In Okhla DELHI ~9654467111~ Short 1500 Night 6000
Call Girls In Okhla DELHI ~9654467111~ Short 1500 Night 6000Sapana Sha
 
Booking open Available Pune Call Girls Budhwar Peth 6297143586 Call Hot Indi...
Booking open Available Pune Call Girls Budhwar Peth  6297143586 Call Hot Indi...Booking open Available Pune Call Girls Budhwar Peth  6297143586 Call Hot Indi...
Booking open Available Pune Call Girls Budhwar Peth 6297143586 Call Hot Indi...Call Girls in Nagpur High Profile
 
Environmental Toxicology (environmental biology)
Environmental Toxicology (environmental biology)Environmental Toxicology (environmental biology)
Environmental Toxicology (environmental biology)RaviPrajapat11
 
(ZARA) Call Girls Talegaon Dabhade ( 7001035870 ) HI-Fi Pune Escorts Service
(ZARA) Call Girls Talegaon Dabhade ( 7001035870 ) HI-Fi Pune Escorts Service(ZARA) Call Girls Talegaon Dabhade ( 7001035870 ) HI-Fi Pune Escorts Service
(ZARA) Call Girls Talegaon Dabhade ( 7001035870 ) HI-Fi Pune Escorts Serviceranjana rawat
 
DENR EPR Law Compliance Updates April 2024
DENR EPR Law Compliance Updates April 2024DENR EPR Law Compliance Updates April 2024
DENR EPR Law Compliance Updates April 2024itadmin50
 
NO1 Verified kala jadu karne wale ka contact number kala jadu karne wale baba...
NO1 Verified kala jadu karne wale ka contact number kala jadu karne wale baba...NO1 Verified kala jadu karne wale ka contact number kala jadu karne wale baba...
NO1 Verified kala jadu karne wale ka contact number kala jadu karne wale baba...Amil baba
 
BOOK Call Girls in (Dwarka) CALL | 8377087607 Delhi Escorts Services
BOOK Call Girls in (Dwarka) CALL | 8377087607 Delhi Escorts ServicesBOOK Call Girls in (Dwarka) CALL | 8377087607 Delhi Escorts Services
BOOK Call Girls in (Dwarka) CALL | 8377087607 Delhi Escorts Servicesdollysharma2066
 
VIP Call Girls Service Tolichowki Hyderabad Call +91-8250192130
VIP Call Girls Service Tolichowki Hyderabad Call +91-8250192130VIP Call Girls Service Tolichowki Hyderabad Call +91-8250192130
VIP Call Girls Service Tolichowki Hyderabad Call +91-8250192130Suhani Kapoor
 
VVIP Pune Call Girls Koregaon Park (7001035870) Pune Escorts Nearby with Comp...
VVIP Pune Call Girls Koregaon Park (7001035870) Pune Escorts Nearby with Comp...VVIP Pune Call Girls Koregaon Park (7001035870) Pune Escorts Nearby with Comp...
VVIP Pune Call Girls Koregaon Park (7001035870) Pune Escorts Nearby with Comp...Call Girls in Nagpur High Profile
 
VIP Call Girls Service Chaitanyapuri Hyderabad Call +91-8250192130
VIP Call Girls Service Chaitanyapuri Hyderabad Call +91-8250192130VIP Call Girls Service Chaitanyapuri Hyderabad Call +91-8250192130
VIP Call Girls Service Chaitanyapuri Hyderabad Call +91-8250192130Suhani Kapoor
 
(ANIKA) Call Girls Wagholi ( 7001035870 ) HI-Fi Pune Escorts Service
(ANIKA) Call Girls Wagholi ( 7001035870 ) HI-Fi Pune Escorts Service(ANIKA) Call Girls Wagholi ( 7001035870 ) HI-Fi Pune Escorts Service
(ANIKA) Call Girls Wagholi ( 7001035870 ) HI-Fi Pune Escorts Serviceranjana rawat
 
Low Rate Call Girls Bikaner Anika 8250192130 Independent Escort Service Bikaner
Low Rate Call Girls Bikaner Anika 8250192130 Independent Escort Service BikanerLow Rate Call Girls Bikaner Anika 8250192130 Independent Escort Service Bikaner
Low Rate Call Girls Bikaner Anika 8250192130 Independent Escort Service BikanerSuhani Kapoor
 
Sustainable Clothing Strategies and Challenges
Sustainable Clothing Strategies and ChallengesSustainable Clothing Strategies and Challenges
Sustainable Clothing Strategies and ChallengesDr. Salem Baidas
 

Recently uploaded (20)

Call Girls In Yamuna Vihar꧁❤ 🔝 9953056974🔝❤꧂ Escort ServiCe
Call Girls In Yamuna Vihar꧁❤ 🔝 9953056974🔝❤꧂ Escort ServiCeCall Girls In Yamuna Vihar꧁❤ 🔝 9953056974🔝❤꧂ Escort ServiCe
Call Girls In Yamuna Vihar꧁❤ 🔝 9953056974🔝❤꧂ Escort ServiCe
 
Russian Call Girls Nashik Anjali 7001305949 Independent Escort Service Nashik
Russian Call Girls Nashik Anjali 7001305949 Independent Escort Service NashikRussian Call Girls Nashik Anjali 7001305949 Independent Escort Service Nashik
Russian Call Girls Nashik Anjali 7001305949 Independent Escort Service Nashik
 
(NANDITA) Hadapsar Call Girls Just Call 7001035870 [ Cash on Delivery ] Pune ...
(NANDITA) Hadapsar Call Girls Just Call 7001035870 [ Cash on Delivery ] Pune ...(NANDITA) Hadapsar Call Girls Just Call 7001035870 [ Cash on Delivery ] Pune ...
(NANDITA) Hadapsar Call Girls Just Call 7001035870 [ Cash on Delivery ] Pune ...
 
Call Girls Pune Airport Call Me 7737669865 Budget Friendly No Advance Booking
Call Girls Pune Airport Call Me 7737669865 Budget Friendly No Advance BookingCall Girls Pune Airport Call Me 7737669865 Budget Friendly No Advance Booking
Call Girls Pune Airport Call Me 7737669865 Budget Friendly No Advance Booking
 
Call Girls In Okhla DELHI ~9654467111~ Short 1500 Night 6000
Call Girls In Okhla DELHI ~9654467111~ Short 1500 Night 6000Call Girls In Okhla DELHI ~9654467111~ Short 1500 Night 6000
Call Girls In Okhla DELHI ~9654467111~ Short 1500 Night 6000
 
Booking open Available Pune Call Girls Budhwar Peth 6297143586 Call Hot Indi...
Booking open Available Pune Call Girls Budhwar Peth  6297143586 Call Hot Indi...Booking open Available Pune Call Girls Budhwar Peth  6297143586 Call Hot Indi...
Booking open Available Pune Call Girls Budhwar Peth 6297143586 Call Hot Indi...
 
Environmental Toxicology (environmental biology)
Environmental Toxicology (environmental biology)Environmental Toxicology (environmental biology)
Environmental Toxicology (environmental biology)
 
(ZARA) Call Girls Talegaon Dabhade ( 7001035870 ) HI-Fi Pune Escorts Service
(ZARA) Call Girls Talegaon Dabhade ( 7001035870 ) HI-Fi Pune Escorts Service(ZARA) Call Girls Talegaon Dabhade ( 7001035870 ) HI-Fi Pune Escorts Service
(ZARA) Call Girls Talegaon Dabhade ( 7001035870 ) HI-Fi Pune Escorts Service
 
DENR EPR Law Compliance Updates April 2024
DENR EPR Law Compliance Updates April 2024DENR EPR Law Compliance Updates April 2024
DENR EPR Law Compliance Updates April 2024
 
NO1 Verified kala jadu karne wale ka contact number kala jadu karne wale baba...
NO1 Verified kala jadu karne wale ka contact number kala jadu karne wale baba...NO1 Verified kala jadu karne wale ka contact number kala jadu karne wale baba...
NO1 Verified kala jadu karne wale ka contact number kala jadu karne wale baba...
 
Green Marketing
Green MarketingGreen Marketing
Green Marketing
 
E Waste Management
E Waste ManagementE Waste Management
E Waste Management
 
BOOK Call Girls in (Dwarka) CALL | 8377087607 Delhi Escorts Services
BOOK Call Girls in (Dwarka) CALL | 8377087607 Delhi Escorts ServicesBOOK Call Girls in (Dwarka) CALL | 8377087607 Delhi Escorts Services
BOOK Call Girls in (Dwarka) CALL | 8377087607 Delhi Escorts Services
 
VIP Call Girls Service Tolichowki Hyderabad Call +91-8250192130
VIP Call Girls Service Tolichowki Hyderabad Call +91-8250192130VIP Call Girls Service Tolichowki Hyderabad Call +91-8250192130
VIP Call Girls Service Tolichowki Hyderabad Call +91-8250192130
 
VVIP Pune Call Girls Koregaon Park (7001035870) Pune Escorts Nearby with Comp...
VVIP Pune Call Girls Koregaon Park (7001035870) Pune Escorts Nearby with Comp...VVIP Pune Call Girls Koregaon Park (7001035870) Pune Escorts Nearby with Comp...
VVIP Pune Call Girls Koregaon Park (7001035870) Pune Escorts Nearby with Comp...
 
Model Call Girl in Rajiv Chowk Delhi reach out to us at 🔝9953056974🔝
Model Call Girl in Rajiv Chowk Delhi reach out to us at 🔝9953056974🔝Model Call Girl in Rajiv Chowk Delhi reach out to us at 🔝9953056974🔝
Model Call Girl in Rajiv Chowk Delhi reach out to us at 🔝9953056974🔝
 
VIP Call Girls Service Chaitanyapuri Hyderabad Call +91-8250192130
VIP Call Girls Service Chaitanyapuri Hyderabad Call +91-8250192130VIP Call Girls Service Chaitanyapuri Hyderabad Call +91-8250192130
VIP Call Girls Service Chaitanyapuri Hyderabad Call +91-8250192130
 
(ANIKA) Call Girls Wagholi ( 7001035870 ) HI-Fi Pune Escorts Service
(ANIKA) Call Girls Wagholi ( 7001035870 ) HI-Fi Pune Escorts Service(ANIKA) Call Girls Wagholi ( 7001035870 ) HI-Fi Pune Escorts Service
(ANIKA) Call Girls Wagholi ( 7001035870 ) HI-Fi Pune Escorts Service
 
Low Rate Call Girls Bikaner Anika 8250192130 Independent Escort Service Bikaner
Low Rate Call Girls Bikaner Anika 8250192130 Independent Escort Service BikanerLow Rate Call Girls Bikaner Anika 8250192130 Independent Escort Service Bikaner
Low Rate Call Girls Bikaner Anika 8250192130 Independent Escort Service Bikaner
 
Sustainable Clothing Strategies and Challenges
Sustainable Clothing Strategies and ChallengesSustainable Clothing Strategies and Challenges
Sustainable Clothing Strategies and Challenges
 

1996 hossainfs62 350 (2)

  • 1. See discussions, stats, and author profiles for this publication at: https://www.researchgate.net/publication/283253816 Density, Biomass and Community Structure of Megabenthos in Ise Bay, Central Japan Article  in  Fisheries Science · June 1996 CITATIONS 15 READS 8 3 authors, including: Some of the authors of this publication are also working on these related projects: Genetic transformation View project Crops and vegetables View project Md Ismail Hossain Manarat International University 845 PUBLICATIONS   5,235 CITATIONS    SEE PROFILE Hideo Sekiguchi Mie University 91 PUBLICATIONS   948 CITATIONS    SEE PROFILE All content following this page was uploaded by Hideo Sekiguchi on 14 December 2015. The user has requested enhancement of the downloaded file.
  • 2. Fisheries Science 62(3), 350-360 (1996) Density, Biomass and Community Structure of Megabenthos in Ise Bay, Central Japan Moazzem Hossain, Tetsuya Amakawa, and Hideo Sekiguchi Faculty of Bioresources, Mie University, Kamihama-cho, Tsu, Mie 514, Japan (Received June 19, 1995) In order to know the general features of megabenthos in Ise Bay in relation to the development and prevalence of oxygen-poor water in summer, an investigation was undertaken throughout the year from April 1993 to April 1994. Crustaceans and fishes were absolutely dominant from April to September 1993, while echinoderms being dominant since November. Five species of megabenthos were absolutely dominant: Oratosquilla oratoria (Stomatopoda), Carcinoplax vestita, Charybdis bimaculata (Brachyura), Luidia quinaria (Asteroidea), and Repomucenus valenciennei (Pisces). Community struc ture (e.g. species diversity, ABC-comparison, rank-abundance relationships and community type) of megabenthos in Ise Bay drastically changed with season, intimately related with development and perishment of oxygen-poor water at the bottom of the bay. Key words: megabenthos, community ecology, oxygen-poor water A relatively large number of studies have been carried out on the slope and deep-sea megabenthos communit ies1,2) and commercially important demersal fish communi ties,3-6) but it is ironical that there is little information avail able on megabenthos communities in the inlet and coastal waters. In the inlet and coastal waters, oxygen-poor water de velops and prevails in the bottom layer every summer mainly due to eutrophication. Consequently defaunation takes place. In particular, mass mortality of macrobenthos and commercially important megabenthos (e.g. bivalves, fishes etc.) caused by the development of oxygen-poor water has frequently been reported.7-11)Unfortunately, ex cept for comprehensive works on commercially important megabenthos done in Tokyo Bay,10,12)Ifeatures of megaben thos communities in the inlet and coastal waters and fur ther influences upon the communities of oxygen-poor water have not yet been examined in detail. The present study was undertaken in order to know seasonal variations in the general features of megabenthos communities in Ise Bay, particularly focussing on the influences upon megabenthos communities of oxygen poor water which develops every summer in the bay. Materials and Methods Study Area Ise Bay is a semi-closed bay located along the Pacific coast of central Japan and covers a surface area of 1,738 km2 with a mean depth of 19.5 m'3) (Fig. 1). The depth is slightly more than 30 m in the main basin and separated from the Pacific Ocean through the Irago passage, 13 km wide and 73 m deep. The Kiso Rivers (Kiso, Nagara and Ibi), one of the biggest rivers in Japan, flow into the inner most part of the bay. The northern and central parts of the bay have silt-clay bottom sediments, while the south and southwestern parts have bottom sediments of sand, muddy sand and sandy gravel (Fig. 2). The water in the bay is rich in nutrients and highly tur bid due to the freshwater discharge and sewage effluent from the cities situated on the western and northern coasts of the bay. With the recent progress of eutrophication in the bay, red tides have often been observed, so that the dis Fig. 1. Ise Bay and the location of sampling stations . The solid circles and lines indicate sampling stations and depth isopleth in meter, respectively.
  • 3. Community Ecology of Megabenthos in Ise Bay 351 Fig. 2. Bottom sediment types in Ise Bay (from Kitamori et al.30)) C-f sand indicates coarse to fine sand. solved oxygen content in the bottom layer of the bay shows remarkable changes with the season, particularly oxygen-poor water prevailing mainly in the central part of the bay every summer.9) Seasonal and spatial distributions of the dissolved oxygen content in the bay are shown in Fig. 3. In the present study oxygen-poor water (i.e. 2 ppm or less) oc curred and prevailed widely in the bottom layer (1 m above the bay bottom) of the central part of the bay mainly dur ing July to October, particularly in August. Of course, a similar situation has often been observed in the bay in the previous years.9,13) However, strong mixing of water due to typhoons passing by the bay more times in the summer of 1993 prevented extreme oxygen-poor water from develop ing and prevailing in the bottom layer of the central part of the bay. Sampling and Data Processing Samples were obtained six times (27-28 April 1993, 1-2 July 1993, 13, 17 September 1993, 24-25 November 1993, 19-20 January 1994 and 13-14 April 1994) in Ise Bay on board the T/V Seisui Maru of Mie University, and at 15 19 sampling stations during each sampling time (Fig. 1). For sampling megabenthos, a gear (a small fishing trawl net) was towed on the bottom with a 900 m distance, usu ally done for 15 minutes with a ship speed of 2 knots (1 m/ sec) at each station. But a sampling in September 1993 was done on board a small fishing boat. The gear was towed with a ship speed of 3 knots. Accordingly, the bottom area covered at each station is equivalent to ca. 1500 m2. This gear has an iron frame fixed to the net that is 4.4 m length with a stretch mesh size of 27 mm (Fig. 4). This iron frame has a length and height of 165 cm and 30 cm, respectively, and is provided with a number of thorns (13 cm height) along the bottom side of the frame. We define here the term 'megabenthos' as benthic animals collected using this gear, though we neglected fish with total lengths exceeding 15 cm (except R. valenciennei) because of avoiding ex treme bias due to the occurrence of a few species. Catches, being frozen immediately after sampling, were identified, to the specific level, and numbers and weights of specimens of each species were measured in the labora tory. As measures of species diversity, the number of species Fig. 3. Seasonal change of the dissolved oxygen content (ppm) in water 1 m just above the bottom in Ise Bay (from Prompt Report of Mie Prefectur al Institute of Fisheries Technology). The shady area indicates the area with the dissolved oxygen content less than 2 ppm.
  • 4. 352 Hossain et at. Fig. 4. Schematic illustration of a megabenthos sampling gear . (SR), Shannon-Wiener function (H•Œ) and equitability in dex (E) (Pielou's evenness component of diversity, see J•Œ in Pielou14)) were used. The later two indices, based on in formation theory, were calculated from the following: Where SR=number of species in a sample, Ni=number of individuals (or weights) of the i-th species in the sample and N=total number of individuals (or total weights) of the sample. For classification of community types based on the spe cies composition, the similarity index C,n15)was used. The index between the i-th sample and j-th sample is: where nik and n;k are the density of species k in samples i and j, respectively. A BASIC program of clustering by group average method16) was employed for the between sample similarity matrices constructed by the Cn index. Known as one way to characterize a community is a rank-abundance diagram.17) The diagram shows the relationship between relative abundance Pi and rank i, where i is the sequence of species from the most to least abundance based on the number of individuals or on weights. The observed patterns were compared to the fol Table 1. Seasonal variations in number of megabenthos taxa and species diversity in Ise Bay H•Œ (in ind.), number-based species diversity of Shannon-Wiener function; H•Œ (in wt.) , weight-based species diversity of Sbannon-Wiener function .
  • 5. Community Ecology of Megabenthos in Ise Bay 353 lowing three models: geometric series,18) broken stick modell9) and lognormal distribution.20) Results Seasonal and Spatial Distributions of the Number of Spe cies and Species Diversity of Megabenthos in the Bay T he total number of 132 megabenthos species were iden tified in the bay, so the number of species ranged from 45 (in September 1993) to 73 (in April 1994) (Table 1). Four taxa (crustaceans, molluscans, echinoderms and fishes) were predominant throughout the investigations; the num bers of species of crustaceans, molluscans, echinoderms and fishes were 32, 33, 13 and 39, respectively. On the other hand, the overall species diversity H•Œ that was based on the number of individuals ('number diversity') ranged from 1.62 (0.48-2.38 at each station in July) to 2.60 (1.24 2.59 at each station in April 1994), while that based on weights ('biomass diversity') ranged from 1.18 (0.5-2.40 at each station in November 1993) to 2.17 (1.08-2.77 at each station in April 1993) (Table 1). Seasonal variations were not similar between these two indices. Interestingly, the 'biomass diversity' was clearly higher than the 'number diversity' from April to September 1993, while the reverse occurred from November 1993 to April 1994. Spatial distributions of the number of species per sta tion are shown in Fig. 5. In April 1993, higher numbers of species were found mainly in the central part of the bay with the highest being 31 at stn. 9. Then, a decrease of the numbers was detected in the same part in July and Septem ber with the highest being 23. Although the number of spe cies of megabenthos continued to decrease at most of the stations, particularly at stations within the central part of the bay from April to September 1993, the total number of species were a little higher in July than in April 1993 (Table 1). Interestingly, in April 1994, a higher number of species were found mainly in the southern part of the bay, much different from the case in April 1993 (Fig. 5). On the Fig. 5. Spatial distributions of species richness (number of species per station) of megabenthos in Ise Bay. Solid circles indicate sampling stations. Table 2. Relationships between species diversity and density of megabenthos in Ise Bay +, positive type of correlation; -, negative type of correlation; P, level of sig nificance (F-test); H•Œ, Shannon-Wiener function; SR, number of species; E, equitability index; ind, individual; wt, weight; ns, not significant. other hand, spatial distributions of species diversities were not similar to those of the number of species per station, rather higher diversities were found mainly in the areas where the number of species was lower. This indecates that species diversities are influenced strongly by distribution of individuals among species rather than the number of species. Relationships between species diversity (H•Œ) and den sity, between number of species (SR) and density, between equitability index (E) and density, and between species diversity and number of species are shown in Table 2. Simi
  • 6. 354 Hossain et al. lar tendencies were found between the number-based and weight-based relationships. According to our investiga tions, both of the species diversity and equitability index fluctuated in inverse proportion to density (except Sept. 93), while the number of species was proportional to den sity (except July 93). Furthermore, relationships between species diversity and species richness were not significant statistically at any sampling time except for September 1993. Whether establishment of the relationships occur or not clearly depended on sampling times and/or on seasons (Table 2). Seasonal and Spatial Distributions of the Biomass and Density of Megabenthos The biomass of megabenthos and percentages in weights of different taxa are shown in Table 3. The biomass of megabenthos and crustaceans (one of the dominant taxa among megabenthos) showed a similar tendency to decrease from April towards September 1993. Three taxa (crustaceans, molluscans and fishes) were predominant from April to September 1993: biomass of crustaceans was first in rank, occupying 70% or more of the megabenthos biomass while that of fish was second in rank, occupying 10% or more of the same. On the other hand, since Novem ber 1993 the biomass of megabenthos increased again with the highest being in April 1994. The biomass of echinoderms was in first rank during this period. Of the megabenthos species collected in the present study, the following five species were absolutely dominant in biomass: O. oratoria (Stomatopoda), C. vestita, Ch. bi maculata (Brachyura), L. quinaria (Asteroidea) and R. valenciennei (Pisces). Seasonal changes of biomasses of these species are shown in Table 4. The five species occu pied 32% of megabenthos biomass in November 1993 and 82% in April 1994. These five species can broadly be clas sified into two groups according to seasonal variations in their biomass (Table 4). Biomass of the first group (R. valenciennei, C. vestita, Ch. bimaculata and O. oratoria) occurred abundantly during April to September 1993 and decreased drastically in November. Among the species of the first group, biomasses of R. valenciennei, C. vestita and Ch. bimaculata were highest in April and decreased toward July 1993, while the biomass of O. oratoria was highest in September 1993 and decreased toward January 1994. On the other hand, biomass of the second group (L. quinaria) was abundantly found in November and con Fig. 6. Spatial distributions of density (wet weight, gram per station) of megabenthos in Ise Bay. Solid circles indicate sampling stations. Table 3. Seasonal variations in megabenthos biomass in Ise Bay
  • 7. Community Ecology of Megabenthos in Ise Bay 355 Table 4. Seasonal variations in biomass of five dominant megabenthos species in Ise Bay tinued to be predominant among the megabenthos since then. Spatial distributions of megabenthos density (weight per station) are shown in Fig. 6. Higher densities were found mainly in the whole central part of the bay in April to July 1993with the highest being 5 kg/stn and 7 kg/stn, respec tively. Then, in September several higher densities of more than 3 kg/stn were located separately at the marginal sta tions within the central part of the bay. In November 1993 to April 1994, higher densities were found at western or eastern sides of the central to the southern parts of the bay. From April to September 1993, spatial distributions of the C. vestita density were similar to those of the megabenthos density, while since November the distribu tions of L. quinaria were similar to those of the megaben thos density. Marked contrasts were detected in dominant species, biomasses and spatial distributions of megabenthos den sitybetween April of both years (1993 and 1994) (Tables 3, 4; Fig. 6). Community Types Based on Species Composition Clustering analysis, that used the similarity index (Ca) measured by the number of individuals or by weights of each megabenthos species at each station, revealed several community types as shown in Fig. 7. Clustering patterns were similar between the clustering analyses based on num ber of individuals and on weights, so in the following we refer only to the analysis based on the number of individ uals. We defined A-1, A-2, A-3, E and F-3 as the major communities, while the others were done as minor com munities. However, some communities that occupied one or two stations with meager number of megabenthos were neglected. Spatial distributions of different community types are shown in Fig. 8. The major community type A-1 was de tected in April and July 1993. This community occupied the central to innermost part of the bay, and was dominat ed by four species (C. vestita, Ch. bimaculata, 0. oratoria and R. valenciennei). The community B in April 1993 was composed of species other than the four dominant species mentioned above, while the community C in July was dominated by Styela clava (Ascidiacea). In September 1993 the community A-1 was divided into two communi ties A-2 and A-3. The community A-2, that was dominat ed by 0. oratoria, occupied the western area of the central to innermost parts of the bay, while the community A-3 was dominated by C. vestita and Ch. bimaculata and occu pied the eastern area of the same parts. However, a drastic change of megabenthos communities was observed in November as indicated in the previous sec tion (Table 3; Fig. 6). Since November 1993 one major community E, that was dominated by L. quinaria, occu pied wider part of the bay (Fig. 8) while the other minor communities (A-4, A-5, F-1, F-2, F-4, G) were composed mainly of C. vestita, 0. oratorio, Echinocardium corda tum (Echinoidea) and Fulvia mutica (Bivalvia). The rank-abundance diagram of megabenthos at each station, based on the number of individuals, is shown in Fig. 9. Since the patterns of number-based and weight based rank-abundance diagrams were found to be almost similar, so in the following we refer only to the diagram based on the number of individuals. Most of the stations indicated linear arrangement of rank-abundance diagrams that suggested geometric series with high abundance of a few species. However, patterns of the diagrams differed much depending on station and season. Rank-abundance diagrams of each community type and of the whole megabenthos in the bay are shown in Fig. 10. Regardless of seasons and types of major communities, patterns of the diagrams were similar to each other, though the dominant species were replaced according to seasons and types of community as mentioned above and also as shown in Tables 3 and 4. The major communities (A-1, A-2, A-3, E and F-3) including many stations (i.e. larger sample sizes) showed that the observed patterns are more likely fitted to lognormal distribution, while those in the minor communities are fitted to geometric series (Figs. 9, 10). The combined 'number and biomass curves' are shown in Fig. 11. The 'number curves' were above the 'biomass curves' from April to September 1993 for the major com munities and also the whole megabenthos in the bay, in dicating higher 'biomass diversity' than 'number diversity'
  • 8. 356 Hossain et al. Fig. 7. Dendrograms showing the classification of community types in Ise Bay. Numericals and alphabet letters indicate sampling stations and community types, respectively. Community types are based on the similarlity in dex measured by species composition in terms of number of individuals. See text for further explanation. (Table 1), while the reverse occurred from November when oxygen-poor water, which developed and prevailed in sum mer, disappeared (Fig. 3). Discussion As is well known, with the progress of eutrophication, Ise Bay and other bays (estuaries) show marked seasonal variations in environmental conditions, particularly de velopment and prevalence of oxygen-poor water at the bot tom in summer.9) The development and prevalence of oxygen-poor water at the bottom indicate the occurrence of other more deteriorated conditions for benthic organ isms, i.e. hydrogen sulfide and etc. Thus, oxygen-poor water, which is related intimately with production of hydrogen sulfide, has a great influence on benthic animals.8,11)Apparently in response to the development and prevalence of oxygen-poor water in every summer, fea tures of megabenthos communities in the bays may show marked seasonal and also interannual variations,9) e.g. in species composition, species diversity, biomass, communi ty types, their spatial distributions and so on, as made clear in the previous section of the present study. As shown in the present study, marked contrasts were observed between features of megabenthos communities before and after October: Dominant species were replaced (Table 4) with season, i.e. L. quinaria was predominant among megabenthos in November and onward while crustaceans (0. oratoria, C. vestita and Ch. bimaculata) were predominant before November. However, based on size distribution of the species (L. quinaria) in November Fig. 8. Spatial distributions of community types identified in Ise Bay. Alphabet letters and solid circles indicate community types and sampling stations, respectively. (unpublished data), specimens of the species were com posed of two large-sized cohorts (probably year classes), The reason why the catch of this species abruptly increased in November is unknown. The lowest number of species and also the lowest biomass of the total megabenthos were found in September (Tables 1 and 3). The lowest number
  • 9. Community Ecology of Megabenthos in Ise Bay 357 Fig. 9. Rank-abundance diagrams of megabenthos at each station in Ise Bay. Rank indicates the sequence of the most to the least in terms of number of individuals. See text for further explanation. of species in September may be attributed to influences of the prevalence of oxygen-poor water in the bay. Seasonal variations in number and weight-based spe ciesdiversitywere not similar to each other. The weight based diversitywas always higher than the number-based diversitybefore November while the reversewas true since November (Table 1), so that according to the so-called ABCmethod of Warwick21) 'number curves' were above 'biomasscurves' before November while the reverse was truesinceNovember (Fig. 11). Based on Warwick,21)War wick et al.,22)and Beukema,25)'biomass curves' above ' numbercurves' indicate benthic communities under sta ble and/or undisturbed conditions, while the reverse oc cursfor the communities under unstable and/or disturbed conditions.In megabenthos communities of Ise Bay, 'bio masscurves'above 'number curves' may indicate re-estab lishmentor recovery of the communities in November and onward when the oxygen-poor water disappeared in the whole bay. These marked seasonal variations could be caused by the development and prevalence of oxygen-poor water in summer with the deteriorated conditons at the bot tom of the bay, that is supported by spatial distributions in July to September of species number and megabenthos density in the bay. Unfortunately, it is not apparent whether drastic changes in megabenthos communities, as found in the present study, occur every year or not, and further about mechanisms by which these variations are caused and the megabenthos communities are re-estab lished in the bay. Deducing from differences between fea tures of megabenthos in the bay in April 1993 and in April 1994, marked interannual variations in megabenthos com munities may be detected in addition to the above-men tioned seasonal variations. It has been well-known that features of bottom sedi ment affect the distribution, and the structure and func tion of benthic communities .26-28)Clustering analysis using a similarity index revealed several major megabenthos com munities in the bay throughout the study period. Some
  • 10. 358 Hossain et al. Fig. 10. Rank-abundance diagrams of total megabenthos catches and major community types in Ise Bay. Alphabet letters and rank indicate community types and the sequence of the most to the least in terms of number of individuals. See text for fur ther explanation. communities appeared to be related intimately with a cer tain sediment type, e.g. the three major communities (A-l, A-2, A-3) in which crustaceans and fishes were predominant mainly occupied the central to the innermost parts of the bay where we find silt-clay bottom sediment (Fig. 8), indicating highly enriched and/or organic con tents. However, the other major communities (E, F-3) in which echinoderms were predominant, extended over several types of bottom sediment (Fig. 8). In particular, distributional patterns of L. quinaria, the absolutely dominant species among the communities, contributed to form much weaker relationships between types of several major megabenthos communities (E, F-3) and sediment in the bay. Regardless of bottom sediment types, seasons and posi tions of sampling, rank-abundance diagrams of the major communities in the bay showed lognormal distribution that indicates high relative abundance of a few species (Fig. 10). This is the case for total megabenthos in the bay. Differences of the patterns of rank-abundance diagrams be tween the major and minor communities may lack ecologi cal meaning, because those probably depend on sample size as already pointed out by Morishita.24) Thus, the rank abundance diagram at each station (smaller sample size)is fitted to geometric series (Fig. 9), while those of the major communities or of the whole megabenthos assemblages in the bay (larger sample size) are fitted to lognormal distribu tion (Fig. 10). To our knowledge, there is no information on rank-abundance models for megabenthos communi ties, but a lognormal distribution model is fitted to demer sal fish communities on the shelf and slope waters.) May29) suggests that rank-abundance diagrams of the communi ties that include a large number of species, fulfilling diverse niches, are often consistent with a lognormal distri bution model. Unfortunately, except for commercially important de mersal fish communities, very little work has yet been done for megabenthos communities in the inlet and coastal waters. Of that work, information on megabenthos is available for Tokyo Bay as compared to our present work done in Ise Bay. Tokyo Bay is a semi-closed bay located along the Pacific coast of central Japan, being ca. 300 km north of Ise Bay, and covers a surface area of ca. 1,000 km2 with a mean
  • 11. Community Ecology of Megabenthos in Ise Bay 359 Fig. 11. Abundance/biomass comparisons of total megabenthos catches and major community types in Ise Bay. H•Œ (in ind) and H•Œ (in wt) indicate number and weight-based species diversity of Shannon-Wiener function, respectively. N and W indicate number of individuals and weight, respectively. Rank indicates the sequence of the most to the least in terms of number of individuals or weight. See text for further explanation. depth of 17 m. The bay water is rich in nutrients and is highly turbid mainly due to sewage effluent from the cities situated on the western and northern coasts of the bay.9) This indicates Tokyo and Ise Bays are comparable in ge ographical and oceanographical conditions, therefore a comparison can be made between megabenthos communi
  • 12. 360 Hossain et al. ties of Tokyo and Ise Bays. Dr. Shimizu and his colleaguest10,12)have done much work on the megabenthos community in Tokyo Bay, though concentrating on commercially important groups and using a sampling method different from ours (see, Shimizu 10))According to Shimizu10)and Tokimura,12) fish es and crustaceans were the predominant groups in the bay (excluding Asteroidea), of which two species were predominant in numbers throughout the year: R. valen ciennei (Pisces) and O. oratoria (Stomatopoda). Oxygen poor water develops every summer in the northern to cen tral part of the bay where defaunation took place, so that megabenthos were mainly found in the southern part of the bay during summer, while in other seasons they were distributed in the central to innermost parts probably in response to recovery of the environmental conditions in the bay. Being similar to the megabenthos communities in Tokyo Bay as referred above, fishes, crustaceans and echinoderms were predominant groups in IssseBay, of which the follow ing five species were predominant and drastically replaced with season: R. valenciennei (Pisces), C. vestita and Ch. bi maculata (Brachyura), O. oratoria (Stomatopoda) and L. quinaria (Asteroida). It remains difficult to say whether seasonal replacement of the dominant species is a regular event in the bay every year or not. The total number of megabenthos species collected in Tokyo Bay is 198 while the total collected in Ise Bay is 132. In summary, although the two bays are comparable in geographical and oceanographical conditions, features of megabenthos com munities are much different between the two bays. References 1) R. L. Haedrich, G. T. Rowe, and P. T. Polloni: The megabenthic fauna in the deep sea south of New England, USA. Mar. Biol., 57, 165-179 (1980). 2) J. D. Gage and P. A. Tyler: Deep-Sea Biology, Cambridge Univer sity Press, Cambridge, 1991, p. 504. 3) T. Hanaoka: Characteristics of commercial catches in inlet water of Japan. Bull. Coast. Oceanogr., 7, 24-27 (1969) (in Japanese). 4) K. Mito: Food relationships in the demersal fish community in the Bering Sea. 1. Community structure and distributional patterns of fish species. Res. Inst. North Pacific Fish. Fac. Fish. Hokkaido Univ., Special volume, 205-258 (1977) (in Japanese). 5) G. S. Hefman: Patterns of community structure in fishes: summma ry and overview. Envir. Biol. Fish., 3, 129-148 (1978). 6) T. Fujita, T. Inada, and Y. Ishito: Density, biomass and communi ty structure of demersal fishes off the Pacific coast of northeastern Japan. J. Oceanogr., 49, 211-229 (1993). 7) S. L. Santos and J. L. Simons: Response of soft-bottom benthos to annual catastrophic disturbance in a south Florida estuary. Mar. Ecol. Prog. Ser., 3, 347-355 (1980). 8) H. Imabayashi: Effects of oxygen-deficient water on the benthic communities. Nippon Suisan Gakkaishi, 49, 7-16 (1983) (in Japanese). 9) Oceanographic Society of Japan: Coastal Oceanography of Japanese Islands, Tokai Univ. Press, Tokyo, 1983, p. 839 (in Japanese). 10) M. Shimizu: Distribution of benthic fishes and shellfishes in Tokyo Bay. Bull, Coast. Oceanogr., 25, 96-103 (1988) (in Japanese). 11) T. Furota: Effects of low-oxygen water on benthic sessile animal communities in Tokyo Bay. Bull. Coast. Oceanogr., 25, 104-113 (1988) (in Japanese). 12) M. Tokimura: On the structure of the distribution of demersalfish and shellfishin the inner part of Tokyo Bay, Ph. D. thesis, Univer sity of Tokyo, Tokyo, 1985, p. 156 (in Japanese). 13) Y. Saijo and S. Unoki: Oceanographic conditions and phytoplankton production in Ise and Mikawa Bays. Bull. Coast. Oceanogr., 14, 10-18 (1988) (in Japanese). 14) E. C. Pielou: Mathematical Ecology, John Wiley & Sons, New York, 1977,p. 384. 15) S. Kimoto: Some quantitative analysis on the Chrysomelid fauna of the Ryukyu Archipelago. Esakia, Kyusyu Univ., 6, 27-54 (1967). 16) Y. Tanaka, T. Tarumi, and K. Wakimoto: Handbook for Statisti cal Analysis by Personal Computers, II. Multivariate Analysis, Kyoritsu, Tokyo, 1984, p. 403 (in Japanese). 17) T. Fujita: Community ecology of offshore demersal fish assem blages. Benthos Res. (Bull. Japan Ass. Benthol.), 44, 1-17 (1993) (in Japanese). 18) I. Motomura: A stastical treatment of associations. Japan. J. Zool., 44, 379-383 (1931) (in Japanese). 19) R. H. MacArthur: On the relative abundance of species. Amer. Nat., 94, 25-36 (1960). 20) F. W. Preston: The commonness and rarity of species.Ecology,29, 254-283 (1948). 21) R. M. Warwick: A new method for detecting pollution effectson marine macrobenthic communities. Mar. Biol., 92, 557-562 (1986). 22) R. M. Warwick, T. H. Pearson, and Ruswahyuni: Detectionof pol lution effects on marine macrobenthos: further evaluation of the species abundance/biomass method. Mar. Biol., 95, 193-200 (1987). 23) J. L. Simons and D. M. Dauer: Reestablishment of a benthiccom munity following natural defaunation, in "Ecology of MarineBen thos" (ed. by B. C. Coul), Belle W. Baruch Library in Marine Science, Columbia, 1977, pp. 139-154. 24) M. Morishita: Animal population ecology, in "Animal Ecology" (ed. by D. Miyadi, S. Mori, and M. Morishita), Asakura Shoten, Tokyo, 1961, pp. 193-292 (in Japanese). 25) J. J. Beukema: An evaluation of the ABC-method (abundance/bio mass comparison) as applied to macro-zoobenthic communitiesliv ing on tidal flats in the Dutch Wadden Sea. Mar. Biol., 99,425-433 (1988). 26) D. C. Rhoads: Organism-sediment relations on the muddy sea floor. Oceanogr. Mar. Biol. Ann. Rev., 12, 263-300 (1974). 27) J. Y. Yingst and D. C. Rhoads: The structure of soft-bottom ben thic communities in the vicinity of the Texas Flower Garden Banks, Gulf of Mexico. Estu. Coast. Shelf Sci., 20, 569-592 (1985). 28) S. Nakao, S. Goshima, H. Nomura, H. Yamaguchi, and S. Yoshitake: Relationships between macrobenthos communitiesand sediment types in Mutsu Bay. Bull. Fac. Fish. Hokkaido Univ.,40, 159-168 (1989) (in Japanese). 29) R. M. May: Patterns of species abundance and diversity, in "Ecolo gy and Evolution of Communities" (ed. by M. L. Cody and J. M. Diamond), Harvard Univ. Press, Cambridge, Massachusetts, 1975, pp. 81-120. 30) R. Kitamori, T. Sugino, and T. Sawada: Bottom quality and ben thic animals in Ise Bay, in "Report on the Survey for Developing Fisheries in the Recessof Ise Bay" (ed. by Ise Wan Fish. Exp.Stn.,), 1970, vol. 1, pp. 5-40 (in Japanese). View publication statsView publication stats