(TARA) Talegaon Dabhade Call Girls Just Call 7001035870 [ Cash on Delivery ] ...
Sheet no 1
1. Shafqat Shahzoor, Lecture, BSRS, MUET Jamshoro.
APPLIED CALCULUS
Problem Sheet Number: 01: Introduction to Functions
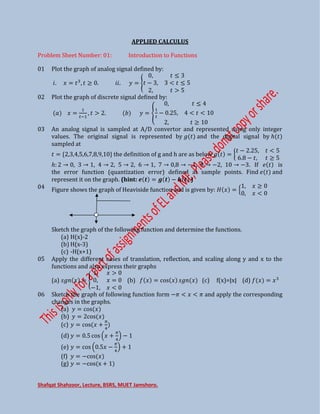
01 Plot the graph of analog signal defined by:
�. = , . ��. = {
,
− , <
, >
02 Plot the graph of discrete signal defined by:
=
�−
, > . = {
,
�
− . , < <
,
03 An analog signal is sampled at A/D convertor and represented using only integer
values. The original signal is represented by and the digital signal by ℎ
sampled at
= { , , , , , , , , } the definition of g and h are as below = {
− . , <
. − ,
ℎ: → , → , → , → , → , → , → − , → − , → − . If is
the error function (quantization error) defined at sample points. Find and
represent it on the graph. (hint: � � = � − � .)
04 Figure shows the graph of Heaviside function and is given by: = {
,
, <
Sketch the graph of the following function and determine the functions.
(a) H(x)-2
(b) H(x-3)
(c) -H(x+1)
05 Apply the different cases of translation, reflection, and scaling along y and x to the
functions and also express their graphs
(a) � = {
, >
, =
− , <
(b) = cos � (c) f(x)=|x| (d) =
06 Sketch the graph of following function form −� < < � and apply the corresponding
changes in the graphs.
(a) = cos
(b) = cos
(c) = cos +
�
(d) = . cos +
�
−
(e) = cos . −
�
+
(f) = −cos
(g) = −cos x +
2. Shafqat Shahzoor, Lecture, BSRS, MUET Jamshoro.
07 Consider a thermostat in a control system for a room that is regulating the
temperature around a desired level. Below that temperature, it may turn the heat on.
Above that temperature, it may turn the heat off and let the room cool down naturally.
You can model the binary control signal to the heater with: H=0.5+0.5sgn(T−t),
where T and t are the desired and measured temperatures, respectively. Assume T is
set at 500Celcius.
Determine the temperature at of heater at temperatures:
(a) H(0), (b) H(10), (c) H(25), (d) H(50) and H(60)?
08 An electronically controlled thermostat is
programmed to lower the temperature
during the night, automatically as shown
in figure. The temperature in degrees 20
Celsius is given in terms of the time in hours
on a 24-hour clock. 12
(i) Approximate T(4) and T(15).
(ii) The thermostat is reprogrammed to
produce a temperature. H(t)=T(t-1). Explain. 0 4 8 12 16 20 24
(iii) The thermostat is reprogrammed to
produce a temperature H(t)=T(t)-1.
How does this change the temperature? Explain.
09 A dynamic system that is at rest is subjected to a unit step input U(t). Its response is
given by: = −�
cos + �� . Determine the response at t=0, 30, 60, 90.
10 Assume that the electric current, i, flowing in a certain electric circuit decays
exponentially with time, t, as shown. Two points on the curve are given. Find an
exponential equation of the time constant form: i = i0 · e − t / 0.24 to describe the current.
Find the current I at t=1, 5, 10 if i0=10units.
11 Assume that the relationship between the sound intensity and time is = ��
. with
intial intensity = . � � = − . Compute for t = 0.1 and t = 0.5.
12 The relationship between the resistance and temperature can be approximated by
� = � + � . Where � is the resistance at initial temperature 0 degree celcius.
and � is the temperature coefficient of any material i.e platinum 0.0038/°C. If � = .
Find the resistance when T=0, T=10 and T=50?
13 The horsepower required to overcome wind drag on a certain automobile is
approximated by = . + . − . , . where x is the
speed of the car in miles per hour. (a) Use a graphing utility to graph H.
(b) Rewrite the power function so that represents the speed in kilometers per hour.
Find H(x/1.6).
14 The relationship between the Celsius scale of temperature and the thermodynamic or
absolute scale is given by: kelvin = degrees Celsius + 273=K = °C + 273.
(i) Determine the type of relationship is linear or nonlinear?
(ii) Determine the values of K for C=10, 15, 25 50 and 100.
Continued on next page…
15 Calculate the quantity of heat required to raise the temperature of 5 kg of water
3. Shafqat Shahzoor, Lecture, BSRS, MUET Jamshoro.
(assume that each liter of water is 1 kg) from 0°C to (a) 10°C (b) 50°C and 100°C.
Assume the specific heat capacity of water is 4200 J/(kg °C). Whereas the quantity of
heat energy is given by: � � = �� � − �� .
16 Following table obtained during a lab Practical with:
(a) Crank radius at 25mm and connecting the rod of length 200 mm.
(b) Crank radius at 25mm and connecting the rod of length 250mm.
Crank angle in degree (x) 0 30 60 90 120 150 180
Displacement of piston
with r=25 and L=200mm.
(y)
0 3 11.3 23.5 36.5 47 50.5
Displacement of piston
with r=25 and L=200mm.
(y)
0 5.3 20.7 45 71.9 92.8 100
Draw the graphs and Compare. Also interpret the graph.
17 In an experiment to determine the modulus of elasticity of a sample of copper, a wire
is loaded and the corresponding extension noted. The results are:
Load (N) 0 20 34 72 92 120
Extension (mm) 0 0.7 1.2 2.5 3.3 4.2
(a) Draw the load/extension graph.
(b) Determine the modulus of elasticity of the sample if the mean diameter of the
wire is 1.23 mm and its length is 4.0 m.
(c) Interpret the type of relationship graph represent (Linear or Nonlinear).
18 The speed n rev/min of a motor changes when the voltage V across the armature is
varied. The results are shown in the following table:
N(rev/min) 560 720 900 1010 1240 1410
V(volts) 80 100 120 140 160 180
It is suspected that one of the readings taken of the speed is inaccurate. Plot a graph of
speed (horizontally) against voltage (vertically) and find this value. Find also (a) the
speed at a voltage of 132 V, and (b) the voltage at a speed of 1300 rev/min.
[1010 rev/min should be 1070 rev/min.
19 A piece of elastic is tied to a support so that it hangs vertically, and a pan, on which
weights can be placed, is attached to the free end. The length of the elastic is
measured as various weights are added to the pan and the results obtained are as
follows:
Load W(N) 5 10 15 20 25
Length cm (l) 60 72 84 96 108
Plot a graph of load (horizontally) against length (vertically) and determine:
(a) the value of length when the load is 17 N,
(b) the value of load when the length is 74 cm,
(c) its gradient, and (d) the equation of the graph. (Hint: Use two points formula.)
20 Worksheet 02. Questions: 4, 7, 8, 15, 17 and 18. Applied Calculus, Prof. M. Urs Shaikh.