Downloaded 30 times

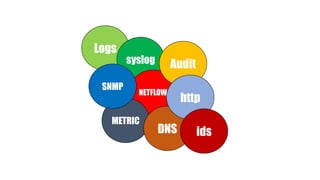

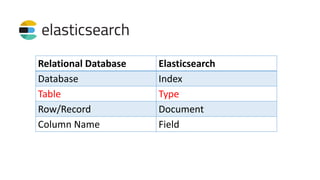
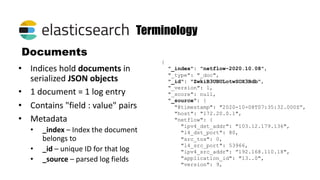
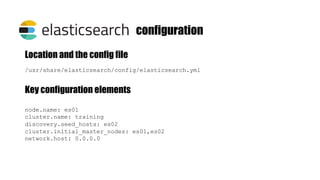
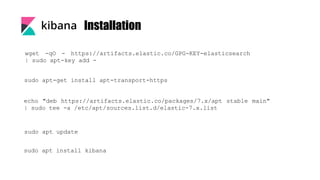
![[root@4f8cd6658b1b elasticsearch]# curl http://localhost:9200
{
"name" : "es01",
"cluster_name" : ”training",
"cluster_uuid" : "vE9SZr8oRFK0A0HTq9U_oA",
"version" : {
"number" : "7.7.0",
"build_flavor" : "default",
"build_type" : "docker",
"build_hash" : "81a1e9eda8e6183f5237786246f6dced26a10eaf",
"build_date" : "2020-05-12T02:01:37.602180Z",
"build_snapshot" : false,
"lucene_version" : "8.5.1",
"minimum_wire_compatibility_version" : "6.8.0",
"minimum_index_compatibility_version" : "6.0.0-beta1"
},
"tagline" : "You Know, for Search"
}
[root@4f8cd6658b1b elasticsearch]#](https://image.slidesharecdn.com/bdnog12loganalysistutorial-201014021809/85/Log-analysis-with-elastic-stack-16-320.jpg)


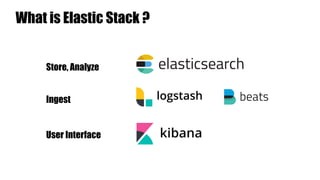
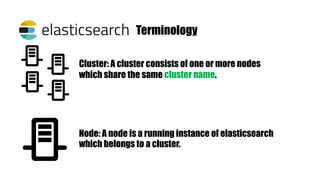
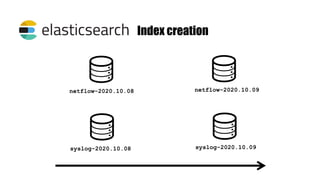
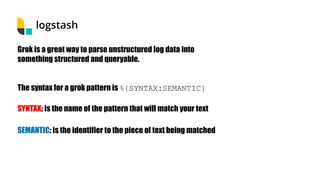
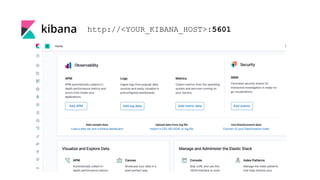
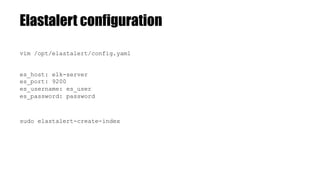
![Logstatsh has three stages
INPUT
FILTER
OUTPUT
input {
tcp {
port => 5002
type => "syslog"
}
}
filter {
if [type] == "syslog" {
grok {
}
}
}
output {
if [type] == "syslog" {
elasticsearch {
hosts => "http://es01:9200"
index => "syslog-%{+YYYY.MM.dd}"
}
}
}
beats, file, syslog,
udp, snmp,
etc…
http, kv,
xml, json,
etc…
csv, file,
http, stdout,
etc….
.conf](https://image.slidesharecdn.com/bdnog12loganalysistutorial-201014021809/85/Log-analysis-with-elastic-stack-19-320.jpg)
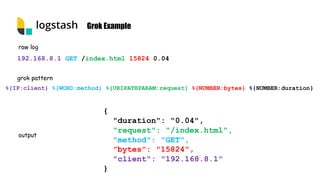


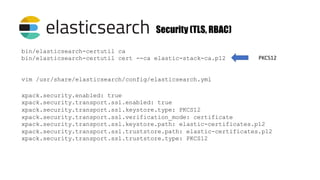


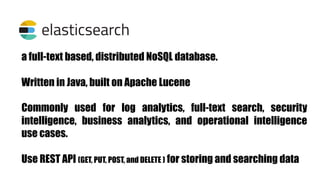
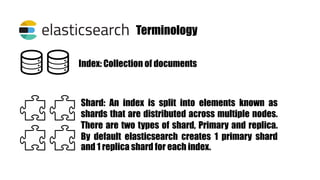
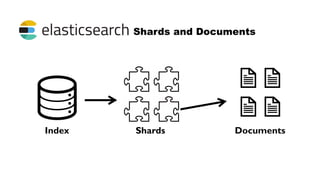
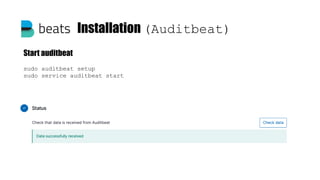
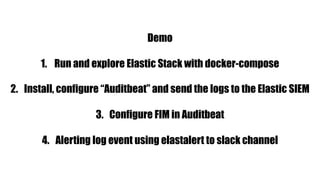
![Installation (Auditbeat)
curl -L -O https://artifacts.elastic.co/downloads/beats/auditbeat/auditbeat-
7.7.0-amd64.deb
sudo dpkg -i auditbeat-7.7.0-amd64.deb
output.elasticsearch:
hosts: ["es_host:9200"]
username: "elastic"
password: "<password>"
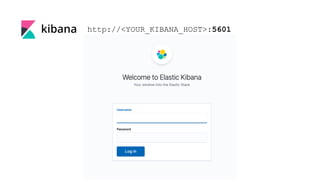
setup.kibana:
host: ”http://kibana_host:5601"
Download and install
Edit configuration (/etc/auditbeat/auditbeat.yml)](https://image.slidesharecdn.com/bdnog12loganalysistutorial-201014021809/85/Log-analysis-with-elastic-stack-40-320.jpg)

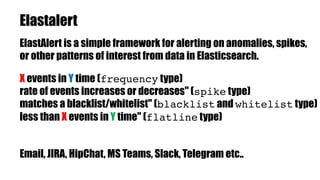


This document provides an overview of the Elastic Stack including Elasticsearch, Logstash, Kibana, and Beats. It describes how each component works, key terminology, installation and configuration steps. It also demonstrates how to integrate the Elastic Stack for log analytics and security information and event management (SIEM) use cases including sending logs from Auditbeat, configuring file integrity monitoring, and alerting on log events using Elastalert.


![Automating ISP Networks Using Ansible and IPAM as a Source of Truth [SoT]](https://cdn.slidesharecdn.com/ss_thumbnails/automatingispnetworksusingansibleandipamasasourceoftruthsot-v25-1-251124105117-d7d4ca24-thumbnail.jpg?width=640&height=640&fit=bounds)


