A new way of optimising turf growth based on degree days and actual nutrient requiremen tactual
•
0 likes•23 views

The document discusses optimizing turf growth based on degree days and nutrient requirements. It presents a novel approach to calculating growth potential for cool and warm season grasses throughout the year based on temperature data. This allows for better timing of overseeding and targeting of fertilization applications to match actual grass needs. The approach aims to improve turf success and reduce transitional periods between grass types through more effective nutrient management tailored to local climate conditions.

Recommended
Recommended
More Related Content
More from Gilba Solutions Pty Ltd
More from Gilba Solutions Pty Ltd (20)
Recently uploaded
Recently uploaded (20)
A new way of optimising turf growth based on degree days and actual nutrient requiremen tactual
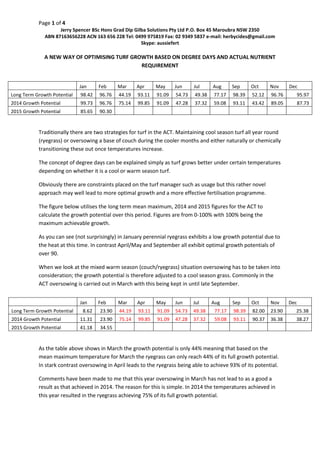
- 1. Page 1 of 4 Jerry Spencer BSc Hons Grad Dip Gilba Solutions Pty Ltd P.O. Box 45 Maroubra NSW 2350 ABN 87163656228 ACN 163 656 228 Tel: 0499 975819 Fax: 02 9349 5837 e-mail: herbycides@gmail.com Skype: aussiefert A NEW WAY OF OPTIMISING TURF GROWTH BASED ON DEGREE DAYS AND ACTUAL NUTRIENT REQUIREMENT Traditionally there are two strategies for turf in the ACT. Maintaining cool season turf all year round (ryegrass) or oversowing a base of couch during the cooler months and either naturally or chemically transitioning these out once temperatures increase. The concept of degree days can be explained simply as turf grows better under certain temperatures depending on whether it is a cool or warm season turf. Obviously there are constraints placed on the turf manager such as usage but this rather novel approach may well lead to more optimal growth and a more effective fertilisation programme. The figure below utilises the long term mean maximum, 2014 and 2015 figures for the ACT to calculate the growth potential over this period. Figures are from 0-100% with 100% being the maximum achievable growth. As you can see (not surprisingly) in January perennial ryegrass exhibits a low growth potential due to the heat at this time. In contrast April/May and September all exhibit optimal growth potentials of over 90. When we look at the mixed warm season (couch/ryegrass) situation oversowing has to be taken into consideration; the growth potential is therefore adjusted to a cool season grass. Commonly in the ACT oversowing is carried out in March with this being kept in until late September. As the table above shows in March the growth potential is only 44% meaning that based on the mean maximum temperature for March the ryegrass can only reach 44% of its full growth potential. In stark contrast oversowing in April leads to the ryegrass being able to achieve 93% of its potential. Comments have been made to me that this year oversowing in March has not lead to as a good a result as that achieved in 2014. The reason for this is simple. In 2014 the temperatures achieved in this year resulted in the ryegrass achieving 75% of its full growth potential. Jan Feb Mar Apr May Jun Jul Aug Sep Oct Nov Dec Long Term Growth Potential 98.42 96.76 44.19 93.11 91.09 54.73 49.38 77.17 98.39 52.12 96.76 95.97 2014 Growth Potential 99.73 96.76 75.14 99.85 91.09 47.28 37.32 59.08 93.11 43.42 89.05 87.73 2015 Growth Potential 85.65 90.30 Jan Feb Mar Apr May Jun Jul Aug Sep Oct Nov Dec Long Term Growth Potential 8.62 23.90 44.19 93.11 91.09 54.73 49.38 77.17 98.39 82.00 23.90 25.38 2014 Growth Potential 11.31 23.90 75.14 99.85 91.09 47.28 37.32 59.08 93.11 90.37 36.38 38.27 2015 Growth Potential 41.18 34.55
- 2. Page 2 of 4 Jerry Spencer BSc Hons Grad Dip Gilba Solutions Pty Ltd P.O. Box 45 Maroubra NSW 2350 ABN 87163656228 ACN 163 656 228 Tel: 0499 975819 Fax: 02 9349 5837 e-mail: herbycides@gmail.com Skype: aussiefert Fertilisation This use of localised temperatures means that the same principle can be applied to fertilisation. The reason for this is that the plant requires more fertiliser, working on nitrogen in this scenario (although the principles apply to all nutrients), the higher its growth potential! The table below shows how this looks for a perennial ryegrass fieldal ryegrass - N inputs by month g/m2 actual vs theoretical aiming to apply a max of 3.5g/m2. 0.00 20.00 40.00 60.00 80.00 100.00 120.00 Jan Feb Mar Apr May Jun Jul Aug Sep Oct Nov Dec Perennial ryegrass - Long term growth potential vs 2014 and 2015 Long Term Growth Potential 2014 Growth Potential 2015 Growth Potential 0.00 20.00 40.00 60.00 80.00 100.00 120.00 Jan Feb Mar Apr May Jun Jul Aug Sep Oct Nov Dec Couch oversown with ryegrass - Long term growth potential vs 2014 and 2015 Long Term Growth Potential 2014 Growth Potential 2015 Growth Potential
- 3. Page 3 of 4 Jerry Spencer BSc Hons Grad Dip Gilba Solutions Pty Ltd P.O. Box 45 Maroubra NSW 2350 ABN 87163656228 ACN 163 656 228 Tel: 0499 975819 Fax: 02 9349 5837 e-mail: herbycides@gmail.com Skype: aussiefert 0.00 0.50 1.00 1.50 2.00 2.50 3.00 3.50 4.00 Jan Feb Mar Apr May Jun Jul Aug Sep Oct Nov Dec Perennial ryegrass - N inputs by month g/m2 actual vs theoretical Theoretical N based on 2014 weather Theoretical N based on 2015 weather Theoretical N g/sq m based on long term mean Jan Feb Mar Apr May Jun Jul Aug Sep Oct Nov Dec Growth Potential 8.62 23.90 44.19 93.11 91.09 54.73 49.38 77.17 98.39 82.00 23.90 25.38 Theoretical N based on 2014 weather g/m2 0.38 0.81 2.55 3.40 3.10 1.61 1.27 2.01 3.17 3.07 1.24 1.30 Theoretical N based on 2015 weather g/m2 1.40 1.17 Theoretical N g/sq m based on long term mean 0.30 0.84 1.55 3.26 3.19 1.92 1.73 2.70 3.44 2.87 0.84 0.89
- 4. Page 4 of 4 Jerry Spencer BSc Hons Grad Dip Gilba Solutions Pty Ltd P.O. Box 45 Maroubra NSW 2350 ABN 87163656228 ACN 163 656 228 Tel: 0499 975819 Fax: 02 9349 5837 e-mail: herbycides@gmail.com Skype: aussiefert The same approach applied to an oversown couch field shows the following (figures in red are when ryegrass present) Jan Feb Mar Apr May Jun Jul Aug Sep Oct Nov Dec Growth potential 98.42 96.76 63.44 87.26 100.00 91.09 86.43 95.43 99.42 52.12 96.76 95.97 Actual N based on 2014 weather g/sq m 3.49 3.39 2.55 3.40 3.10 1.61 1.27 2.01 3.17 1.52 3.12 3.07 Actual N based on 2015 weather g/sq m 3.00 3.16 Theoretical N g/sq m based on long term mean 3.44 3.39 1.55 3.26 3.19 1.92 1.73 2.70 3.44 1.82 3.39 3.36 By using this modelling approach it allows you 1. Better Time your oversowing programme to get better results 2. Better target your fertilisation programme 3. Avoids fertilising from habit. 4. Takes into account grass type present. 5. Can help explain variable results year to year 6. Enables you to reduce your transitional window and get better success with ryegrass transition. 7. This principle can be applied to all climatic zones within Australia. Please feel free to contact us for specific data to your zone. 0.00 0.50 1.00 1.50 2.00 2.50 3.00 3.50 4.00 Jan Feb Mar Apr May Jun Jul Aug Sep Oct Nov Dec Oversown coouch - N inputs by month g/m2 actual vs theoretical Theoretical N based on 2014 weather Theoretical N based on 2015 weather Theoretical N g/sq m based on long term mean