VIP Call Girls Service Dilsukhnagar Hyderabad Call +91-8250192130
Three problems of probability
1. Problems
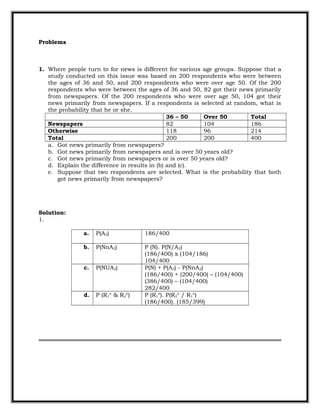
1. Where people turn to for news is different for various age groups. Suppose that a
study conducted on this issue was based on 200 respondents who were between
the ages of 36 and 50, and 200 respondents who were over age 50. Of the 200
respondents who were between the ages of 36 and 50, 82 got their news primarily
from newspapers. Of the 200 respondents who were over age 50, 104 got their
news primarily from newspapers. If a respondents is selected at random, what is
the probability that he or she.
36 – 50
Over 50
Total
Newspapers
82
104
186
Otherwise
118
96
214
Total
200
200
400
a. Got news primarily from newspapers?
b. Got news primarily from newspapers and is over 50 years old?
c. Got news primarily from newspapers or is over 50 years old?
d. Explain the difference in results in (b) and (c).
e. Suppose that two respondents are selected. What is the probability that both
got news primarily from newspapers?
Solution:
1.
a.
P(A2)
186/400
b.
P(NnA2)
c.
P(NUA2)
d.
P (R1n & R2n)
P (N). P(N/A2)
(186/400) x (104/186)
104/400
P(N) + P(A2) - P(NnA2)
(186/400) + (200/400) – (104/400)
(386/400) – (104/400)
282/400
P (R1n). P(R2n / R1n)
(186/400). (185/399)
2. 2. A survey of 500 men and 500 women designed to study financial tensions between
couples asked how likely each was to hide purchases of clothing from his or her
partner. The results were as follows:
Likely to Hide Purchase of Clothing
Yes
No
Total
Men
62
438
500
Women
116
384
500
If a respondent is chosen at random, what is the probability that
a. He or she is likely to hide clothing purchases?
b. The person is a female and is likely to hide clothing purchases?
c. The person is a female or is likely to hide clothing purchases?
Solution: 2.
a. P(H)
178/1000
b. P(FnH)
P(F) . P(F/H)
(178/1000) x (116/1000)
116/1000
P(F) + P(H) - P(FnH)
(178/1000) + (500/1000) – (116/1000)
(678/1000) – (116/1000)
562/1000
c. P(FUH)
Total
178
822
1,000
3. 3. In 37 of the 58 years from 1950 through 2007, the S&P 500 finished higher after
the first five days of trading. In 32 of those 37 years, the S&P 500 finished higher
for the year. Is a good first week a good omen for the upcoming year? The following
table gives the first-week and annual performance over this 58-year period:
First five days
Higher
Lower
Total
Higher
32
11
43
Year
Lower
5
10
15
Total
37
21
58
If a year is selected at random, what is the probability that
a. The S&P 500 finished higher for the year?
b. The S&P 500 finished higher after the first five days of trading?
c. The S&P 500 finished higher after the first five days of trading and the S&P
500 finished higher for the year?
d. The S&P 500 finished higher after the first five days of trading or the S&P 500
finished higher for the year?
e. Given that the S&P 500 finished higher after the first five days of trading, what
is the probability that it finished higher for the year?
Solution: 3.
a. P(HY)
43/58
b. P(HW)
37/58
c. P(HWnHY)
P(HW) . P(HY/HW)
(37/58) x (32/37)
32/58
P(HW) + P(HY) - P(HWnHY)
(37/58) + (43/58) – (32/58)
(80/58) – (32/58)
48/58
32/37
d. P(HWUHY)
e. P(HY/HW)
4. Problems
1. Given the following probability distributions:
Distribution A
X
P(X)
0
0.20
1
0.20
2
0.20
3
0.20
4
0.20
Distribution B
X
0
1
2
3
4
P(X)
0.10
0.20
0.40
0.20
0.10
a. Compute the expected value of each distribution.
b. Compute the standard deviation of each distribution.
c. Compute the results of distributions A and B.
Solution: 1.
A.
Distribution – A
(Xi - µ)
(Xi - µ)2 x P(Xi)
2
(0-2)
(4) x (0.20)
(1-2)2
(1) x (0.20)
2
(2-2)
(0) x (0.20)
(3-2)2
(1) x (0.20)
2
(4-2)
(4) x (0.20)
2
Xi
0
1
2
3
4
A
0.8
0.2
0
0.2
0.8
2/=
Distribution – B
(Xi - µ)2 (Xi - µ)2 - P(Xi)
(0-2)2
(4) x (0.10)
(1-2)2
(1) x (0.20)
2
(2-2)
(0) x (0.40)
(3-2)2
(1) x (0.20)
2
(4-2)
(4) x (0.10)
Xi
0
1
2
3
4
B.
Distribution – A
Standard deviation = = √2
Standard deviation = = 1.4142
Distribution – B
Standard deviation = = √1.2
Standard deviation = = 1.0954
C.
Distribution – A
Distribution – B
0.40
0.20
0.20
0.20
0.20
0.20
-----------------------------------------------------
0.20
0.10
0.20
0.10
B
0.4
0.2
0
0.2
0.4
1.2/=
5. _______________________________________
0
1
2
3
_____________________________________
4
0
1
2
3
4
2. In the carnival game under-or-over-seven, a pair of fair dice is rolled once, and the
resulting sum determines whether the player wins or loses his or her bet. For
example, the player can bet $1 that the sum will be under 7 – that is, 2, 3, 4, 5, or
6. For this bet, the player wins $1 if the result is under 7 and loses $1 if the
outcome equals or is greater than 7. Similarly, the player can bet $1 that the sum
will be over 7 – that is, 8, 9, 10, 11, or 12. Here, the player wins $1 if the result is
over 7 but loses $1 if the result is 7 or under. A third method of play is to bet $1
on the outcome 7. For this bet, the player wins $4 if the result of the roll is 7 and
loses $1 otherwise.
a. Construct the probability distribution representing the different outcomes that
are possible for a $1 bet being under 7.
b. Construct the probability distribution representing the different outcomes that
are possible for a $1 bet on being over7.
c. Construct the probability distribution representing the different outcomes that
are possible for a $1 bet on 7.
d. Show that the expected long-run profit (or loss) to the player is the same, no
matter which method of play is used.
D2D1
1
2
3
4
5
6
1
2
3
4
5
6
7
2
3
4
5
6
7
8
3
4
5
6
7
8
9
4
5
6
7
8
9
10
A.
Xi
2
3
4
5
6
7
8
9
10
11
12
Player bets on under 7.
W
=
+ $1
L
=
- $1
P = f/∑f
1/36
2/36
3/36
4/36
5/36
6/36
5/36
4/36
3/36
2/36
1/36
5
6
7
8
9
10
11
6
7
8
9
10
11
12
6. B.
Player bets on under 7.
1.
2.
W
L
=
=
1.
6/36 = 1/6 = 0.1667
2.
1.
1 - 0.1667 = 0.8334
15/36 – (1)(21/36) = 15-21/36 = 6/36
1.
4.
+ $4
- $1
15/36 – (1)(21/36) = -1/6
(4)(6/36) – (1)(30/36) = (24 – 30)/36
= -6/36
= -1/6
3. The number of arrivals per minute at a bank located in the central business
district of large city was recorded over a period of 200 minutes with the following
results;
Arrival
0
1
2
3
4
5
6
7
8
Frequency
14
31
47
41
29
21
10
5
2
a. Compute the expected number of arrivals per day.
b. Compute the standard deviation.
Solution:
Xi
fi
P(Xi) = Fi/∑fi
(Xi x PXi)
(Xi-µ)2 P(Xi)
0
14
0.07
0
(0-2.9)2x(0.07)
0.5887
1
31
0.115
0.115
(1-2.9)2x(0.115)
0.5595
2
47
0.235
0.47
(2-2.9)2x(0.47)
0.1903
3
41
0.205
0.615
(3-2.9)2x(0.615)
0.0020
4
29
0.145
0.58
(4-2.9)2x(0.58)
0.1754
5
21
0.105
0.525
(5-2.9)2x(0.525)
0.4630
6
10
0.05
0.30
(6-2.9)2x(0.30)
0.4805
7
5
0.025
0.175
(7-2.9)2x(0.175)
0.4202
8
2
0.01
0.08
(8-2.9)2x(0.08)
0.2601
200
Standard deviation = = √3.14 = 1.772
2.9
3.14
7. 4. Suppose that a judge’s decisions are upheld by an appeals court 90% of the time.
In her next ten decisions, what is the probability that the time. In her next ten
decisions, what is the probability that
a. Eight of her decisions are upheld by an appeals court?
b. All ten of her decisions are upheld by an appeals court?
c. Eight or more of her decisions are upheld by an appeals court?