SlideShare a Scribd company logo
1 of 27
Download to read offline
What do you mean by correlation?
Correlation is a statistical measure that indicates the extent to which two or more variables
fluctuate together. A positive correlation indicates the extent to which those variables increase
or decrease in parallel; a negative correlation indicates the extent to which one variable
increases as the other decreases.
28-08-2020 LPU 1
What is a correlation example?
Positive correlation exists when two variables move in the same direction. A basic example of
positive correlation is height and weight—taller people tend to be heavier, and vice versa. ...
In other cases, the two variables are independent from one another and are influenced by a
third variable.
28-08-2020 LPU 2
What is strong correlation?
When the r value is closer to +1 or -1, it indicates that there is a stronger linear relationship
between the two variables. A correlation of -0.97 is a strong negative correlation while a
correlation of 0.10 would be a weak positive correlation.
28-08-2020 LPU 3
Is 0.4 is a strong correlation?
This is a strong positive relationship; the correlation coefficient is 0.9408. ... For this kind of
data, we generally consider correlations above 0.4 to be relatively strong; correlations between
0.2 and 0.4 are moderate, and those below 0.2 are considered weak.
28-08-2020 LPU 4
How do you interpret correlation?
Interpret SPSS output for correlations: Pearson's r - YouTube
https://www.youtube.com/watch?v=pgQ9T_SdzoQ
28-08-2020 LPU 5
APPLICATIONS
Correlation is used to describe the linear relationship between two continuous
variables (e.g., height and weight). In general, correlation tends to be used when there
is no identified response variable. It measures the strength (qualitatively) and direction
of the linear relationship between two or more variables.
28-08-2020 LPU 6
Pearson's Correlation Coefficient was designed just for
linear relationships. Technically, if we get a low value,
or a zero value, it does not mean that there is no
relationship. It just means that there is no linear
relationship
28-08-2020 LPU 7
QUIZ
1. If the Pearson Product Moment Correlation Coefficient shows
zero value, this definitely means that there is no
relationship between the two variables
a) True
B) False
28-08-2020 LPU 8
What is degree of correlation?
The degree of intensity of relationship between two variables is measured with
the coefficient of correlation. They are as follows: Perfect correlation: If two
variables change in the same proportion (increase or decrease), then the
correlation between them is perfect correlation.
28-08-2020 LPU 9
28-08-2020 LPU 10
28-08-2020 LPU 11
28-08-2020 LPU 12
28-08-2020 LPU 13
28-08-2020 LPU 14
28-08-2020 LPU 15
28-08-2020 LPU 16
28-08-2020 LPU 17
Links
1. https://www.youtube.com/watch?v=Ypgo4qUBt5oA
28-08-2020 LPU 18
Problem 1: Based on simple method of
finding out Correlation Coefficient
( with average)
Calculate karl Pearson’s coefficient of correlation from
the following data and interprets it value
Marks in Pharmacognosy: 48 35 17 23 47
Marks in Statistics : 45 20 40 25 45
28-08-2020 LPU 19
Problem 2: Based on Direct method of
finding out Correlation Coefficient
Calculate coefficient of correlation from the data given
below by the direct method, i.e ., without taking the
deviations of items from actual or assumed mean.
X 9 8 7 6 5 4 3 2 1
Y 15 16 14 13 11 12 10 8 9
28-08-2020 LPU 20
Problem 3: Based on indirect method of finding out
Correlation Coefficient( Assumed mean)
Calculate the coefficient of correlation between X and Y
From the following data.
X 78 89 99 60 59 79 68 61
Y 125 137 156 112 107 136 123 108
28-08-2020 LPU 21
Problem1. based on regression analysis ( By direct method)
From the following data, obtain two regression equations
X 6 2 10 4 8
Y 9 11 5 8 7
28-08-2020 LPU 22
Problem2. Based on regression analysis ( by actual mean method)
The following data relate to the scores obtained by 9 salesmen of a company
in an intelligence test and their weekly sales in thousands rupees:
a. Obtain the regression equation of sales on intelligence test scores of
salesmen.
b. If the intelligence score of a salesmen is 65, what would be his
expected weekly sales
Sal. Int A B C D E F G H I
Test [X]
Scores
50 60 50 60 80 50 80 40 70
Weekly
Sales [Y]
30 60 40 50 60 30 70 50 60
28-08-2020 LPU 23
Problem3. Based on regression analysis ( by assumed mean method)
The following table shows ages [X] and blood pressure [Y] of 8
persons:
Obtain the regression equation of Y on X and find the expected
blood pressure of a person who is 49 years old
Ages [X] 52 63 45 36 72 65 47 25
BP [Y] 62 53 51 25 79 43 60 33
28-08-2020 LPU 24
28-08-2020 LPU 25
TERMINOLOGY IN STATISTICS
1.Predictor variable or Explanatory variable or Regressor
variable is also known as independent variable used in
regression analyses.
2. Response variable is also known as dependent variable. Other
names are
a. Regressand variable
b. Predictand variable
c. Explained variable
28-08-2020 LPU 26
QUIZ
1. In regression analysis, the variable that is being
predicted is the
A. Response, or dependent, variable
b. Independent variable
c. Intervening variable
d. Is usually x
28-08-2020 LPU 27
2. The correlation coefficient is used to determine:
a. A specific value of the y-variable given a specific value
of the x-variable
b. A specific value of the x-variable given a specific value
of the y-variable
C. The strength of the relationship between the x and y
variables
d. None of these

More Related Content

What's hot

01 psychological statistics 1
01 psychological statistics 101 psychological statistics 1
01 psychological statistics 1Noushad Feroke
 
Economic statistics ii -unit 2 & 5-(theory)
Economic statistics ii -unit 2 & 5-(theory)Economic statistics ii -unit 2 & 5-(theory)
Economic statistics ii -unit 2 & 5-(theory)ASatheeshBabu
 
One Way ANOVA and Two Way ANOVA using R
One Way ANOVA and Two Way ANOVA using ROne Way ANOVA and Two Way ANOVA using R
One Way ANOVA and Two Way ANOVA using RSean Stovall
 
2.4 Scatterplots, correlation, and regression
2.4 Scatterplots, correlation, and regression2.4 Scatterplots, correlation, and regression
2.4 Scatterplots, correlation, and regressionLong Beach City College
 
DOE Project ANOVA Analysis Diet Type
DOE Project ANOVA Analysis Diet TypeDOE Project ANOVA Analysis Diet Type
DOE Project ANOVA Analysis Diet Typevidit jain
 
Assumptions of Linear Regression - Machine Learning
Assumptions of Linear Regression - Machine LearningAssumptions of Linear Regression - Machine Learning
Assumptions of Linear Regression - Machine LearningKush Kulshrestha
 
Correlation and Path analysis in breeding experiments
Correlation and Path analysis in breeding experimentsCorrelation and Path analysis in breeding experiments
Correlation and Path analysis in breeding experimentsankit dhillon
 
Imad Feneir - Two-way ANOVA - replication
Imad Feneir - Two-way ANOVA - replicationImad Feneir - Two-way ANOVA - replication
Imad Feneir - Two-way ANOVA - replicationImad Feneir
 
Analysis of variance (ANOVA)
Analysis of variance (ANOVA)Analysis of variance (ANOVA)
Analysis of variance (ANOVA)Sneh Kumari
 
Chapter 2 part1-Scatterplots
Chapter 2 part1-ScatterplotsChapter 2 part1-Scatterplots
Chapter 2 part1-Scatterplotsnszakir
 
Hypothesis testing for parametric data (1)
Hypothesis testing for parametric data (1)Hypothesis testing for parametric data (1)
Hypothesis testing for parametric data (1)KwambokaLeonidah
 
Student's T test distributions & its Applications
Student's T test distributions & its Applications Student's T test distributions & its Applications
Student's T test distributions & its Applications vidit jain
 
Scatterplots, Correlation, and Regression
Scatterplots, Correlation, and RegressionScatterplots, Correlation, and Regression
Scatterplots, Correlation, and RegressionLong Beach City College
 
Categorical data analysis
Categorical data analysisCategorical data analysis
Categorical data analysisSumit Das
 
Machine Learning Algorithm - Linear Regression
Machine Learning Algorithm - Linear RegressionMachine Learning Algorithm - Linear Regression
Machine Learning Algorithm - Linear RegressionKush Kulshrestha
 
Statistics for second language educators
Statistics for second language educatorsStatistics for second language educators
Statistics for second language educatorsAchilleas Kostoulas
 

What's hot (19)

01 psychological statistics 1
01 psychological statistics 101 psychological statistics 1
01 psychological statistics 1
 
Economic statistics ii -unit 2 & 5-(theory)
Economic statistics ii -unit 2 & 5-(theory)Economic statistics ii -unit 2 & 5-(theory)
Economic statistics ii -unit 2 & 5-(theory)
 
ANOVA test and correlation
ANOVA test and correlationANOVA test and correlation
ANOVA test and correlation
 
One Way ANOVA and Two Way ANOVA using R
One Way ANOVA and Two Way ANOVA using ROne Way ANOVA and Two Way ANOVA using R
One Way ANOVA and Two Way ANOVA using R
 
2.4 Scatterplots, correlation, and regression
2.4 Scatterplots, correlation, and regression2.4 Scatterplots, correlation, and regression
2.4 Scatterplots, correlation, and regression
 
DOE Project ANOVA Analysis Diet Type
DOE Project ANOVA Analysis Diet TypeDOE Project ANOVA Analysis Diet Type
DOE Project ANOVA Analysis Diet Type
 
Assumptions of Linear Regression - Machine Learning
Assumptions of Linear Regression - Machine LearningAssumptions of Linear Regression - Machine Learning
Assumptions of Linear Regression - Machine Learning
 
The Chi Square Test
The Chi Square TestThe Chi Square Test
The Chi Square Test
 
Correlation and Path analysis in breeding experiments
Correlation and Path analysis in breeding experimentsCorrelation and Path analysis in breeding experiments
Correlation and Path analysis in breeding experiments
 
Imad Feneir - Two-way ANOVA - replication
Imad Feneir - Two-way ANOVA - replicationImad Feneir - Two-way ANOVA - replication
Imad Feneir - Two-way ANOVA - replication
 
Analysis of variance (ANOVA)
Analysis of variance (ANOVA)Analysis of variance (ANOVA)
Analysis of variance (ANOVA)
 
Chapter 2 part1-Scatterplots
Chapter 2 part1-ScatterplotsChapter 2 part1-Scatterplots
Chapter 2 part1-Scatterplots
 
Hypothesis testing for parametric data (1)
Hypothesis testing for parametric data (1)Hypothesis testing for parametric data (1)
Hypothesis testing for parametric data (1)
 
Student's T test distributions & its Applications
Student's T test distributions & its Applications Student's T test distributions & its Applications
Student's T test distributions & its Applications
 
Scatterplots, Correlation, and Regression
Scatterplots, Correlation, and RegressionScatterplots, Correlation, and Regression
Scatterplots, Correlation, and Regression
 
Chi‑square test
Chi‑square test Chi‑square test
Chi‑square test
 
Categorical data analysis
Categorical data analysisCategorical data analysis
Categorical data analysis
 
Machine Learning Algorithm - Linear Regression
Machine Learning Algorithm - Linear RegressionMachine Learning Algorithm - Linear Regression
Machine Learning Algorithm - Linear Regression
 
Statistics for second language educators
Statistics for second language educatorsStatistics for second language educators
Statistics for second language educators
 

Similar to Unit 1 bp801 t g correlation analysis24022022

4Correlational analysis presentation .pdf
4Correlational analysis presentation .pdf4Correlational analysis presentation .pdf
4Correlational analysis presentation .pdfMitikuTeka1
 
Mba i qt unit-3_correlation
Mba i qt unit-3_correlationMba i qt unit-3_correlation
Mba i qt unit-3_correlationRai University
 
Correlation AnalysisCorrelation AnalysisCorrelation meas.docx
Correlation AnalysisCorrelation AnalysisCorrelation meas.docxCorrelation AnalysisCorrelation AnalysisCorrelation meas.docx
Correlation AnalysisCorrelation AnalysisCorrelation meas.docxfaithxdunce63732
 
Correlation analysis
Correlation analysisCorrelation analysis
Correlation analysisAwais Salman
 
ch 13 Correlation and regression.doc
ch 13 Correlation  and regression.docch 13 Correlation  and regression.doc
ch 13 Correlation and regression.docAbedurRahman5
 
5 regressionand correlation
5 regressionand correlation5 regressionand correlation
5 regressionand correlationLama K Banna
 
Correlation and Regression
Correlation and RegressionCorrelation and Regression
Correlation and RegressionShubham Mehta
 
Correlation analysis notes
Correlation analysis notesCorrelation analysis notes
Correlation analysis notesJapheth Muthama
 
Data analysis test for association BY Prof Sachin Udepurkar
Data analysis   test for association BY Prof Sachin UdepurkarData analysis   test for association BY Prof Sachin Udepurkar
Data analysis test for association BY Prof Sachin Udepurkarsachinudepurkar
 
Exercise 29Calculating Simple Linear RegressionSimple linear reg.docx
Exercise 29Calculating Simple Linear RegressionSimple linear reg.docxExercise 29Calculating Simple Linear RegressionSimple linear reg.docx
Exercise 29Calculating Simple Linear RegressionSimple linear reg.docxAlleneMcclendon878
 
Correlation research
Correlation researchCorrelation research
Correlation researchAmina Tariq
 
Correlation and Regression ppt
Correlation and Regression pptCorrelation and Regression ppt
Correlation and Regression pptSantosh Bhaskar
 
MCA_UNIT-4_Computer Oriented Numerical Statistical Methods
MCA_UNIT-4_Computer Oriented Numerical Statistical MethodsMCA_UNIT-4_Computer Oriented Numerical Statistical Methods
MCA_UNIT-4_Computer Oriented Numerical Statistical MethodsRai University
 

Similar to Unit 1 bp801 t g correlation analysis24022022 (20)

4Correlational analysis presentation .pdf
4Correlational analysis presentation .pdf4Correlational analysis presentation .pdf
4Correlational analysis presentation .pdf
 
Mba i qt unit-3_correlation
Mba i qt unit-3_correlationMba i qt unit-3_correlation
Mba i qt unit-3_correlation
 
Correlation and Regression
Correlation and Regression Correlation and Regression
Correlation and Regression
 
data analysis
data analysisdata analysis
data analysis
 
Correlation AnalysisCorrelation AnalysisCorrelation meas.docx
Correlation AnalysisCorrelation AnalysisCorrelation meas.docxCorrelation AnalysisCorrelation AnalysisCorrelation meas.docx
Correlation AnalysisCorrelation AnalysisCorrelation meas.docx
 
Correlation analysis
Correlation analysisCorrelation analysis
Correlation analysis
 
ch 13 Correlation and regression.doc
ch 13 Correlation  and regression.docch 13 Correlation  and regression.doc
ch 13 Correlation and regression.doc
 
5 regressionand correlation
5 regressionand correlation5 regressionand correlation
5 regressionand correlation
 
Correlation and Regression
Correlation and RegressionCorrelation and Regression
Correlation and Regression
 
Correlation analysis notes
Correlation analysis notesCorrelation analysis notes
Correlation analysis notes
 
Data analysis test for association BY Prof Sachin Udepurkar
Data analysis   test for association BY Prof Sachin UdepurkarData analysis   test for association BY Prof Sachin Udepurkar
Data analysis test for association BY Prof Sachin Udepurkar
 
Exercise 29Calculating Simple Linear RegressionSimple linear reg.docx
Exercise 29Calculating Simple Linear RegressionSimple linear reg.docxExercise 29Calculating Simple Linear RegressionSimple linear reg.docx
Exercise 29Calculating Simple Linear RegressionSimple linear reg.docx
 
Correlation research
Correlation researchCorrelation research
Correlation research
 
Simple correlation
Simple correlationSimple correlation
Simple correlation
 
Correlational Research
Correlational ResearchCorrelational Research
Correlational Research
 
Correlation and Regression ppt
Correlation and Regression pptCorrelation and Regression ppt
Correlation and Regression ppt
 
Regression analysis
Regression analysisRegression analysis
Regression analysis
 
MCA_UNIT-4_Computer Oriented Numerical Statistical Methods
MCA_UNIT-4_Computer Oriented Numerical Statistical MethodsMCA_UNIT-4_Computer Oriented Numerical Statistical Methods
MCA_UNIT-4_Computer Oriented Numerical Statistical Methods
 
Correlation
CorrelationCorrelation
Correlation
 
Measure of Association
Measure of AssociationMeasure of Association
Measure of Association
 

More from ashish7sattee

Unti 1 bp801 t ga correlation worksheet24022022
Unti 1 bp801 t ga correlation worksheet24022022Unti 1 bp801 t ga correlation worksheet24022022
Unti 1 bp801 t ga correlation worksheet24022022ashish7sattee
 
Unit 1 bp801 t f standard deviation 24022022
Unit 1 bp801 t f standard deviation 24022022Unit 1 bp801 t f standard deviation 24022022
Unit 1 bp801 t f standard deviation 24022022ashish7sattee
 
Unit 1 bp801 t e range24022022
Unit 1 bp801 t e range24022022Unit 1 bp801 t e range24022022
Unit 1 bp801 t e range24022022ashish7sattee
 
Unit 1 bp801 t d mode 24022022
Unit 1 bp801 t d mode 24022022Unit 1 bp801 t d mode 24022022
Unit 1 bp801 t d mode 24022022ashish7sattee
 
Unit 1 bp801 t c median with solved examples
Unit 1 bp801 t c median with solved examplesUnit 1 bp801 t c median with solved examples
Unit 1 bp801 t c median with solved examplesashish7sattee
 
Unit 1 bp801 t b frequency distribution
Unit 1 bp801 t b frequency distributionUnit 1 bp801 t b frequency distribution
Unit 1 bp801 t b frequency distributionashish7sattee
 
Unit 1 BP801T a introduction mean median mode
Unit 1 BP801T a introduction mean median mode Unit 1 BP801T a introduction mean median mode
Unit 1 BP801T a introduction mean median mode ashish7sattee
 
Unit 1 bp801 t i standard deviation
Unit 1 bp801 t  i standard deviationUnit 1 bp801 t  i standard deviation
Unit 1 bp801 t i standard deviationashish7sattee
 
Unit 1 BP801T t h multiple correlation examples
Unit 1  BP801T  t h multiple correlation examplesUnit 1  BP801T  t h multiple correlation examples
Unit 1 BP801T t h multiple correlation examplesashish7sattee
 
MRM301TResearch Methodology and Biostatistics: An introduction to Euthanasia
MRM301TResearch Methodology and Biostatistics: An introduction to  EuthanasiaMRM301TResearch Methodology and Biostatistics: An introduction to  Euthanasia
MRM301TResearch Methodology and Biostatistics: An introduction to Euthanasiaashish7sattee
 
MRM301T Research Methodology and Biostatistics: Euthanasia An Indian perspec...
MRM301T Research Methodology and Biostatistics: Euthanasia  An Indian perspec...MRM301T Research Methodology and Biostatistics: Euthanasia  An Indian perspec...
MRM301T Research Methodology and Biostatistics: Euthanasia An Indian perspec...ashish7sattee
 
MRM301T Research Methodology and Biostatistics: Confidentiality 1 22102021
MRM301T Research Methodology and Biostatistics: Confidentiality 1 22102021MRM301T Research Methodology and Biostatistics: Confidentiality 1 22102021
MRM301T Research Methodology and Biostatistics: Confidentiality 1 22102021ashish7sattee
 
Statistical tools in research 1
Statistical tools in research 1Statistical tools in research 1
Statistical tools in research 1ashish7sattee
 

More from ashish7sattee (14)

Unti 1 bp801 t ga correlation worksheet24022022
Unti 1 bp801 t ga correlation worksheet24022022Unti 1 bp801 t ga correlation worksheet24022022
Unti 1 bp801 t ga correlation worksheet24022022
 
Unit 1 bp801 t f standard deviation 24022022
Unit 1 bp801 t f standard deviation 24022022Unit 1 bp801 t f standard deviation 24022022
Unit 1 bp801 t f standard deviation 24022022
 
Unit 1 bp801 t e range24022022
Unit 1 bp801 t e range24022022Unit 1 bp801 t e range24022022
Unit 1 bp801 t e range24022022
 
Unit 1 bp801 t d mode 24022022
Unit 1 bp801 t d mode 24022022Unit 1 bp801 t d mode 24022022
Unit 1 bp801 t d mode 24022022
 
Unit 1 bp801 t c median with solved examples
Unit 1 bp801 t c median with solved examplesUnit 1 bp801 t c median with solved examples
Unit 1 bp801 t c median with solved examples
 
Unit 1 bp801 t b frequency distribution
Unit 1 bp801 t b frequency distributionUnit 1 bp801 t b frequency distribution
Unit 1 bp801 t b frequency distribution
 
Unit 1 BP801T a introduction mean median mode
Unit 1 BP801T a introduction mean median mode Unit 1 BP801T a introduction mean median mode
Unit 1 BP801T a introduction mean median mode
 
Unit 1 bp801 t i standard deviation
Unit 1 bp801 t  i standard deviationUnit 1 bp801 t  i standard deviation
Unit 1 bp801 t i standard deviation
 
Unit 1 BP801T t h multiple correlation examples
Unit 1  BP801T  t h multiple correlation examplesUnit 1  BP801T  t h multiple correlation examples
Unit 1 BP801T t h multiple correlation examples
 
MRM301TResearch Methodology and Biostatistics: An introduction to Euthanasia
MRM301TResearch Methodology and Biostatistics: An introduction to  EuthanasiaMRM301TResearch Methodology and Biostatistics: An introduction to  Euthanasia
MRM301TResearch Methodology and Biostatistics: An introduction to Euthanasia
 
MRM301T Research Methodology and Biostatistics: Euthanasia An Indian perspec...
MRM301T Research Methodology and Biostatistics: Euthanasia  An Indian perspec...MRM301T Research Methodology and Biostatistics: Euthanasia  An Indian perspec...
MRM301T Research Methodology and Biostatistics: Euthanasia An Indian perspec...
 
MRM301T Research Methodology and Biostatistics: Confidentiality 1 22102021
MRM301T Research Methodology and Biostatistics: Confidentiality 1 22102021MRM301T Research Methodology and Biostatistics: Confidentiality 1 22102021
MRM301T Research Methodology and Biostatistics: Confidentiality 1 22102021
 
ashish7sattee
ashish7satteeashish7sattee
ashish7sattee
 
Statistical tools in research 1
Statistical tools in research 1Statistical tools in research 1
Statistical tools in research 1
 

Recently uploaded

TỔNG ÔN TẬP THI VÀO LỚP 10 MÔN TIẾNG ANH NĂM HỌC 2023 - 2024 CÓ ĐÁP ÁN (NGỮ Â...
TỔNG ÔN TẬP THI VÀO LỚP 10 MÔN TIẾNG ANH NĂM HỌC 2023 - 2024 CÓ ĐÁP ÁN (NGỮ Â...TỔNG ÔN TẬP THI VÀO LỚP 10 MÔN TIẾNG ANH NĂM HỌC 2023 - 2024 CÓ ĐÁP ÁN (NGỮ Â...
TỔNG ÔN TẬP THI VÀO LỚP 10 MÔN TIẾNG ANH NĂM HỌC 2023 - 2024 CÓ ĐÁP ÁN (NGỮ Â...Nguyen Thanh Tu Collection
 
Advanced Views - Calendar View in Odoo 17
Advanced Views - Calendar View in Odoo 17Advanced Views - Calendar View in Odoo 17
Advanced Views - Calendar View in Odoo 17Celine George
 
1029 - Danh muc Sach Giao Khoa 10 . pdf
1029 -  Danh muc Sach Giao Khoa 10 . pdf1029 -  Danh muc Sach Giao Khoa 10 . pdf
1029 - Danh muc Sach Giao Khoa 10 . pdfQucHHunhnh
 
Sociology 101 Demonstration of Learning Exhibit
Sociology 101 Demonstration of Learning ExhibitSociology 101 Demonstration of Learning Exhibit
Sociology 101 Demonstration of Learning Exhibitjbellavia9
 
Explore beautiful and ugly buildings. Mathematics helps us create beautiful d...
Explore beautiful and ugly buildings. Mathematics helps us create beautiful d...Explore beautiful and ugly buildings. Mathematics helps us create beautiful d...
Explore beautiful and ugly buildings. Mathematics helps us create beautiful d...christianmathematics
 
Unit-V; Pricing (Pharma Marketing Management).pptx
Unit-V; Pricing (Pharma Marketing Management).pptxUnit-V; Pricing (Pharma Marketing Management).pptx
Unit-V; Pricing (Pharma Marketing Management).pptxVishalSingh1417
 
Grant Readiness 101 TechSoup and Remy Consulting
Grant Readiness 101 TechSoup and Remy ConsultingGrant Readiness 101 TechSoup and Remy Consulting
Grant Readiness 101 TechSoup and Remy ConsultingTechSoup
 
The basics of sentences session 2pptx copy.pptx
The basics of sentences session 2pptx copy.pptxThe basics of sentences session 2pptx copy.pptx
The basics of sentences session 2pptx copy.pptxheathfieldcps1
 
1029-Danh muc Sach Giao Khoa khoi 6.pdf
1029-Danh muc Sach Giao Khoa khoi  6.pdf1029-Danh muc Sach Giao Khoa khoi  6.pdf
1029-Danh muc Sach Giao Khoa khoi 6.pdfQucHHunhnh
 
Measures of Dispersion and Variability: Range, QD, AD and SD
Measures of Dispersion and Variability: Range, QD, AD and SDMeasures of Dispersion and Variability: Range, QD, AD and SD
Measures of Dispersion and Variability: Range, QD, AD and SDThiyagu K
 
Role Of Transgenic Animal In Target Validation-1.pptx
Role Of Transgenic Animal In Target Validation-1.pptxRole Of Transgenic Animal In Target Validation-1.pptx
Role Of Transgenic Animal In Target Validation-1.pptxNikitaBankoti2
 
Making and Justifying Mathematical Decisions.pdf
Making and Justifying Mathematical Decisions.pdfMaking and Justifying Mathematical Decisions.pdf
Making and Justifying Mathematical Decisions.pdfChris Hunter
 
Nutritional Needs Presentation - HLTH 104
Nutritional Needs Presentation - HLTH 104Nutritional Needs Presentation - HLTH 104
Nutritional Needs Presentation - HLTH 104misteraugie
 
2024-NATIONAL-LEARNING-CAMP-AND-OTHER.pptx
2024-NATIONAL-LEARNING-CAMP-AND-OTHER.pptx2024-NATIONAL-LEARNING-CAMP-AND-OTHER.pptx
2024-NATIONAL-LEARNING-CAMP-AND-OTHER.pptxMaritesTamaniVerdade
 
Presentation by Andreas Schleicher Tackling the School Absenteeism Crisis 30 ...
Presentation by Andreas Schleicher Tackling the School Absenteeism Crisis 30 ...Presentation by Andreas Schleicher Tackling the School Absenteeism Crisis 30 ...
Presentation by Andreas Schleicher Tackling the School Absenteeism Crisis 30 ...EduSkills OECD
 
Energy Resources. ( B. Pharmacy, 1st Year, Sem-II) Natural Resources
Energy Resources. ( B. Pharmacy, 1st Year, Sem-II) Natural ResourcesEnergy Resources. ( B. Pharmacy, 1st Year, Sem-II) Natural Resources
Energy Resources. ( B. Pharmacy, 1st Year, Sem-II) Natural ResourcesShubhangi Sonawane
 
How to Give a Domain for a Field in Odoo 17
How to Give a Domain for a Field in Odoo 17How to Give a Domain for a Field in Odoo 17
How to Give a Domain for a Field in Odoo 17Celine George
 
Holdier Curriculum Vitae (April 2024).pdf
Holdier Curriculum Vitae (April 2024).pdfHoldier Curriculum Vitae (April 2024).pdf
Holdier Curriculum Vitae (April 2024).pdfagholdier
 
Z Score,T Score, Percential Rank and Box Plot Graph
Z Score,T Score, Percential Rank and Box Plot GraphZ Score,T Score, Percential Rank and Box Plot Graph
Z Score,T Score, Percential Rank and Box Plot GraphThiyagu K
 
Mixin Classes in Odoo 17 How to Extend Models Using Mixin Classes
Mixin Classes in Odoo 17  How to Extend Models Using Mixin ClassesMixin Classes in Odoo 17  How to Extend Models Using Mixin Classes
Mixin Classes in Odoo 17 How to Extend Models Using Mixin ClassesCeline George
 

Recently uploaded (20)

TỔNG ÔN TẬP THI VÀO LỚP 10 MÔN TIẾNG ANH NĂM HỌC 2023 - 2024 CÓ ĐÁP ÁN (NGỮ Â...
TỔNG ÔN TẬP THI VÀO LỚP 10 MÔN TIẾNG ANH NĂM HỌC 2023 - 2024 CÓ ĐÁP ÁN (NGỮ Â...TỔNG ÔN TẬP THI VÀO LỚP 10 MÔN TIẾNG ANH NĂM HỌC 2023 - 2024 CÓ ĐÁP ÁN (NGỮ Â...
TỔNG ÔN TẬP THI VÀO LỚP 10 MÔN TIẾNG ANH NĂM HỌC 2023 - 2024 CÓ ĐÁP ÁN (NGỮ Â...
 
Advanced Views - Calendar View in Odoo 17
Advanced Views - Calendar View in Odoo 17Advanced Views - Calendar View in Odoo 17
Advanced Views - Calendar View in Odoo 17
 
1029 - Danh muc Sach Giao Khoa 10 . pdf
1029 -  Danh muc Sach Giao Khoa 10 . pdf1029 -  Danh muc Sach Giao Khoa 10 . pdf
1029 - Danh muc Sach Giao Khoa 10 . pdf
 
Sociology 101 Demonstration of Learning Exhibit
Sociology 101 Demonstration of Learning ExhibitSociology 101 Demonstration of Learning Exhibit
Sociology 101 Demonstration of Learning Exhibit
 
Explore beautiful and ugly buildings. Mathematics helps us create beautiful d...
Explore beautiful and ugly buildings. Mathematics helps us create beautiful d...Explore beautiful and ugly buildings. Mathematics helps us create beautiful d...
Explore beautiful and ugly buildings. Mathematics helps us create beautiful d...
 
Unit-V; Pricing (Pharma Marketing Management).pptx
Unit-V; Pricing (Pharma Marketing Management).pptxUnit-V; Pricing (Pharma Marketing Management).pptx
Unit-V; Pricing (Pharma Marketing Management).pptx
 
Grant Readiness 101 TechSoup and Remy Consulting
Grant Readiness 101 TechSoup and Remy ConsultingGrant Readiness 101 TechSoup and Remy Consulting
Grant Readiness 101 TechSoup and Remy Consulting
 
The basics of sentences session 2pptx copy.pptx
The basics of sentences session 2pptx copy.pptxThe basics of sentences session 2pptx copy.pptx
The basics of sentences session 2pptx copy.pptx
 
1029-Danh muc Sach Giao Khoa khoi 6.pdf
1029-Danh muc Sach Giao Khoa khoi  6.pdf1029-Danh muc Sach Giao Khoa khoi  6.pdf
1029-Danh muc Sach Giao Khoa khoi 6.pdf
 
Measures of Dispersion and Variability: Range, QD, AD and SD
Measures of Dispersion and Variability: Range, QD, AD and SDMeasures of Dispersion and Variability: Range, QD, AD and SD
Measures of Dispersion and Variability: Range, QD, AD and SD
 
Role Of Transgenic Animal In Target Validation-1.pptx
Role Of Transgenic Animal In Target Validation-1.pptxRole Of Transgenic Animal In Target Validation-1.pptx
Role Of Transgenic Animal In Target Validation-1.pptx
 
Making and Justifying Mathematical Decisions.pdf
Making and Justifying Mathematical Decisions.pdfMaking and Justifying Mathematical Decisions.pdf
Making and Justifying Mathematical Decisions.pdf
 
Nutritional Needs Presentation - HLTH 104
Nutritional Needs Presentation - HLTH 104Nutritional Needs Presentation - HLTH 104
Nutritional Needs Presentation - HLTH 104
 
2024-NATIONAL-LEARNING-CAMP-AND-OTHER.pptx
2024-NATIONAL-LEARNING-CAMP-AND-OTHER.pptx2024-NATIONAL-LEARNING-CAMP-AND-OTHER.pptx
2024-NATIONAL-LEARNING-CAMP-AND-OTHER.pptx
 
Presentation by Andreas Schleicher Tackling the School Absenteeism Crisis 30 ...
Presentation by Andreas Schleicher Tackling the School Absenteeism Crisis 30 ...Presentation by Andreas Schleicher Tackling the School Absenteeism Crisis 30 ...
Presentation by Andreas Schleicher Tackling the School Absenteeism Crisis 30 ...
 
Energy Resources. ( B. Pharmacy, 1st Year, Sem-II) Natural Resources
Energy Resources. ( B. Pharmacy, 1st Year, Sem-II) Natural ResourcesEnergy Resources. ( B. Pharmacy, 1st Year, Sem-II) Natural Resources
Energy Resources. ( B. Pharmacy, 1st Year, Sem-II) Natural Resources
 
How to Give a Domain for a Field in Odoo 17
How to Give a Domain for a Field in Odoo 17How to Give a Domain for a Field in Odoo 17
How to Give a Domain for a Field in Odoo 17
 
Holdier Curriculum Vitae (April 2024).pdf
Holdier Curriculum Vitae (April 2024).pdfHoldier Curriculum Vitae (April 2024).pdf
Holdier Curriculum Vitae (April 2024).pdf
 
Z Score,T Score, Percential Rank and Box Plot Graph
Z Score,T Score, Percential Rank and Box Plot GraphZ Score,T Score, Percential Rank and Box Plot Graph
Z Score,T Score, Percential Rank and Box Plot Graph
 
Mixin Classes in Odoo 17 How to Extend Models Using Mixin Classes
Mixin Classes in Odoo 17  How to Extend Models Using Mixin ClassesMixin Classes in Odoo 17  How to Extend Models Using Mixin Classes
Mixin Classes in Odoo 17 How to Extend Models Using Mixin Classes
 

Unit 1 bp801 t g correlation analysis24022022

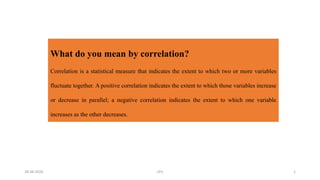
  • 1. What do you mean by correlation? Correlation is a statistical measure that indicates the extent to which two or more variables fluctuate together. A positive correlation indicates the extent to which those variables increase or decrease in parallel; a negative correlation indicates the extent to which one variable increases as the other decreases. 28-08-2020 LPU 1
  • 2. What is a correlation example? Positive correlation exists when two variables move in the same direction. A basic example of positive correlation is height and weight—taller people tend to be heavier, and vice versa. ... In other cases, the two variables are independent from one another and are influenced by a third variable. 28-08-2020 LPU 2
  • 3. What is strong correlation? When the r value is closer to +1 or -1, it indicates that there is a stronger linear relationship between the two variables. A correlation of -0.97 is a strong negative correlation while a correlation of 0.10 would be a weak positive correlation. 28-08-2020 LPU 3
  • 4. Is 0.4 is a strong correlation? This is a strong positive relationship; the correlation coefficient is 0.9408. ... For this kind of data, we generally consider correlations above 0.4 to be relatively strong; correlations between 0.2 and 0.4 are moderate, and those below 0.2 are considered weak. 28-08-2020 LPU 4
  • 5. How do you interpret correlation? Interpret SPSS output for correlations: Pearson's r - YouTube https://www.youtube.com/watch?v=pgQ9T_SdzoQ 28-08-2020 LPU 5
  • 6. APPLICATIONS Correlation is used to describe the linear relationship between two continuous variables (e.g., height and weight). In general, correlation tends to be used when there is no identified response variable. It measures the strength (qualitatively) and direction of the linear relationship between two or more variables. 28-08-2020 LPU 6
  • 7. Pearson's Correlation Coefficient was designed just for linear relationships. Technically, if we get a low value, or a zero value, it does not mean that there is no relationship. It just means that there is no linear relationship 28-08-2020 LPU 7
  • 8. QUIZ 1. If the Pearson Product Moment Correlation Coefficient shows zero value, this definitely means that there is no relationship between the two variables a) True B) False 28-08-2020 LPU 8
  • 9. What is degree of correlation? The degree of intensity of relationship between two variables is measured with the coefficient of correlation. They are as follows: Perfect correlation: If two variables change in the same proportion (increase or decrease), then the correlation between them is perfect correlation. 28-08-2020 LPU 9
  • 19. Problem 1: Based on simple method of finding out Correlation Coefficient ( with average) Calculate karl Pearson’s coefficient of correlation from the following data and interprets it value Marks in Pharmacognosy: 48 35 17 23 47 Marks in Statistics : 45 20 40 25 45 28-08-2020 LPU 19
  • 20. Problem 2: Based on Direct method of finding out Correlation Coefficient Calculate coefficient of correlation from the data given below by the direct method, i.e ., without taking the deviations of items from actual or assumed mean. X 9 8 7 6 5 4 3 2 1 Y 15 16 14 13 11 12 10 8 9 28-08-2020 LPU 20
  • 21. Problem 3: Based on indirect method of finding out Correlation Coefficient( Assumed mean) Calculate the coefficient of correlation between X and Y From the following data. X 78 89 99 60 59 79 68 61 Y 125 137 156 112 107 136 123 108 28-08-2020 LPU 21
  • 22. Problem1. based on regression analysis ( By direct method) From the following data, obtain two regression equations X 6 2 10 4 8 Y 9 11 5 8 7 28-08-2020 LPU 22
  • 23. Problem2. Based on regression analysis ( by actual mean method) The following data relate to the scores obtained by 9 salesmen of a company in an intelligence test and their weekly sales in thousands rupees: a. Obtain the regression equation of sales on intelligence test scores of salesmen. b. If the intelligence score of a salesmen is 65, what would be his expected weekly sales Sal. Int A B C D E F G H I Test [X] Scores 50 60 50 60 80 50 80 40 70 Weekly Sales [Y] 30 60 40 50 60 30 70 50 60 28-08-2020 LPU 23
  • 24. Problem3. Based on regression analysis ( by assumed mean method) The following table shows ages [X] and blood pressure [Y] of 8 persons: Obtain the regression equation of Y on X and find the expected blood pressure of a person who is 49 years old Ages [X] 52 63 45 36 72 65 47 25 BP [Y] 62 53 51 25 79 43 60 33 28-08-2020 LPU 24
  • 25. 28-08-2020 LPU 25 TERMINOLOGY IN STATISTICS 1.Predictor variable or Explanatory variable or Regressor variable is also known as independent variable used in regression analyses. 2. Response variable is also known as dependent variable. Other names are a. Regressand variable b. Predictand variable c. Explained variable
  • 26. 28-08-2020 LPU 26 QUIZ 1. In regression analysis, the variable that is being predicted is the A. Response, or dependent, variable b. Independent variable c. Intervening variable d. Is usually x
  • 27. 28-08-2020 LPU 27 2. The correlation coefficient is used to determine: a. A specific value of the y-variable given a specific value of the x-variable b. A specific value of the x-variable given a specific value of the y-variable C. The strength of the relationship between the x and y variables d. None of these