SlideShare a Scribd company logo
1 of 23
SESSION 6: FREE MOVEMENT OF PERSONS II: FREEDOM
OF ESTABLISHMENT (art. 49 TFEU)
Reading assignments to be defined.
Bibliography:
H. BRONCKHORST, Freedom of Establishment and Freedom to
Provide Services under the EEC Treaty, Common Market Law
Review, 12 (1975), p. 245-253.
K. ENSING SORENSEN, The fight against letterbox companies
in the internal market, Common Market Law Review, 52 (2015),
p. 85-117.
A.Th.S. LEENEN, Recent case law of the Court of Justice of the
European Communities on the freedom of establishment and the
freedom to provide services, Common Market Law Review, 17
(1980), p. 259-268.
O. MORSDORF, The legal mobility of companies within the
European Union through cross-border conversion, Common
Market Law Review, 49 (2012), p. 629-670.
W. VAN GERVEN, The right of establishment and free supply
of services within the Common Market, Common Market Law
Review, 3 (1966), p. 344-362.
G. VIEIRA DA COSTA CERQUEIRA, Libre circulation des
sociétés en Europe: concurrence ou convergence des modèles
juridiques, RTD Eur. janv.-mars 2014, p. 7-38.
P. WATSON, Freedom of establishment and freedom to provide
services: Some recent developments, Common Market Law
Review, 20 (1983), p. 767-824.
Running Head: JD SPORTS FASHION PLC
1
JD SPORTS FASHION PLC 20
Evaluating JD Sports Fashion Financial Strategy
Institution
Student’s Name
Background
JD sports fashion plc is one of the reputable fashion in the UK.
JD sports fashion plc trace back to 1981, founded by John David
from a single store in bury, and currently operates more than
12,300 stores including its retail fascia’s and provide more than
30,000 direct employment. The rapid expansion of its retail s
store is largely influenced by it management resilient for
continuous acquisition of a strategic business in the business.
the current executive chairman is Peter Cowgill. JD fashion
opened its doors in London in 1989. A notable milestone in the
history of JD was the flotation of its stock in the London stock
market in 1996 (London stock exchange, 2018). The major
market for JD sports fashion is currently in UK Ireland , but
currently intensifying operation in 15 different country majority
in Europe. Since 2005, the majority of the JD sports fashion plc
shares are owned by Pentland group (JD sports fashion plc,
2018). With expanding demand influenced by a growing taste
for sportswear, JD found it easy to penetrate them in the UK
market.
Considering the high competition in the industry from both
local and international brands 0JD fashions plc presented itself
as a provider of exclusive unique products that meet the
growing stylish need from the UK customers. By collaborating
with already established brands such as Nike Puma and Reebok,
JD fashion created an image of innovativeness and centered
toward the stylish need of the consumers (JD sports fashion plc,
2018). JD fashions have created a reputation as a provider of
high-quality premium products from the recognized brands. In
an attempt to improve its competitiveness, and acquire synergy
to venture into the global market JD fashions management has
in the past implemented various strategies aimed at penetrating
the market outside the UK.
During the first two decades, JD growth was accelerated
through increasing its sale revenue from its established stores.
After 2000, JD fashions experienced a rapid growth influenced
by the corporate strategy of acquisition. In its distribution
strategy, JD sports fashion primarily rely on retail sales
supplemented with wholesale and its multi-channel model.
Through it, multi-channel customers are able to access its
products through its sales website, mobile phone apps and
another online store.
A major development in JD fashion plc
Since the established of JD sports fashion, its management has
taken various action that set the current success of the
corporation. One of the notable steps was in 2002 when the
organization managed to acquire the first sport, adding close to
200 stores in its portfolio. Later in 2004, JD fashion acquired
Scotts and bank fashion, that saw the introduction of an
innovative fascia brand that targets the young consumers (JD
sports fashion plc, 2018). In the same year, in a move that saw
JD fashion becoming one of the largest fashion industries in the
UK was the acquisition of AllSports providing an additional 70
stores in its portfolio.
Later on, the organization intensified its acquisition providing it
with an opportunity to venture into the foreign market. For
instance, the acquisition of Chausportin France provided the
organization with additional synergy to penetrate the French
market. After the acquisition of Chausportin, JD fashion
acquired the ownership of the Canterbury of New Zealand rugby
brands.
In the past five years, the fashion industry in the UK and the
global market has experienced some tough challenge. In order
for JD fashions to remain competitive, the management has
maintained an innovative approach in the operation of JD. One
of the measures is by ensuring that it maintains market research
as an ongoing process in order to actively monitor its rivals and
evaluate consumers trends.
In 2016, one notable management decision was the acquisition
of the multi-brand sports fashion in Malaysia. The acquisition
provided an opportunity to venture in the Malaysian economy
and more, intensify its online sales by gaining control of its
trading website (JD sports fashion plc, 2018 in the same year,
JD fashion opened its first fascia store in Portugal through the
acquisition of 80% share issued by Sportlberica Sociedade,
providing 12 stores into its portfolio. Flexing its muscles in the
Australian market the organization acquired an 80% share in
next athleisure Pty Limited providing additional 32 stores and a
trading website (JD sports fashion plc, 2018). The acquisition in
Malaysia followed by that in Australia in 2017, expressed the
JD sports fashion plc ambition to venture outside the European
market.
Moreover, the acquisition of going outdoors is an expression of
the organization commitment to expands its market share
through acquisition of key rivals in the industry and provide
synergy to penetrate another region (Competition & Markets
Authority, 2017).
.
Current JD sports fashions plc markets segments and retail
outlets
The table below provides a summary of the fascias store
held by JD fashions and its respective subsidiaries in the year
2016 and 2017.
JD United Kingdom and Republic of Ireland
Other European countries
JD in Asian countries
Stores by the brand size?
Cahusport (france)
Sprinter
Sur
Austarian market
2016
361
103
1
36
72
104
0
0
2017
369
157
3
37
75
119
164
32
Table no1: data compiled from JD sports annual financial report
2018
The table above indicates the number of store outlet
management by JD sports fashion in the UK and another market
segment which indicated a significant increase in each market.
JD sports fashion in collaboration with its subsidiaries offers a
wide range of products. Some of the products in its portfolio
include shirts, jackets, swimwear and footwear. Among its
multiple channels, the retail stores account for the highest level
attaining an 80% of the total revenue gain. The second is the
multichannel attaining 16% with wholesale revenue accounting
for 4% of the total revenue gain.
Stock market performance analysis for JD stock
Various analyst forecast that JD fashion will continue to
perform well in the near future. Reflecting on its historical
performance the organization has produced results above
average in the last five years.
Currently, JD sports fashion plc has a market capitalization of
approximately 3,751.81 million pounds (London stock
exchange, 2018). Comparing the dividend issue in 2017 and
2018, a slight improvement of 5.2% existence on the divided
payable per ordinary shares. On the other hand, adjusted earning
per rose by 32% from the previous 19.04% in 2017 to 25.15% in
2018. While the basic earnings for the ordinary shareholders
increased by 30% up to 23.83 per share from 18.33p in 2017.
However, although JD shares have experienced growth its
dividend rise has remained relatively low influenced by the
management decision to restrain dividend increase to finance its
invents.
Early in 2014, the stock value of JD sports fashion was rising
consistently having risen from price 282 by the end of October
2013 and closed and the estimated price of 507 by 31st
December 2014 (London stock exchange, 2018). In the year
2015, its share value continued to rise at and closed at price
1041.01 by 31st December 2015 (London stock exchange,
2018). The value continues to rise drastically reaching the
highest point within the five years at 1574.6 in October and
sharply declining at the beginning of December same year to its
five years lowest at price 319 pounds.
In the last one month, JD sport fashion shares have considerable
declined up from 460 at the beginning of September and
declining to 387.8 by the close of 22nd October this year
(London stock exchange, 2018).
On the other hand, despite the increasing profitability for the JD
fashions plc, dividends payout to the shareholders increased
slightly as summarized in the table below
Financial year
Eps
Dividend cover
Dividends per share
Dividend per share growth
2014
4.13
3.05
1.36
-
2015
5.41
4.99
1.41
4.6%
2016
10.03
6.78
1.48
4.06%
2017
18.38
12.25
1.5
1.35%
2018
23.83
14.62
1.63
6.62%
Table no2: data compiled from the London stock exchange
(2018)
Financial performance in the last five years
To obtain a clear view of the financial performance of the
company a summary of the key financial particular for JD sports
fashion plc from 2014 to 2018 is outlined in the table below
Particular
2014
2015
2016
2017
2018
Revenue (million pounds)
1330
1522
1822
2379
3161
Operating profit
60
93
133
240
296
Net profit
57
68
98
179
232
Current assets
329
400
510
714
971
Total assets
599
681
791
1178
1626
Current liabilities
285.65
326
384
535
682
Total liabilities
339.8
365
408
626
855
Total equity
272.84
309
400
578
834
Table no3: data adapted from JD sports fashion financial plc
statements 2013-2018
JD fashion mainly generate its revenues in the UK, with other
European countries following but only a few from the rest of the
world as shown in the table below
Region
Percentage revenue
United Kingdom
70%
Europe
28%
Rest of the world
2%
Table no4: data adapted from JD sports fashion financial plc
statements 2013-2018
A fact worth noting is that 79% of JD Fashions revenue is
generated through its retail stores, followed by multichannel
outlets at 14% and only 7% of the revenue generated through
wholesale. The fact that JD fashion plc distribution channel
directly deal with the consumer eliminating intermediaries
increase its profit margin. The elimination of intermediary as a
strategy helps to reduce the cost of their products. The sales
growth has been consistently increasing in the last five years as
presented in the table below
Year
Gross revenue (million pounds)
Gross profit (million pounds)
Gross revenue percentage change
2014
1330
592
-
2015
1522
739
25.15
2016
1822
884
19.67
2017
2379
1163
30.58
2018
3161
1549
32.9
Table no5: data adapted from JD sports fashion financial plc
statements 2013-2018
The company revenue has consistently increased in the last four
years, moving from 592 million pounds in 2014 to 1549 million
pounds by the end of 2018 financial year.
Graph no1: Data compiled from JD sports fashion financial plc
statements 2013-2018
The graph above demonstrates the revenue growth in JD sports
and fashion plc from the year 2013 to 2018
Financial analysis JD sports fashions for the last 5 years
Financial performance of an organization provides an
essential knowledge of the effectiveness of the strategy adopted
by the organization. By conducting a brief financial analysis of
JD fashions plc provide essential information on the financial
status of the company.
Inventory turnover
To get a better view on how the strategies used by JD
sports fashion assist in enhancing efficiency in utilization of the
organization assets. The table below present JD fashions turn
over and cost of good figures in the last five years and 2015 as
the base year.
Year
Cost of good in million pounds
Inventory million pounds
Inventory ratio
2014
624.220
186
3.03
2015
782.703
225
3.808
2016
937.431
238
4.561
2017
1215.053
348
5.91
2018
1629.8
478
7.93
Table no6: data adapted from JD sports fashion financial plc
statements 2013-2018
Thus, in 2015 the opening inventory was 186 million and
ended at 225 million pounds. Average inventory is 205.5
million pounds in 2015 when the cost of good was equal to
782,703 million pounds. Basing the inventory turnover on the
average turnover in 2015, it is evident that the rate at which JD
sports fashion replenish its stock continue to improve. JD
fashion replenishes its stock more than three times per year. The
increase in inventory turnover accompanied by increasing
inventory is an indication of effective inventory management.
Receivable turnover
Obtained by dividing the JD sports fashion plc net income by
average receivable.
Year
Receivable turnover
2014
56.31
2015
94.06
2016
70.36
2017
32.55
2018
21.61
Table no7: data adapted from JD sports fashion financial plc
statements 2013-2018
The rate at which the revenues were totally collected from
receivable accounts decreases drastically from 2014 at 56.31 to
21.61 times annual. The decreasing receivable collection rate
may signal that JD sports fashions plc may have relaxed its
stringent policy of debt collection.
Profitability ratio
Year
Gross income (million pounds)
Ebit (million pounds)
Net income. (million pounds)
Net profit margin (%)
Gross profit margin (gross/net)
Operating profit (million pounds)
Operating profit margin (operating/net)
Total assets. (million pounds)
Return on assets (net income/total asset)
Total equity. (million pounds)
Return of equity (net income/equi ty)
2014
592
-
57
9.6%
10.37
77.8
-
600
9.5%
273
20.87%
2015
739
99
68
9.2%
10.81
92.64
1.36
683
9.9%
310
21.93%
2016
884
159
98
11%
8.94
133.4
1.36
793
12.35%
401
24.43%
2017
1,163
246
179
15.4%
6.474
913
5.1
1,187
15%
579
30.91%
2018
1,549
311
232
14.9%
6.67
1238
5.33
1,636
14.18%
834
27.82%
Table no8: data adapted from JD sports fashion financial plc
statements 2013-2018
On the profitability ratios, in the last five years, the
company gross profit margin ranges from 10.87 to 6.4. The ratio
has consistently decreased from 10.37 in 2014 to 6.67 in the JD
sport financial year 2018. The decreasing margin indicates that
the proportion of income spent on the purchase of goods is
consistently improving. The improvement may be attributed to
improved competitiveness and associated with economies of
scale enjoyed by JD sports fashion plc. On net profit margin, JD
sports fashion continue to improve considering that in 2014 the
margin was at 9.2 and has risen with more than 5% attaining
14.9% in 2018 financial year.
Current ratio
By calculating the JD sports fashion plc current ratio, a clear
view on the company liquidity strength. The current ratio is
obtained by dividing JD sports fashion current asset with
liabilities.
Financial year
Current asset. (million pounds)
Current liabilities. (million pounds)
Current ratio (current asset/current liabilities)
2014
330
286
1.153
2015
400
327
1.22
2016
511
348
1.47
2017
714
535
1.33
2018
972
682
1.42
table no9: data adapted from JD sports fashion financial plc
statements 2013-2018
Considering the current ratio performance for JD sports
fashion plc in the past five years is relatively healthy with a
ratio above one. Though the current ratio is not consistently
stable in each year it is evident that if JD sports fashion
undergoes liquidation its current asset will fully offset its
current liabilities.
Debt-to-assets ratio
Financial year
Total liabilities. (million pounds)
Total assets. (million pounds)
Debt-to-assets ratio (liability/asset)
2014
327
600
54.5%
2015
373
683
54.61%
2016
390.471
793
49.22%
2017
600.094
1178
50.9%
2018
801
1,636
48.96%
table no10: data adapted from JD sports fashion financial plc
statements 2013-2018
In 2014 and 2015, the solvency ratio for JD sports fashion
plc indicate that more than 50% of its assets were financed by
debts. Although the ratio decreased, the dependence on
liabilities remained relatively high at 50.9% and 48.96% in
2017 and 2018.
Debt-to-equity ratio
Financial year
Total asset. (million pounds)
Equity. (million pounds)
Debt-to-equity ratio (debt/equity)
2014
600
273
2.91
2015
683
310
2.2
2016
793
401
1.97
2017
1178
579
2.03
2018
1,636
834
1.96
Table no11: data adapted from JD sports fashion financial plc
statements 2013-2018
As indicated in the table above JD sports debt-to-equity
ratio is relatively high, ranging between 1.96 to 2.97. Thus, in
the case of liquidation, its shareholder equity is capable of
clearing the total debts of the company.
Swot analysis
· Holding of various trademarks ensure that JD sports fashion
plc provide an exclusive range of products to their customers
and hence presenting unique and appealing products to its
customers. Moreover, the diverse range of brands enables JD
sports fashion to provide exclusive and unique products and
thus position itself more competitive in the market compared to
its rivals.
· The existence of a centralized warehouse whose operations are
highly automated provide additional benefits of increasing
operational efficiency as well as reduced cost of operations.
· The sale trends in JD fashion plc are influenced by seasonal
consumption trends with peaks period around major annual
celebrations. Christmas and Easter holidays are the most
important peak seasons that greatly influence the organization
annual turnover. If the shopping trends around the key holidays
do not favour the JD sales it may lead to excess inventory that
may pose a challenge for the organization to clear in the offpeak
period.
· Another weakness is its high dependence on third party
suppliers of the brand products. An alternative to reduce
overdependence is by either to own or acquire exclusive
licensing. Depending solely on third-party suppliers increase
risk exposure if JD sports fashion loses its key suppliers.
Moreover, overdependence of the retail sales on the brand
product provided by the third party provide the suppliers with a
stronger bargaining capability.
· JD sports fashion market is not quite diversified with more
than 80% of its revenue depending on the UK market alone.
· Continuous acquisition of competitive brands in international
markets provide opportunities to venture into international
markets. The expansion provides an opportunity to enjoy
economy and scale and improve bargaining powers from its
suppliers.
· Considering that the European countries are the primary
market for JD sports fashion with this particular market segment
controlling more than 80% of the company sale, Brexit in early
2019. The fact that the majority of the brand's products are
sourced outside the UK market exposed the JD sports fashions
to currency exchange shocks, logistics challenges and different
legal standards
Evaluation of JD sports fashion growth drivers.
after the organization first hit a 100 million pounds in
profit in 2015, the company profit level has grown wi th over
200 million pounds. Registering a rise of more than 200% in the
consecutive three years.
one of the strategies attributed to the organization revenue
growth is consistent innovation in the product offered by JD
sports fashion. The corporate combine various products from
various reputable brands. On the other hand, investment through
acquisition has made the corporate broader. For instance,
athleisure a subsidiary of JD sports fashion in Australia
provides trend imports and streetwear for youth and young
adults from local and foreign brands such as nude Lucy, Kappa
and Superga.
Secondly, JD sports fashions have increased its investment
in technology aimed at increasing service delivery and customer
satisfaction. Increased technological used has improved service
delivery as well as meeting the dynamics need of the
consumers. The ability for customers to order their products
online provide consumers with a convenient way to order JD
sports fashion products. The success of the JD sports fashion in
the venturing into the international market provides a platform
for expanding its multichannel model and guarantee increase
sale in future from the accessible global market. The increased
popularity in the use of mobile apps and reliance on social
media platform provide access to JD fashion products and hence
increase organization sales from in-store (JD sports fashion plc,
2018). An additional benefit for using the online platform is
that it provides customers with an opportunity to exclusive
products that are not readily available in the organization stores
(Grawel & Levy, 2015). By combining both digital and physical
store retail the organization provides a convenient platform for
the consumers to conduct sopping across the multichannel.
Another key driver of JD sports fashion growth is its online
market model, through the acquisition the JD sports have to
acquire control of online marketing websites in both domestic
and foreign market. In collaboration with recognized brands in
the apparel industry. The fact JD sports retail its product
directly to the consumers enabled the organization to take
control of its market and accelerate organic growth (Grawel &
Levy, 2015).
To overcome competition and remain appealing the JD sports
fashion has maintained its resilience in increasing new global
brand suppliers. Increasing the brand portfolio provide a
competitive advantage to the organization by ensuring that the
organization products retaining their uniqueness and hence more
appealing. Moreover, the JD fashions clearly differentiate their
store compared to their major rival in the market to ensure that
they remain unique and appealing for the shoppers (Grawel &
Levy, 2015). JD sports fashions consider the action of
partnering with the third-party brands as critical in organization
expansion.
The management of JD sports ensures that the company stores
main world-class standards as a strategy of increasing traffic to
the showrooms. Within the past five years, the group has
aggressively expanded its physical stores in both the UK and
foreign countries. Combining both spaces and a wide range of
exclusive products the organization has managed to improve the
frequencies of customers in their stores. For instance, the
opening of 20,000 sq. ft. In Liverpool, one in 2017 and 17,000
sq. feet in Arnade, Manchester the same year is a clear
expression of the organization commitment in providing a
unique shopping experience and exclusive products (JD sports
fashion Plc annual report and accounts 2018).
Conclusion
By evaluating the financial performance of JD sports fashion in
the past five years it's clear that the management has managed
to maintain a high competitive ability for the company. The
restrained dividend payout despite the increasing profit
indicates the management resilence in expanding its market
coverage through acquisition. Despite the huge capital
investment as in various acquisition JD sports fashion liquidity
ratio has remained relatively strong as indicated by its debt-to-
equity ratio.
The future of performance of JD sports fashion plc remains
promising basing on the aggressive market expansion in more
than ten worldwide. Moreover, the improving global economy
may slightly increase the profitability for the apparel industry
(Nenni, Giustiniano & Pirolo, 2013). As forecasted by Deloitte
(2018), the fact that European countries to be among the top
consumers of premium apparel brands will provide will increase
the organization profitability and venture into other viable
global markets. The favorable exchange rate is expected to
promote international consumption (Nenni, Giustiniano &
Pirolo, 2013).
However, the Brexit uncertainty continues to pose a challenge
for the UK based multinational organization accompanied by
raising the cost of apparel produced pushed by increasing cost
of raw materials and labor regulations (Nenni, Giustiniano &
Pirolo, 2013).
References
Annual report & accounts 2017.
https://www.companyreporting.com/sites/default/files/annual -
report-index/JD_sports_fashion_plc-annual-report-2017.pdf
Competition & Markets Authority (2017). Complete acquisition
by JD sports Fashion Plc of Go Outdoors Topco Limited. A
decision on the relevant merger situation and substantial
lessening of competition.
https://assets.publishing.service.gov.uk/media/5937dd12ed915d
20fb0001a3/JD-sports-go-outdoors-decision-160517.pdf
Deloitte (2018). Global powers of luxury goods 2018.: shaping
the future of the luxury industry.
https://www2.deloitte.com/content/dam/Deloitte/global/Docume
nts/Consumer-Business/cb-global-powers-luxury-goods-
2018.pdf
Grewal Dhruv & Levy Michael (2015). Marketing, fifth edition,
McGraw-Hill Education
JD Sports Fashion Annual report and Accounts 2018.
https://www.JDplc.com/~/media/Files/J/JD-Sports-Fashion-
Plc/reports-and-presentations/2018-annual-report-v1.pdf
JD Sports Fashion Plc (2018). History.
https://www.JDplc.com/company-information/history.aspx
London stock exchange (2018). JD SPORTS FASHION PLC
ORD 0.25P.
https://www.londonstockexchange.com/exchange/prices-and-
markets/stocks/summary/company-
summary/GB00BYX91H57GBGBXSTMM.html
Nenni e. Mari, Giustiniano L. & Pirolo l. (2013). Demand
forecasting in the fashion industry: A review.
https://iris.luiss.it/retrieve/handle/11385/76460/1076/InTech-
Demand_forecasting_in_the_fashion_industry_a_review.pdf
Gross profit in millions of UK pounds 2013 2014 2015 2016
2017 2018 1258.9000000000001 1216.4000000000001
739550 884221 1163641 1531600

More Related Content

Similar to Session 6 free movement of persons ii freedom of establishment (

Running Head JD SPORTS FASHION PLC
 Running Head JD SPORTS FASHION PLC                               Running Head JD SPORTS FASHION PLC
Running Head JD SPORTS FASHION PLC MikeEly930
 
Website Wars - Sports Direct vs JD Sports
Website Wars - Sports Direct vs JD SportsWebsite Wars - Sports Direct vs JD Sports
Website Wars - Sports Direct vs JD SportsDigivante
 
Business analysis for Sports DirectIntroductionSports Dire.docx
Business analysis for Sports DirectIntroductionSports Dire.docxBusiness analysis for Sports DirectIntroductionSports Dire.docx
Business analysis for Sports DirectIntroductionSports Dire.docxRAHUL126667
 
Research Project China 2013
Research Project China 2013Research Project China 2013
Research Project China 2013David Connor
 
Adidas - project report
  Adidas - project report  Adidas - project report
Adidas - project reportPrathamesh Kadu
 
Presentation on Pantaloons
Presentation on PantaloonsPresentation on Pantaloons
Presentation on PantaloonsUPES
 
Final Assignment Finished
Final Assignment FinishedFinal Assignment Finished
Final Assignment FinishedLogan Stodart
 
Financial Report Q1 2018
Financial Report Q1 2018Financial Report Q1 2018
Financial Report Q1 2018BANCO SANTANDER
 
Brochure & Order Form_Sourcing Activities of leading Clothing Retailers in Eu...
Brochure & Order Form_Sourcing Activities of leading Clothing Retailers in Eu...Brochure & Order Form_Sourcing Activities of leading Clothing Retailers in Eu...
Brochure & Order Form_Sourcing Activities of leading Clothing Retailers in Eu...yStats.com
 
Fundamental Analysis of Stocks.pptx
Fundamental Analysis of Stocks.pptxFundamental Analysis of Stocks.pptx
Fundamental Analysis of Stocks.pptxAkashAV6
 
A4 market analysis_diazcales
A4 market analysis_diazcalesA4 market analysis_diazcales
A4 market analysis_diazcalesGerardoDiaz90
 
The Kooples Fashion Strategy Report
The Kooples Fashion Strategy Report The Kooples Fashion Strategy Report
The Kooples Fashion Strategy Report Mimi Gunn
 
Mid term exam1
Mid term exam1Mid term exam1
Mid term exam1Bakryk
 

Similar to Session 6 free movement of persons ii freedom of establishment ( (20)

Running Head JD SPORTS FASHION PLC
 Running Head JD SPORTS FASHION PLC                               Running Head JD SPORTS FASHION PLC
Running Head JD SPORTS FASHION PLC
 
Website Wars - Sports Direct vs JD Sports
Website Wars - Sports Direct vs JD SportsWebsite Wars - Sports Direct vs JD Sports
Website Wars - Sports Direct vs JD Sports
 
Business analysis for Sports DirectIntroductionSports Dire.docx
Business analysis for Sports DirectIntroductionSports Dire.docxBusiness analysis for Sports DirectIntroductionSports Dire.docx
Business analysis for Sports DirectIntroductionSports Dire.docx
 
ADIDAS STUDY
ADIDAS STUDYADIDAS STUDY
ADIDAS STUDY
 
Managing Finance.docx
Managing Finance.docxManaging Finance.docx
Managing Finance.docx
 
Research Project China 2013
Research Project China 2013Research Project China 2013
Research Project China 2013
 
Adidas - project report
  Adidas - project report  Adidas - project report
Adidas - project report
 
Presentation on Pantaloons
Presentation on PantaloonsPresentation on Pantaloons
Presentation on Pantaloons
 
Retail industry
Retail industryRetail industry
Retail industry
 
Final Assignment Finished
Final Assignment FinishedFinal Assignment Finished
Final Assignment Finished
 
Adidas Marketing Case Study
Adidas Marketing Case StudyAdidas Marketing Case Study
Adidas Marketing Case Study
 
Nike project
Nike projectNike project
Nike project
 
IG Group Imsq1 sep10
IG Group Imsq1 sep10IG Group Imsq1 sep10
IG Group Imsq1 sep10
 
Financial Report Q1 2018
Financial Report Q1 2018Financial Report Q1 2018
Financial Report Q1 2018
 
Brochure & Order Form_Sourcing Activities of leading Clothing Retailers in Eu...
Brochure & Order Form_Sourcing Activities of leading Clothing Retailers in Eu...Brochure & Order Form_Sourcing Activities of leading Clothing Retailers in Eu...
Brochure & Order Form_Sourcing Activities of leading Clothing Retailers in Eu...
 
Fundamental Analysis of Stocks.pptx
Fundamental Analysis of Stocks.pptxFundamental Analysis of Stocks.pptx
Fundamental Analysis of Stocks.pptx
 
A4 market analysis_diazcales
A4 market analysis_diazcalesA4 market analysis_diazcales
A4 market analysis_diazcales
 
The Kooples Fashion Strategy Report
The Kooples Fashion Strategy Report The Kooples Fashion Strategy Report
The Kooples Fashion Strategy Report
 
Adidas
AdidasAdidas
Adidas
 
Mid term exam1
Mid term exam1Mid term exam1
Mid term exam1
 

More from aryan532920

According to the NASW Code of Ethics section 6.04 (NASW, 2008), .docx
According to the NASW Code of Ethics section 6.04 (NASW, 2008), .docxAccording to the NASW Code of Ethics section 6.04 (NASW, 2008), .docx
According to the NASW Code of Ethics section 6.04 (NASW, 2008), .docxaryan532920
 
According to the text, crime has been part of the human condition si.docx
According to the text, crime has been part of the human condition si.docxAccording to the text, crime has been part of the human condition si.docx
According to the text, crime has been part of the human condition si.docxaryan532920
 
According to Ronald Story and Bruce Laurie, The dozen years between.docx
According to Ronald Story and Bruce Laurie, The dozen years between.docxAccording to Ronald Story and Bruce Laurie, The dozen years between.docx
According to Ronald Story and Bruce Laurie, The dozen years between.docxaryan532920
 
According to Kirk (2016), most of your time will be spent work with .docx
According to Kirk (2016), most of your time will be spent work with .docxAccording to Kirk (2016), most of your time will be spent work with .docx
According to Kirk (2016), most of your time will be spent work with .docxaryan532920
 
According to the Council on Social Work Education, Competency 5 Eng.docx
According to the Council on Social Work Education, Competency 5 Eng.docxAccording to the Council on Social Work Education, Competency 5 Eng.docx
According to the Council on Social Work Education, Competency 5 Eng.docxaryan532920
 
According to Kirk (2016), most of our time will be spent working.docx
According to Kirk (2016), most of our time will be spent working.docxAccording to Kirk (2016), most of our time will be spent working.docx
According to Kirk (2016), most of our time will be spent working.docxaryan532920
 
According to Kirk (2016), most of your time will be spent working wi.docx
According to Kirk (2016), most of your time will be spent working wi.docxAccording to Kirk (2016), most of your time will be spent working wi.docx
According to Kirk (2016), most of your time will be spent working wi.docxaryan532920
 
According to Davenport (2014) the organizational value of healthcare.docx
According to Davenport (2014) the organizational value of healthcare.docxAccording to Davenport (2014) the organizational value of healthcare.docx
According to Davenport (2014) the organizational value of healthcare.docxaryan532920
 
According to the authors, privacy and security go hand in hand; .docx
According to the authors, privacy and security go hand in hand; .docxAccording to the authors, privacy and security go hand in hand; .docx
According to the authors, privacy and security go hand in hand; .docxaryan532920
 
According to Gilbert and Troitzsch (2005), Foundations of Simula.docx
According to Gilbert and Troitzsch (2005), Foundations of Simula.docxAccording to Gilbert and Troitzsch (2005), Foundations of Simula.docx
According to Gilbert and Troitzsch (2005), Foundations of Simula.docxaryan532920
 
According to Klein (2016), using ethical absolutism and ethical .docx
According to Klein (2016), using ethical absolutism and ethical .docxAccording to Klein (2016), using ethical absolutism and ethical .docx
According to Klein (2016), using ethical absolutism and ethical .docxaryan532920
 
According to Franks and Smallwood (2013), information has become.docx
According to Franks and Smallwood (2013), information has become.docxAccording to Franks and Smallwood (2013), information has become.docx
According to Franks and Smallwood (2013), information has become.docxaryan532920
 
According to the Council on Social Work Education, Competency 5.docx
According to the Council on Social Work Education, Competency 5.docxAccording to the Council on Social Work Education, Competency 5.docx
According to the Council on Social Work Education, Competency 5.docxaryan532920
 
According to the authors, privacy and security go hand in hand; and .docx
According to the authors, privacy and security go hand in hand; and .docxAccording to the authors, privacy and security go hand in hand; and .docx
According to the authors, privacy and security go hand in hand; and .docxaryan532920
 
According to recent surveys, China, India, and the Philippines are t.docx
According to recent surveys, China, India, and the Philippines are t.docxAccording to recent surveys, China, India, and the Philippines are t.docx
According to recent surveys, China, India, and the Philippines are t.docxaryan532920
 
According to the authors, countries that lag behind the rest of the .docx
According to the authors, countries that lag behind the rest of the .docxAccording to the authors, countries that lag behind the rest of the .docx
According to the authors, countries that lag behind the rest of the .docxaryan532920
 
According to Peskin et al. (2013) in our course reader, Studies on .docx
According to Peskin et al. (2013) in our course reader, Studies on .docxAccording to Peskin et al. (2013) in our course reader, Studies on .docx
According to Peskin et al. (2013) in our course reader, Studies on .docxaryan532920
 
According to Franks and Smallwood (2013), information has become the.docx
According to Franks and Smallwood (2013), information has become the.docxAccording to Franks and Smallwood (2013), information has become the.docx
According to Franks and Smallwood (2013), information has become the.docxaryan532920
 
According to Ang (2011), how is Social Media management differen.docx
According to Ang (2011), how is Social Media management differen.docxAccording to Ang (2011), how is Social Media management differen.docx
According to Ang (2011), how is Social Media management differen.docxaryan532920
 
According to (Alsaidi & Kausar (2018), It is expected that by 2020,.docx
According to (Alsaidi & Kausar (2018), It is expected that by 2020,.docxAccording to (Alsaidi & Kausar (2018), It is expected that by 2020,.docx
According to (Alsaidi & Kausar (2018), It is expected that by 2020,.docxaryan532920
 

More from aryan532920 (20)

According to the NASW Code of Ethics section 6.04 (NASW, 2008), .docx
According to the NASW Code of Ethics section 6.04 (NASW, 2008), .docxAccording to the NASW Code of Ethics section 6.04 (NASW, 2008), .docx
According to the NASW Code of Ethics section 6.04 (NASW, 2008), .docx
 
According to the text, crime has been part of the human condition si.docx
According to the text, crime has been part of the human condition si.docxAccording to the text, crime has been part of the human condition si.docx
According to the text, crime has been part of the human condition si.docx
 
According to Ronald Story and Bruce Laurie, The dozen years between.docx
According to Ronald Story and Bruce Laurie, The dozen years between.docxAccording to Ronald Story and Bruce Laurie, The dozen years between.docx
According to Ronald Story and Bruce Laurie, The dozen years between.docx
 
According to Kirk (2016), most of your time will be spent work with .docx
According to Kirk (2016), most of your time will be spent work with .docxAccording to Kirk (2016), most of your time will be spent work with .docx
According to Kirk (2016), most of your time will be spent work with .docx
 
According to the Council on Social Work Education, Competency 5 Eng.docx
According to the Council on Social Work Education, Competency 5 Eng.docxAccording to the Council on Social Work Education, Competency 5 Eng.docx
According to the Council on Social Work Education, Competency 5 Eng.docx
 
According to Kirk (2016), most of our time will be spent working.docx
According to Kirk (2016), most of our time will be spent working.docxAccording to Kirk (2016), most of our time will be spent working.docx
According to Kirk (2016), most of our time will be spent working.docx
 
According to Kirk (2016), most of your time will be spent working wi.docx
According to Kirk (2016), most of your time will be spent working wi.docxAccording to Kirk (2016), most of your time will be spent working wi.docx
According to Kirk (2016), most of your time will be spent working wi.docx
 
According to Davenport (2014) the organizational value of healthcare.docx
According to Davenport (2014) the organizational value of healthcare.docxAccording to Davenport (2014) the organizational value of healthcare.docx
According to Davenport (2014) the organizational value of healthcare.docx
 
According to the authors, privacy and security go hand in hand; .docx
According to the authors, privacy and security go hand in hand; .docxAccording to the authors, privacy and security go hand in hand; .docx
According to the authors, privacy and security go hand in hand; .docx
 
According to Gilbert and Troitzsch (2005), Foundations of Simula.docx
According to Gilbert and Troitzsch (2005), Foundations of Simula.docxAccording to Gilbert and Troitzsch (2005), Foundations of Simula.docx
According to Gilbert and Troitzsch (2005), Foundations of Simula.docx
 
According to Klein (2016), using ethical absolutism and ethical .docx
According to Klein (2016), using ethical absolutism and ethical .docxAccording to Klein (2016), using ethical absolutism and ethical .docx
According to Klein (2016), using ethical absolutism and ethical .docx
 
According to Franks and Smallwood (2013), information has become.docx
According to Franks and Smallwood (2013), information has become.docxAccording to Franks and Smallwood (2013), information has become.docx
According to Franks and Smallwood (2013), information has become.docx
 
According to the Council on Social Work Education, Competency 5.docx
According to the Council on Social Work Education, Competency 5.docxAccording to the Council on Social Work Education, Competency 5.docx
According to the Council on Social Work Education, Competency 5.docx
 
According to the authors, privacy and security go hand in hand; and .docx
According to the authors, privacy and security go hand in hand; and .docxAccording to the authors, privacy and security go hand in hand; and .docx
According to the authors, privacy and security go hand in hand; and .docx
 
According to recent surveys, China, India, and the Philippines are t.docx
According to recent surveys, China, India, and the Philippines are t.docxAccording to recent surveys, China, India, and the Philippines are t.docx
According to recent surveys, China, India, and the Philippines are t.docx
 
According to the authors, countries that lag behind the rest of the .docx
According to the authors, countries that lag behind the rest of the .docxAccording to the authors, countries that lag behind the rest of the .docx
According to the authors, countries that lag behind the rest of the .docx
 
According to Peskin et al. (2013) in our course reader, Studies on .docx
According to Peskin et al. (2013) in our course reader, Studies on .docxAccording to Peskin et al. (2013) in our course reader, Studies on .docx
According to Peskin et al. (2013) in our course reader, Studies on .docx
 
According to Franks and Smallwood (2013), information has become the.docx
According to Franks and Smallwood (2013), information has become the.docxAccording to Franks and Smallwood (2013), information has become the.docx
According to Franks and Smallwood (2013), information has become the.docx
 
According to Ang (2011), how is Social Media management differen.docx
According to Ang (2011), how is Social Media management differen.docxAccording to Ang (2011), how is Social Media management differen.docx
According to Ang (2011), how is Social Media management differen.docx
 
According to (Alsaidi & Kausar (2018), It is expected that by 2020,.docx
According to (Alsaidi & Kausar (2018), It is expected that by 2020,.docxAccording to (Alsaidi & Kausar (2018), It is expected that by 2020,.docx
According to (Alsaidi & Kausar (2018), It is expected that by 2020,.docx
 

Recently uploaded

Alper Gobel In Media Res Media Component
Alper Gobel In Media Res Media ComponentAlper Gobel In Media Res Media Component
Alper Gobel In Media Res Media ComponentInMediaRes1
 
Science lesson Moon for 4th quarter lesson
Science lesson Moon for 4th quarter lessonScience lesson Moon for 4th quarter lesson
Science lesson Moon for 4th quarter lessonJericReyAuditor
 
How to Make a Pirate ship Primary Education.pptx
How to Make a Pirate ship Primary Education.pptxHow to Make a Pirate ship Primary Education.pptx
How to Make a Pirate ship Primary Education.pptxmanuelaromero2013
 
Final demo Grade 9 for demo Plan dessert.pptx
Final demo Grade 9 for demo Plan dessert.pptxFinal demo Grade 9 for demo Plan dessert.pptx
Final demo Grade 9 for demo Plan dessert.pptxAvyJaneVismanos
 
BASLIQ CURRENT LOOKBOOK LOOKBOOK(1) (1).pdf
BASLIQ CURRENT LOOKBOOK  LOOKBOOK(1) (1).pdfBASLIQ CURRENT LOOKBOOK  LOOKBOOK(1) (1).pdf
BASLIQ CURRENT LOOKBOOK LOOKBOOK(1) (1).pdfSoniaTolstoy
 
_Math 4-Q4 Week 5.pptx Steps in Collecting Data
_Math 4-Q4 Week 5.pptx Steps in Collecting Data_Math 4-Q4 Week 5.pptx Steps in Collecting Data
_Math 4-Q4 Week 5.pptx Steps in Collecting DataJhengPantaleon
 
Introduction to AI in Higher Education_draft.pptx
Introduction to AI in Higher Education_draft.pptxIntroduction to AI in Higher Education_draft.pptx
Introduction to AI in Higher Education_draft.pptxpboyjonauth
 
भारत-रोम व्यापार.pptx, Indo-Roman Trade,
भारत-रोम व्यापार.pptx, Indo-Roman Trade,भारत-रोम व्यापार.pptx, Indo-Roman Trade,
भारत-रोम व्यापार.pptx, Indo-Roman Trade,Virag Sontakke
 
Introduction to ArtificiaI Intelligence in Higher Education
Introduction to ArtificiaI Intelligence in Higher EducationIntroduction to ArtificiaI Intelligence in Higher Education
Introduction to ArtificiaI Intelligence in Higher Educationpboyjonauth
 
Mastering the Unannounced Regulatory Inspection
Mastering the Unannounced Regulatory InspectionMastering the Unannounced Regulatory Inspection
Mastering the Unannounced Regulatory InspectionSafetyChain Software
 
POINT- BIOCHEMISTRY SEM 2 ENZYMES UNIT 5.pptx
POINT- BIOCHEMISTRY SEM 2 ENZYMES UNIT 5.pptxPOINT- BIOCHEMISTRY SEM 2 ENZYMES UNIT 5.pptx
POINT- BIOCHEMISTRY SEM 2 ENZYMES UNIT 5.pptxSayali Powar
 
ENGLISH5 QUARTER4 MODULE1 WEEK1-3 How Visual and Multimedia Elements.pptx
ENGLISH5 QUARTER4 MODULE1 WEEK1-3 How Visual and Multimedia Elements.pptxENGLISH5 QUARTER4 MODULE1 WEEK1-3 How Visual and Multimedia Elements.pptx
ENGLISH5 QUARTER4 MODULE1 WEEK1-3 How Visual and Multimedia Elements.pptxAnaBeatriceAblay2
 
Solving Puzzles Benefits Everyone (English).pptx
Solving Puzzles Benefits Everyone (English).pptxSolving Puzzles Benefits Everyone (English).pptx
Solving Puzzles Benefits Everyone (English).pptxOH TEIK BIN
 
Kisan Call Centre - To harness potential of ICT in Agriculture by answer farm...
Kisan Call Centre - To harness potential of ICT in Agriculture by answer farm...Kisan Call Centre - To harness potential of ICT in Agriculture by answer farm...
Kisan Call Centre - To harness potential of ICT in Agriculture by answer farm...Krashi Coaching
 
Paris 2024 Olympic Geographies - an activity
Paris 2024 Olympic Geographies - an activityParis 2024 Olympic Geographies - an activity
Paris 2024 Olympic Geographies - an activityGeoBlogs
 
Pharmacognosy Flower 3. Compositae 2023.pdf
Pharmacognosy Flower 3. Compositae 2023.pdfPharmacognosy Flower 3. Compositae 2023.pdf
Pharmacognosy Flower 3. Compositae 2023.pdfMahmoud M. Sallam
 
call girls in Kamla Market (DELHI) 🔝 >༒9953330565🔝 genuine Escort Service 🔝✔️✔️
call girls in Kamla Market (DELHI) 🔝 >༒9953330565🔝 genuine Escort Service 🔝✔️✔️call girls in Kamla Market (DELHI) 🔝 >༒9953330565🔝 genuine Escort Service 🔝✔️✔️
call girls in Kamla Market (DELHI) 🔝 >༒9953330565🔝 genuine Escort Service 🔝✔️✔️9953056974 Low Rate Call Girls In Saket, Delhi NCR
 
The Most Excellent Way | 1 Corinthians 13
The Most Excellent Way | 1 Corinthians 13The Most Excellent Way | 1 Corinthians 13
The Most Excellent Way | 1 Corinthians 13Steve Thomason
 

Recently uploaded (20)

Alper Gobel In Media Res Media Component
Alper Gobel In Media Res Media ComponentAlper Gobel In Media Res Media Component
Alper Gobel In Media Res Media Component
 
Model Call Girl in Bikash Puri Delhi reach out to us at 🔝9953056974🔝
Model Call Girl in Bikash Puri  Delhi reach out to us at 🔝9953056974🔝Model Call Girl in Bikash Puri  Delhi reach out to us at 🔝9953056974🔝
Model Call Girl in Bikash Puri Delhi reach out to us at 🔝9953056974🔝
 
Science lesson Moon for 4th quarter lesson
Science lesson Moon for 4th quarter lessonScience lesson Moon for 4th quarter lesson
Science lesson Moon for 4th quarter lesson
 
How to Make a Pirate ship Primary Education.pptx
How to Make a Pirate ship Primary Education.pptxHow to Make a Pirate ship Primary Education.pptx
How to Make a Pirate ship Primary Education.pptx
 
Final demo Grade 9 for demo Plan dessert.pptx
Final demo Grade 9 for demo Plan dessert.pptxFinal demo Grade 9 for demo Plan dessert.pptx
Final demo Grade 9 for demo Plan dessert.pptx
 
BASLIQ CURRENT LOOKBOOK LOOKBOOK(1) (1).pdf
BASLIQ CURRENT LOOKBOOK  LOOKBOOK(1) (1).pdfBASLIQ CURRENT LOOKBOOK  LOOKBOOK(1) (1).pdf
BASLIQ CURRENT LOOKBOOK LOOKBOOK(1) (1).pdf
 
TataKelola dan KamSiber Kecerdasan Buatan v022.pdf
TataKelola dan KamSiber Kecerdasan Buatan v022.pdfTataKelola dan KamSiber Kecerdasan Buatan v022.pdf
TataKelola dan KamSiber Kecerdasan Buatan v022.pdf
 
_Math 4-Q4 Week 5.pptx Steps in Collecting Data
_Math 4-Q4 Week 5.pptx Steps in Collecting Data_Math 4-Q4 Week 5.pptx Steps in Collecting Data
_Math 4-Q4 Week 5.pptx Steps in Collecting Data
 
Introduction to AI in Higher Education_draft.pptx
Introduction to AI in Higher Education_draft.pptxIntroduction to AI in Higher Education_draft.pptx
Introduction to AI in Higher Education_draft.pptx
 
भारत-रोम व्यापार.pptx, Indo-Roman Trade,
भारत-रोम व्यापार.pptx, Indo-Roman Trade,भारत-रोम व्यापार.pptx, Indo-Roman Trade,
भारत-रोम व्यापार.pptx, Indo-Roman Trade,
 
Introduction to ArtificiaI Intelligence in Higher Education
Introduction to ArtificiaI Intelligence in Higher EducationIntroduction to ArtificiaI Intelligence in Higher Education
Introduction to ArtificiaI Intelligence in Higher Education
 
Mastering the Unannounced Regulatory Inspection
Mastering the Unannounced Regulatory InspectionMastering the Unannounced Regulatory Inspection
Mastering the Unannounced Regulatory Inspection
 
POINT- BIOCHEMISTRY SEM 2 ENZYMES UNIT 5.pptx
POINT- BIOCHEMISTRY SEM 2 ENZYMES UNIT 5.pptxPOINT- BIOCHEMISTRY SEM 2 ENZYMES UNIT 5.pptx
POINT- BIOCHEMISTRY SEM 2 ENZYMES UNIT 5.pptx
 
ENGLISH5 QUARTER4 MODULE1 WEEK1-3 How Visual and Multimedia Elements.pptx
ENGLISH5 QUARTER4 MODULE1 WEEK1-3 How Visual and Multimedia Elements.pptxENGLISH5 QUARTER4 MODULE1 WEEK1-3 How Visual and Multimedia Elements.pptx
ENGLISH5 QUARTER4 MODULE1 WEEK1-3 How Visual and Multimedia Elements.pptx
 
Solving Puzzles Benefits Everyone (English).pptx
Solving Puzzles Benefits Everyone (English).pptxSolving Puzzles Benefits Everyone (English).pptx
Solving Puzzles Benefits Everyone (English).pptx
 
Kisan Call Centre - To harness potential of ICT in Agriculture by answer farm...
Kisan Call Centre - To harness potential of ICT in Agriculture by answer farm...Kisan Call Centre - To harness potential of ICT in Agriculture by answer farm...
Kisan Call Centre - To harness potential of ICT in Agriculture by answer farm...
 
Paris 2024 Olympic Geographies - an activity
Paris 2024 Olympic Geographies - an activityParis 2024 Olympic Geographies - an activity
Paris 2024 Olympic Geographies - an activity
 
Pharmacognosy Flower 3. Compositae 2023.pdf
Pharmacognosy Flower 3. Compositae 2023.pdfPharmacognosy Flower 3. Compositae 2023.pdf
Pharmacognosy Flower 3. Compositae 2023.pdf
 
call girls in Kamla Market (DELHI) 🔝 >༒9953330565🔝 genuine Escort Service 🔝✔️✔️
call girls in Kamla Market (DELHI) 🔝 >༒9953330565🔝 genuine Escort Service 🔝✔️✔️call girls in Kamla Market (DELHI) 🔝 >༒9953330565🔝 genuine Escort Service 🔝✔️✔️
call girls in Kamla Market (DELHI) 🔝 >༒9953330565🔝 genuine Escort Service 🔝✔️✔️
 
The Most Excellent Way | 1 Corinthians 13
The Most Excellent Way | 1 Corinthians 13The Most Excellent Way | 1 Corinthians 13
The Most Excellent Way | 1 Corinthians 13
 

Session 6 free movement of persons ii freedom of establishment (

  • 1. SESSION 6: FREE MOVEMENT OF PERSONS II: FREEDOM OF ESTABLISHMENT (art. 49 TFEU) Reading assignments to be defined. Bibliography: H. BRONCKHORST, Freedom of Establishment and Freedom to Provide Services under the EEC Treaty, Common Market Law Review, 12 (1975), p. 245-253. K. ENSING SORENSEN, The fight against letterbox companies in the internal market, Common Market Law Review, 52 (2015), p. 85-117. A.Th.S. LEENEN, Recent case law of the Court of Justice of the European Communities on the freedom of establishment and the freedom to provide services, Common Market Law Review, 17 (1980), p. 259-268. O. MORSDORF, The legal mobility of companies within the European Union through cross-border conversion, Common Market Law Review, 49 (2012), p. 629-670. W. VAN GERVEN, The right of establishment and free supply of services within the Common Market, Common Market Law Review, 3 (1966), p. 344-362. G. VIEIRA DA COSTA CERQUEIRA, Libre circulation des sociétés en Europe: concurrence ou convergence des modèles juridiques, RTD Eur. janv.-mars 2014, p. 7-38. P. WATSON, Freedom of establishment and freedom to provide services: Some recent developments, Common Market Law Review, 20 (1983), p. 767-824. Running Head: JD SPORTS FASHION PLC 1 JD SPORTS FASHION PLC 20
  • 2. Evaluating JD Sports Fashion Financial Strategy Institution Student’s Name Background JD sports fashion plc is one of the reputable fashion in the UK. JD sports fashion plc trace back to 1981, founded by John David from a single store in bury, and currently operates more than 12,300 stores including its retail fascia’s and provide more than 30,000 direct employment. The rapid expansion of its retail s store is largely influenced by it management resilient for continuous acquisition of a strategic business in the business. the current executive chairman is Peter Cowgill. JD fashion opened its doors in London in 1989. A notable milestone in the history of JD was the flotation of its stock in the London stock market in 1996 (London stock exchange, 2018). The major market for JD sports fashion is currently in UK Ireland , but currently intensifying operation in 15 different country majority in Europe. Since 2005, the majority of the JD sports fashion plc shares are owned by Pentland group (JD sports fashion plc, 2018). With expanding demand influenced by a growing taste for sportswear, JD found it easy to penetrate them in the UK market.
  • 3. Considering the high competition in the industry from both local and international brands 0JD fashions plc presented itself as a provider of exclusive unique products that meet the growing stylish need from the UK customers. By collaborating with already established brands such as Nike Puma and Reebok, JD fashion created an image of innovativeness and centered toward the stylish need of the consumers (JD sports fashion plc, 2018). JD fashions have created a reputation as a provider of high-quality premium products from the recognized brands. In an attempt to improve its competitiveness, and acquire synergy to venture into the global market JD fashions management has in the past implemented various strategies aimed at penetrating the market outside the UK. During the first two decades, JD growth was accelerated through increasing its sale revenue from its established stores. After 2000, JD fashions experienced a rapid growth influenced by the corporate strategy of acquisition. In its distribution strategy, JD sports fashion primarily rely on retail sales supplemented with wholesale and its multi-channel model. Through it, multi-channel customers are able to access its products through its sales website, mobile phone apps and another online store. A major development in JD fashion plc Since the established of JD sports fashion, its management has taken various action that set the current success of the corporation. One of the notable steps was in 2002 when the organization managed to acquire the first sport, adding close to 200 stores in its portfolio. Later in 2004, JD fashion acquired Scotts and bank fashion, that saw the introduction of an innovative fascia brand that targets the young consumers (JD sports fashion plc, 2018). In the same year, in a move that saw JD fashion becoming one of the largest fashion industries in the UK was the acquisition of AllSports providing an additional 70 stores in its portfolio. Later on, the organization intensified its acquisition providing it with an opportunity to venture into the foreign market. For
  • 4. instance, the acquisition of Chausportin France provided the organization with additional synergy to penetrate the French market. After the acquisition of Chausportin, JD fashion acquired the ownership of the Canterbury of New Zealand rugby brands. In the past five years, the fashion industry in the UK and the global market has experienced some tough challenge. In order for JD fashions to remain competitive, the management has maintained an innovative approach in the operation of JD. One of the measures is by ensuring that it maintains market research as an ongoing process in order to actively monitor its rivals and evaluate consumers trends. In 2016, one notable management decision was the acquisition of the multi-brand sports fashion in Malaysia. The acquisition provided an opportunity to venture in the Malaysian economy and more, intensify its online sales by gaining control of its trading website (JD sports fashion plc, 2018 in the same year, JD fashion opened its first fascia store in Portugal through the acquisition of 80% share issued by Sportlberica Sociedade, providing 12 stores into its portfolio. Flexing its muscles in the Australian market the organization acquired an 80% share in next athleisure Pty Limited providing additional 32 stores and a trading website (JD sports fashion plc, 2018). The acquisition in Malaysia followed by that in Australia in 2017, expressed the JD sports fashion plc ambition to venture outside the European market. Moreover, the acquisition of going outdoors is an expression of the organization commitment to expands its market share through acquisition of key rivals in the industry and provide synergy to penetrate another region (Competition & Markets Authority, 2017). . Current JD sports fashions plc markets segments and retail outlets The table below provides a summary of the fascias store held by JD fashions and its respective subsidiaries in the year
  • 5. 2016 and 2017. JD United Kingdom and Republic of Ireland Other European countries JD in Asian countries Stores by the brand size? Cahusport (france) Sprinter Sur Austarian market 2016 361 103 1 36 72 104 0 0 2017 369 157 3 37 75 119 164 32 Table no1: data compiled from JD sports annual financial report 2018 The table above indicates the number of store outlet management by JD sports fashion in the UK and another market segment which indicated a significant increase in each market. JD sports fashion in collaboration with its subsidiaries offers a wide range of products. Some of the products in its portfolio include shirts, jackets, swimwear and footwear. Among its
  • 6. multiple channels, the retail stores account for the highest level attaining an 80% of the total revenue gain. The second is the multichannel attaining 16% with wholesale revenue accounting for 4% of the total revenue gain. Stock market performance analysis for JD stock Various analyst forecast that JD fashion will continue to perform well in the near future. Reflecting on its historical performance the organization has produced results above average in the last five years. Currently, JD sports fashion plc has a market capitalization of approximately 3,751.81 million pounds (London stock exchange, 2018). Comparing the dividend issue in 2017 and 2018, a slight improvement of 5.2% existence on the divided payable per ordinary shares. On the other hand, adjusted earning per rose by 32% from the previous 19.04% in 2017 to 25.15% in 2018. While the basic earnings for the ordinary shareholders increased by 30% up to 23.83 per share from 18.33p in 2017. However, although JD shares have experienced growth its dividend rise has remained relatively low influenced by the management decision to restrain dividend increase to finance its invents. Early in 2014, the stock value of JD sports fashion was rising consistently having risen from price 282 by the end of October 2013 and closed and the estimated price of 507 by 31st December 2014 (London stock exchange, 2018). In the year 2015, its share value continued to rise at and closed at price 1041.01 by 31st December 2015 (London stock exchange, 2018). The value continues to rise drastically reaching the highest point within the five years at 1574.6 in October and sharply declining at the beginning of December same year to its five years lowest at price 319 pounds. In the last one month, JD sport fashion shares have considerable declined up from 460 at the beginning of September and declining to 387.8 by the close of 22nd October this year (London stock exchange, 2018). On the other hand, despite the increasing profitability for the JD
  • 7. fashions plc, dividends payout to the shareholders increased slightly as summarized in the table below Financial year Eps Dividend cover Dividends per share Dividend per share growth 2014 4.13 3.05 1.36 - 2015 5.41 4.99 1.41 4.6% 2016 10.03 6.78 1.48 4.06% 2017 18.38 12.25 1.5 1.35% 2018 23.83 14.62 1.63 6.62% Table no2: data compiled from the London stock exchange (2018) Financial performance in the last five years To obtain a clear view of the financial performance of the
  • 8. company a summary of the key financial particular for JD sports fashion plc from 2014 to 2018 is outlined in the table below Particular 2014 2015 2016 2017 2018 Revenue (million pounds) 1330 1522 1822 2379 3161 Operating profit 60 93 133 240 296 Net profit 57 68 98 179 232 Current assets 329 400 510 714 971 Total assets 599 681 791
  • 9. 1178 1626 Current liabilities 285.65 326 384 535 682 Total liabilities 339.8 365 408 626 855 Total equity 272.84 309 400 578 834 Table no3: data adapted from JD sports fashion financial plc statements 2013-2018 JD fashion mainly generate its revenues in the UK, with other European countries following but only a few from the rest of the world as shown in the table below Region Percentage revenue United Kingdom 70% Europe 28% Rest of the world 2% Table no4: data adapted from JD sports fashion financial plc statements 2013-2018 A fact worth noting is that 79% of JD Fashions revenue is
  • 10. generated through its retail stores, followed by multichannel outlets at 14% and only 7% of the revenue generated through wholesale. The fact that JD fashion plc distribution channel directly deal with the consumer eliminating intermediaries increase its profit margin. The elimination of intermediary as a strategy helps to reduce the cost of their products. The sales growth has been consistently increasing in the last five years as presented in the table below Year Gross revenue (million pounds) Gross profit (million pounds) Gross revenue percentage change 2014 1330 592 - 2015 1522 739 25.15 2016 1822 884 19.67 2017 2379 1163 30.58 2018 3161 1549 32.9 Table no5: data adapted from JD sports fashion financial plc statements 2013-2018 The company revenue has consistently increased in the last four years, moving from 592 million pounds in 2014 to 1549 million
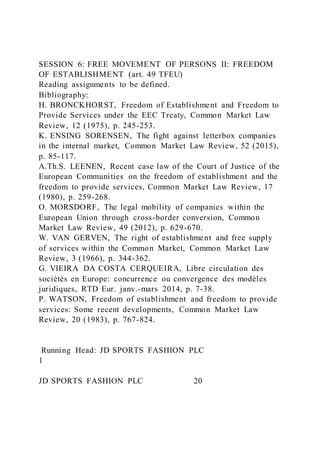
  • 11. pounds by the end of 2018 financial year. Graph no1: Data compiled from JD sports fashion financial plc statements 2013-2018 The graph above demonstrates the revenue growth in JD sports and fashion plc from the year 2013 to 2018 Financial analysis JD sports fashions for the last 5 years Financial performance of an organization provides an essential knowledge of the effectiveness of the strategy adopted by the organization. By conducting a brief financial analysis of JD fashions plc provide essential information on the financial status of the company. Inventory turnover To get a better view on how the strategies used by JD sports fashion assist in enhancing efficiency in utilization of the organization assets. The table below present JD fashions turn over and cost of good figures in the last five years and 2015 as the base year. Year Cost of good in million pounds Inventory million pounds Inventory ratio 2014 624.220 186 3.03 2015 782.703 225 3.808 2016 937.431 238 4.561 2017 1215.053
  • 12. 348 5.91 2018 1629.8 478 7.93 Table no6: data adapted from JD sports fashion financial plc statements 2013-2018 Thus, in 2015 the opening inventory was 186 million and ended at 225 million pounds. Average inventory is 205.5 million pounds in 2015 when the cost of good was equal to 782,703 million pounds. Basing the inventory turnover on the average turnover in 2015, it is evident that the rate at which JD sports fashion replenish its stock continue to improve. JD fashion replenishes its stock more than three times per year. The increase in inventory turnover accompanied by increasing inventory is an indication of effective inventory management. Receivable turnover Obtained by dividing the JD sports fashion plc net income by average receivable. Year Receivable turnover 2014 56.31 2015 94.06 2016 70.36 2017 32.55 2018 21.61 Table no7: data adapted from JD sports fashion financial plc statements 2013-2018 The rate at which the revenues were totally collected from
  • 13. receivable accounts decreases drastically from 2014 at 56.31 to 21.61 times annual. The decreasing receivable collection rate may signal that JD sports fashions plc may have relaxed its stringent policy of debt collection. Profitability ratio Year Gross income (million pounds) Ebit (million pounds) Net income. (million pounds) Net profit margin (%) Gross profit margin (gross/net) Operating profit (million pounds) Operating profit margin (operating/net) Total assets. (million pounds) Return on assets (net income/total asset) Total equity. (million pounds) Return of equity (net income/equi ty) 2014 592 - 57 9.6% 10.37 77.8 - 600 9.5% 273 20.87% 2015 739 99 68 9.2% 10.81 92.64
  • 15. 5.33 1,636 14.18% 834 27.82% Table no8: data adapted from JD sports fashion financial plc statements 2013-2018 On the profitability ratios, in the last five years, the company gross profit margin ranges from 10.87 to 6.4. The ratio has consistently decreased from 10.37 in 2014 to 6.67 in the JD sport financial year 2018. The decreasing margin indicates that the proportion of income spent on the purchase of goods is consistently improving. The improvement may be attributed to improved competitiveness and associated with economies of scale enjoyed by JD sports fashion plc. On net profit margin, JD sports fashion continue to improve considering that in 2014 the margin was at 9.2 and has risen with more than 5% attaining 14.9% in 2018 financial year. Current ratio By calculating the JD sports fashion plc current ratio, a clear view on the company liquidity strength. The current ratio is obtained by dividing JD sports fashion current asset with liabilities. Financial year Current asset. (million pounds) Current liabilities. (million pounds) Current ratio (current asset/current liabilities) 2014 330 286 1.153 2015 400 327 1.22 2016
  • 16. 511 348 1.47 2017 714 535 1.33 2018 972 682 1.42 table no9: data adapted from JD sports fashion financial plc statements 2013-2018 Considering the current ratio performance for JD sports fashion plc in the past five years is relatively healthy with a ratio above one. Though the current ratio is not consistently stable in each year it is evident that if JD sports fashion undergoes liquidation its current asset will fully offset its current liabilities. Debt-to-assets ratio Financial year Total liabilities. (million pounds) Total assets. (million pounds) Debt-to-assets ratio (liability/asset) 2014 327 600 54.5% 2015 373 683 54.61% 2016 390.471 793 49.22%
  • 17. 2017 600.094 1178 50.9% 2018 801 1,636 48.96% table no10: data adapted from JD sports fashion financial plc statements 2013-2018 In 2014 and 2015, the solvency ratio for JD sports fashion plc indicate that more than 50% of its assets were financed by debts. Although the ratio decreased, the dependence on liabilities remained relatively high at 50.9% and 48.96% in 2017 and 2018. Debt-to-equity ratio Financial year Total asset. (million pounds) Equity. (million pounds) Debt-to-equity ratio (debt/equity) 2014 600 273 2.91 2015 683 310 2.2 2016 793 401 1.97 2017 1178 579 2.03
  • 18. 2018 1,636 834 1.96 Table no11: data adapted from JD sports fashion financial plc statements 2013-2018 As indicated in the table above JD sports debt-to-equity ratio is relatively high, ranging between 1.96 to 2.97. Thus, in the case of liquidation, its shareholder equity is capable of clearing the total debts of the company. Swot analysis · Holding of various trademarks ensure that JD sports fashion plc provide an exclusive range of products to their customers and hence presenting unique and appealing products to its customers. Moreover, the diverse range of brands enables JD sports fashion to provide exclusive and unique products and thus position itself more competitive in the market compared to its rivals. · The existence of a centralized warehouse whose operations are highly automated provide additional benefits of increasing operational efficiency as well as reduced cost of operations. · The sale trends in JD fashion plc are influenced by seasonal consumption trends with peaks period around major annual celebrations. Christmas and Easter holidays are the most important peak seasons that greatly influence the organization annual turnover. If the shopping trends around the key holidays do not favour the JD sales it may lead to excess inventory that may pose a challenge for the organization to clear in the offpeak period. · Another weakness is its high dependence on third party suppliers of the brand products. An alternative to reduce overdependence is by either to own or acquire exclusive licensing. Depending solely on third-party suppliers increase
  • 19. risk exposure if JD sports fashion loses its key suppliers. Moreover, overdependence of the retail sales on the brand product provided by the third party provide the suppliers with a stronger bargaining capability. · JD sports fashion market is not quite diversified with more than 80% of its revenue depending on the UK market alone. · Continuous acquisition of competitive brands in international markets provide opportunities to venture into international markets. The expansion provides an opportunity to enjoy economy and scale and improve bargaining powers from its suppliers. · Considering that the European countries are the primary market for JD sports fashion with this particular market segment controlling more than 80% of the company sale, Brexit in early 2019. The fact that the majority of the brand's products are sourced outside the UK market exposed the JD sports fashions to currency exchange shocks, logistics challenges and different legal standards Evaluation of JD sports fashion growth drivers. after the organization first hit a 100 million pounds in profit in 2015, the company profit level has grown wi th over 200 million pounds. Registering a rise of more than 200% in the consecutive three years. one of the strategies attributed to the organization revenue growth is consistent innovation in the product offered by JD sports fashion. The corporate combine various products from various reputable brands. On the other hand, investment through acquisition has made the corporate broader. For instance, athleisure a subsidiary of JD sports fashion in Australia provides trend imports and streetwear for youth and young adults from local and foreign brands such as nude Lucy, Kappa and Superga. Secondly, JD sports fashions have increased its investment
  • 20. in technology aimed at increasing service delivery and customer satisfaction. Increased technological used has improved service delivery as well as meeting the dynamics need of the consumers. The ability for customers to order their products online provide consumers with a convenient way to order JD sports fashion products. The success of the JD sports fashion in the venturing into the international market provides a platform for expanding its multichannel model and guarantee increase sale in future from the accessible global market. The increased popularity in the use of mobile apps and reliance on social media platform provide access to JD fashion products and hence increase organization sales from in-store (JD sports fashion plc, 2018). An additional benefit for using the online platform is that it provides customers with an opportunity to exclusive products that are not readily available in the organization stores (Grawel & Levy, 2015). By combining both digital and physical store retail the organization provides a convenient platform for the consumers to conduct sopping across the multichannel. Another key driver of JD sports fashion growth is its online market model, through the acquisition the JD sports have to acquire control of online marketing websites in both domestic and foreign market. In collaboration with recognized brands in the apparel industry. The fact JD sports retail its product directly to the consumers enabled the organization to take control of its market and accelerate organic growth (Grawel & Levy, 2015). To overcome competition and remain appealing the JD sports fashion has maintained its resilience in increasing new global brand suppliers. Increasing the brand portfolio provide a competitive advantage to the organization by ensuring that the organization products retaining their uniqueness and hence more appealing. Moreover, the JD fashions clearly differentiate their store compared to their major rival in the market to ensure that they remain unique and appealing for the shoppers (Grawel & Levy, 2015). JD sports fashions consider the action of partnering with the third-party brands as critical in organization
  • 21. expansion. The management of JD sports ensures that the company stores main world-class standards as a strategy of increasing traffic to the showrooms. Within the past five years, the group has aggressively expanded its physical stores in both the UK and foreign countries. Combining both spaces and a wide range of exclusive products the organization has managed to improve the frequencies of customers in their stores. For instance, the opening of 20,000 sq. ft. In Liverpool, one in 2017 and 17,000 sq. feet in Arnade, Manchester the same year is a clear expression of the organization commitment in providing a unique shopping experience and exclusive products (JD sports fashion Plc annual report and accounts 2018). Conclusion By evaluating the financial performance of JD sports fashion in the past five years it's clear that the management has managed to maintain a high competitive ability for the company. The restrained dividend payout despite the increasing profit indicates the management resilence in expanding its market coverage through acquisition. Despite the huge capital investment as in various acquisition JD sports fashion liquidity ratio has remained relatively strong as indicated by its debt-to- equity ratio. The future of performance of JD sports fashion plc remains promising basing on the aggressive market expansion in more than ten worldwide. Moreover, the improving global economy may slightly increase the profitability for the apparel industry (Nenni, Giustiniano & Pirolo, 2013). As forecasted by Deloitte (2018), the fact that European countries to be among the top consumers of premium apparel brands will provide will increase the organization profitability and venture into other viable global markets. The favorable exchange rate is expected to promote international consumption (Nenni, Giustiniano & Pirolo, 2013). However, the Brexit uncertainty continues to pose a challenge for the UK based multinational organization accompanied by
  • 22. raising the cost of apparel produced pushed by increasing cost of raw materials and labor regulations (Nenni, Giustiniano & Pirolo, 2013). References Annual report & accounts 2017. https://www.companyreporting.com/sites/default/files/annual - report-index/JD_sports_fashion_plc-annual-report-2017.pdf Competition & Markets Authority (2017). Complete acquisition by JD sports Fashion Plc of Go Outdoors Topco Limited. A decision on the relevant merger situation and substantial lessening of competition. https://assets.publishing.service.gov.uk/media/5937dd12ed915d 20fb0001a3/JD-sports-go-outdoors-decision-160517.pdf Deloitte (2018). Global powers of luxury goods 2018.: shaping the future of the luxury industry. https://www2.deloitte.com/content/dam/Deloitte/global/Docume nts/Consumer-Business/cb-global-powers-luxury-goods- 2018.pdf Grewal Dhruv & Levy Michael (2015). Marketing, fifth edition, McGraw-Hill Education JD Sports Fashion Annual report and Accounts 2018. https://www.JDplc.com/~/media/Files/J/JD-Sports-Fashion- Plc/reports-and-presentations/2018-annual-report-v1.pdf JD Sports Fashion Plc (2018). History. https://www.JDplc.com/company-information/history.aspx London stock exchange (2018). JD SPORTS FASHION PLC ORD 0.25P. https://www.londonstockexchange.com/exchange/prices-and- markets/stocks/summary/company- summary/GB00BYX91H57GBGBXSTMM.html Nenni e. Mari, Giustiniano L. & Pirolo l. (2013). Demand forecasting in the fashion industry: A review. https://iris.luiss.it/retrieve/handle/11385/76460/1076/InTech- Demand_forecasting_in_the_fashion_industry_a_review.pdf
  • 23. Gross profit in millions of UK pounds 2013 2014 2015 2016 2017 2018 1258.9000000000001 1216.4000000000001 739550 884221 1163641 1531600