
Recommended
Recommended
More Related Content
Similar to K498594.pdf
Similar to K498594.pdf (20)
More from American Research Journal of Humanities & Social Science
More from American Research Journal of Humanities & Social Science (20)
Recently uploaded
Recently uploaded (20)
K498594.pdf
- 1. American Research Journal of Humanities Social Science (ARJHSS)R) 2021 ARJHSS Journal www.arjhss.com Page | 85 American Research Journal of Humanities Social Science (ARJHSS) E-ISSN: 2378-702X Volume-04, Issue-09, pp-85-94 www.arjhss.com Research Paper Open Access DETERMINANTS OF STUDENTS SATISFACTION UNDER THE IMPACT OF THE COVID-19 PANDEMIC Duc AnhDUONG1 1 Lecturer, Department of Foreign Languages, Vinh University, Vietnam. Abstract: The emergence of the Covid pandemic has changed the way the world education system works. Most of the affected countries are forced to make the transition from face-to-face learning to online, which contributes to create new opportunities and challenges for university institutions and public schools. Distance learning is a popular form in many countries, but in Vietnam, before the Covid pandemic, this was quite new, and was only applied at a few universities, and the number of distance learning students make up a small percentage of the total student population in the country. However, social distancing and the increase in the number of infected cases leave educational institutions with no other choice, from primary school to graduate school, to close school and implement online learning activities. For a country that attaches great importance to education like Vietnam, coupled with an intense competition between schools, student satisfaction becomes increasingly important. This study uses qualitative combined quantitative research methods, uses SPSS 26 software to analyze data obtained from a survey of over 350 students and students on the factors affecting satisfaction in online learning under the influence of the Covid pandemic. Research shows that course design, technology quality, teacher quality and student interaction are four factors that directly affect student satisfaction. Keywords:Course design; Technology quality; Teacher‘s quality; Student‘s interaction; Student‘s satisfaction. I. Introduction Covid-19 appeared at the end of December 2019 in the city of Wuhan, and quickly spread to other localities of this country(Chahrour et al., 2020). The Wuhan city government quickly sealed off the city on January 23, 2020 to minimize the spread of this virus (Xiang et al., 2020) But within a few weeks, the virus had spread to many other countries around the world and became a global pandemic that caused many countries to declare national emergency and blockade their countries. As of July 31, 2021, there were 197 million cases of infection worldwide, 4.2 million deaths, and in Vietnam.141 thousand people were infected. In Vietnam, up to the time of the pandemic, the implementation of distance learning was a peripheral. In 2016, only 2% (33,638) of the total student population were distance learning students (1,581,227). This is because Vietnam is still cautious about online teaching (Pham & Ho, 2020). Under the influence of the pandemic, distance teaching has become a must. As of April 8, 2020, all 63 provinces and cities have allowed students to stay at home. The immediate transition to a new form of teaching presents many challenges and opportunities for educational institutions, teachers and students. On the bright side, it is possible that the teaching process will become more effective, less stressful (Butnaru, Niță, Anichiti, & Brînză, 2021)when students are more comfortable expressing their own opinions (Lieu, 2020), although many students(Butnaru et al., 2021; Lieu, 2020) also consider lack of interaction (Ocak, 2020), or lack of feeling part of a community(Song, Singleton, Hill, & Koh, 2004), technical problems(Song et al., 2004), inexperienced teachers, different learning environments at home(Yang & Cornelius, 2004) are some of the weaknesses. In the face of new opportunities and challenges that online teaching brings, the study of student satisfaction would be helpful for the embrace of online learning in Vietnam after Covid. In recent time, student satisfaction has become a topic of interest to many scholars around the world. In the context of the Covid pandemic, most studies have focused on factors such as information systems, course design, teachers and students and many have reached an agreement that these factors have a direct influence to student
- 2. American Research Journal of Humanities Social Science (ARJHSS)R) 2021 ARJHSS Journal www.arjhss.com Page | 86 satisfaction. Specifically, it is the interaction between students, the interaction between school staff and students(Baber, 2020; Faize & Nawaz, 2020), ICT quality(Shehzadi et al., 2020), quality of transmission(Sharma et al., 2020), teacher support and encouragement(Fatani, 2020), student motivation(Basuony, EmadEldeen, Farghaly, El-Bassiouny, & Mohamed, 2020)structure coursework, classroom interaction(Baber, 2020), teacher effort and assessment(Aristovnik, Keržič, Ravšelj, Tomaževič, & Umek, 2020; Basuony et al., 2020; Ho, Cheong, & Weldon, 2021), feedback comments (Aristovnik et al., 2020) This study was conducted to determine the factors affecting the satisfaction of students and students in the context of online learning. By summarizing previous research results, the author has identified four main factors related to: teachers, learners, courses and technology. The study contributes to clarifying the impact model in Vietnam, specifically high schools and universities, thereby providing policy recommendations to further promote online learning activities in Vietnam. educational institutions in Vietnam. II. Literature Reviews and Hypotheses 2.1. Literature Reviews Student satisfaction ―Education will occupy a central place in a knowledge economy‖ (Peters & Humes, 2003). In the world, the competition between educational institutions is increasing, while in Vietnam university autonomy is a inevitable trend(Bui & Ta, 2019), student satisfaction is a key factorthat needs attention. Many studies have shown that student satisfaction has a positive effect on motivation, knowledge acquisition, as a result, more and more universities and higher education institutions improve the learning experience. and student satisfaction)(Elliott & Shin, 2002). Satisfaction of students means the feeling of favourability and preference when students evaluate issues related to education(Oliver, 1989). That satisfaction is formed and continuously shaped from the experiences they have at school. Research by Browne et al. (1998) shows that student satisfaction is shaped by their evaluations of the quality of courses and training programs. This study also shows that students' praise of their university is strongly influenced by their interactions with each other, and their contact with the team. teachers and staff of the school(Browne, Kaldenberg, Browne, & Brown, 1998) Course design Course design is the process and method of creating a quality learning environment for students to experience. Through systematic access to materials, learning, and interactions, students can acquire complex knowledge and skills that require higher-order thinking ("Capital University," 2021). A well-designed course allows more students to learn skills that require higher-level thinking and thus be more successful academically("Capital University," 2021). Course design plays an important role in student learning. If a student is given a systematically designed course, that student will be able to take a deeper approach and not learn in a superficial way(Wang, Su, Cheung, Wong, & Kwong, 2013). Teacher quality The Cambridge Dictionary defines quality as the distinctive quality possessed by a person or thing ("Quality," 2021). So with this definition, quality is equivalent to traits and characteristics. In The Quality School Teacher, Glasser argues that a quality teacher is a leader but not a boss, a professional who teaches useful skills, even those that are not part of the curriculum academically, know how to create a warm atmosphere, and do not put pressure on students (Glasser, 1993). The quality of teachers is the most important factor affecting what students can achieve (Rice, 2003). Accordingly, factors such as teacher experience, teacher qualifications and personal achievement have a positive influence on student achievement. (Rice, 2003). ICT quality Technology plays a huge role in education. Technology not only helps teachers improve teaching effectiveness, but also helps students improve learning outcomes (Tomei, 2005) There are many ways that technology can impact education, typically through apps, electronic devices, educational software and the Internet(Nikolić, Petković, Denić, Milovančević, & Gavrilović, 2019). For online classes, technology plays a decisive role in allowing learners and teachers to interact, and implement teaching activities. Must-have tools for online learning, such as Moodle, ATutor, Eliademy, Forma LMS. These are open systems that allow teachers to manage their students (Kc, 2017). Just like the importance of facilities, the tools that support online learning directly determine whether students can learn anytime, anywhere, easy or difficult access to the course, the functions of the software allow students to communicate freely like a normal classroom (or more). Interaction between learners Interaction between learners is often described as an activity that creates an opportunity to help develop online communities(Lee & Tsai, 2011)by which student learning is promoted (Milheim, 2004). The importance of
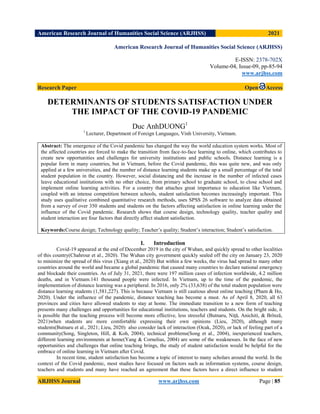
- 3. American Research Journal of Humanities Social Science (ARJHSS)R) 2021 ARJHSS Journal www.arjhss.com Page | 87 learner interaction is emphasized in the model of learning through social interaction(Moore, 1989), where students can learn from each other. Student interaction plays an important role in developing teamwork and coordination skills (Anderson, 2003)especially in the online environment. 2.2. Hypotheses 2.2.1. Course design and student satisfaction The criteria to design an effective online course is still an open issue(Jaggars & Xu, 2016). These two authors consider that the interaction between students and teachers is a criterion while designing the course. Evaluation of 23 online courses at two community colleges, and the results show that there is a positive relationship between courses with high quality of student-teacher interaction and student grades. Effective teacher-student interaction helps to create a motivating learning environment that encourage students to learn better and achieve higher results(Vai & Sosulski, 2011). Hypothesis proposed: H1: Course design has a positive impact on student satisfaction 2.2.2. Teacher quality and student satisfaction There are many studies that show that the quality of teachers has an impact on student satisfaction. A study of 350 Pakistani students assessing the factors: teachers' expertise, courses, learning environment, and classroom equipment shows that teachers' expertise is a factor that has the greatest impact on student satisfaction, out of all other variables (Butt & Ur Rehman, 2010). Research on graduate students at a university in Malaysia on their satisfaction with online courses indicates that communication with teachers plays an important role, some say they feel alone when learning online and requires direct contact with teachers(Hong, Lai, & Holton, 2003)Online courses combined with traditional mode bring in higher results when it comes to student satisfaction. Research on 21 engineering courses for undergraduates and graduate students shows that easy access to teachers is one of the many determinants of student satisfaction(Martínez-Caro & Campuzano-Bolarín, 2011).The following hypothesis is proposed: H2: Teacher quality has a positive impact on student satisfaction 2.2.3. Technology quality and student satisfaction Technology is also part of the service quality factor, which has a positive impact on student satisfaction (Meštrović, 2017). Technology quality affects student satisfaction according to criteria such as reliability, efficiency, ease of use, web design. Accordingly, the higher the Internet speed, the more user-friendly the system, and the easier to access resources, the higher the satisfaction (Al-Shamayleh et al., 2015; Ohliati & Abbas, 2019). In the process of interacting on the online learning system, students benefit from sharing ideas and knowledge, interacting with each other on lesson content through chat forums or video conferences (Ohliati & Abbas, 2019). Through that, student satisfaction depends on the utility of these systems. The following hypothesis is proposed: H3: Technology quality has a positive effect on student satisfaction. 2.2.4. Interaction with learners and student satisfaction The exchange helps students build knowledge, improve learning outcomes(Singh, 2005)and make significant progress in tests of essay writing skills(Nixon & Topping, 2001). However, research on PhD students at MIT shows that the link between interaction and academic performance is strongest in students with average academic performance, and weak in students with high academic performance. academic excellence(Hall, 1969). A study of 94 freshmen found that students who received high social support and low stress levels also had high life satisfaction (Coffman & Gilligan, 2002). Thus, this following hypothesis is propsed: H4: Interaction between learners has a positive impact on student satisfaction Course design Technology quality Teachers quality Students satisfaction H1 H2 H3 Students interaction H4 Figure 1: Research model
- 4. American Research Journal of Humanities Social Science (ARJHSS)R) 2021 ARJHSS Journal www.arjhss.com Page | 88 III. Research methodology To measure student satisfaction, in the context of the Covid pandemic that is forcing schools to close and teachers having to use online teaching systems, the author conducted a survey of 04 factors: quality of teachers, course design, interaction between learners, quality of technology over 350 students, students studying at high schools, and universities in Thanh Hoa, Nghe An, Ha Tinh by many research methods: theoretical research, survey by questionnaire, mathematical statistics and using SPSS software version 26 to process data. This study is based on previous studies by many authors, and especially the use of observed variables, such as the work ofSun, Tsai, Finger, Chen, & Yeh, 2008, Eom, Wen, & Ashill, 2006, Butnaru et al., 2021; Rice, 2003. Table 1:Independent, intermediate and observed variables Variable Indicator Code Source Course design The course content is presented logically TK 1 Sun, et al, 2008 Outcomes of the course are presented reasonably TK 2 The course materials are arranged in a logical sequence and are easy to understand TK 3 The course is designed to meet the knowledge needs that I need to learn TK 4 Technology quality I can access the course anytime, anywhere CN 1 Sun, et al, 2008 I don't face any technical problems while studying online CN 2 I have no difficulty communicating and exchanging information with the software I am using CN 3 I have no trouble submitting my assignments on the online learning system CN 4 Easy-to-use online learning system CN 5 Teacher quality Highly qualified teachers with many personal achievements GV 1 Butnaru, et al, 2021 Glasser, 1993 Teachers create a comfortable atmosphere when learning online GV 2 Teachers help improve students' abilities GV 3 Teachers are proficient in the use of technology in teaching GV 4 Teachers effectively convey knowledge through online courses GV 5 Interaction between learners I am willing to actively exchange online with my classmates TT 1 Butnaru, et al, 2021 I can work effectively in groups with my classmates TT 2 I feel comfortable talking to my friends through the online system TT 3 I have many opportunities to interact with my classmates when I study online TT 4 I learn many useful things when interacting with friends TT 5 Student satisfaction I feel satisfied with the whole online learning system HL 1 Sun, et al, 2008 Eom, et al, 2006 I will continue to study online in the future HL 2 Online learning helps me study independently HL 3 IV. Research results 4.1. Assess the reliability of the scale Performing the test for each individual scale, we all have high Cronbach - Alpha reliability coefficient, greater than 0.7, observed variables all have Corrected Item-Total Correlation coefficient greater than 0.3, so the scale reaches reliability requirements. Table 2: Cronbach – Alpha test for the scale Scale Mean if Item Deleted Scale Variance if Item Deleted Corrected Item-Total Correlation Cronbach's Alpha if Item Deleted TK1 10.72 5.36 0.585 0.754 TK2 11.34 5.319 0.621 0.736 TK3 11.39 5.287 0.631 0.731 TK4 10.78 5.351 0.585 0.754 CN1 12.54 9.544 0.679 0.818 CN2 11.88 9.754 0.562 0.847 CN3 12.51 9.311 0.694 0.813
- 5. American Research Journal of Humanities Social Science (ARJHSS)R) 2021 ARJHSS Journal www.arjhss.com Page | 89 CN4 13.35 8.744 0.701 0.811 CN5 13.38 9.009 0.686 0.815 GV1 15.55 8.317 0.652 0.811 GV2 15.55 8.351 0.689 0.799 GV3 15.71 8.824 0.676 0.803 GV4 15.78 8.468 0.681 0.801 GV5 15.8 10.185 0.562 0.834 TT1 13.37 8.915 0.6 0.837 TT2 13.87 8.708 0.674 0.819 TT3 13.82 8.765 0.674 0.819 TT4 13.87 8.563 0.712 0.809 TT5 14.59 7.864 0.672 0.822 Table 3: Cronbach's Alpha index for each variable Variable Cronbach's Alpha N of Items TK 0.795 4 CN 0.851 5 GV 0.842 5 TT 0.852 5 From the above results, we see that all factors have high Cronbach - Alpha reliability coefficient, which is eligible for exploratory factor analysis (EFA). 4.2. Exploratory Factor Analysis (EFA) Exploratory factor analysis (EFA) is a quantitative analysis method used to reduce a set of many interdependent measures into a smaller set of variables (called factors) so that they are significant. but still contains most of the information content of the original set of variables. The basis of this reduction is based on the linear relationship of the factors with the observed variables. The number of basis factors depends on the research model, in which they bind each other by rotating orthogonal vectors so that no correlation occurs. For a simple model with the participation of two types of variables: Independent and dependent, we will perform a separate factor analysis for independent and dependent variables. The analysis will use the extraction of PCA (Principal Componen) to reduce the number of observed variables to the factors that summarize the best information and according to the extraction criterion Eigenvalue greater than 1, and the Varimax rotation (due to the research model). only independent and dependent variables). Table 4: KMO and Bartlett test KMO and Bartlett's Test Kaiser-Meyer-Olkin Measure of Sampling Adequacy. 887. Bartlett's Test of Sphericity Approx. Chi-Square 2874.999 df 171 Sig. 000. Table 5: Total variance extracted Total Variance Explained Component Initial Eigenvalues Extraction Sums of Squared Loadings Rotation Sums of Squared Loadings Total % of Variance Cumulativ e % Total % of Variance Cumulativ e % Total % of Variance Cumulativ e % 1 5.779 30.414 30.414 5.779 30.414 30.414 3.311 17.428 17.428 2 3.233 17.017 47.431 3.233 17.017 47.431 3.200 16.844 34.273 3 1.637 8.616 56.046 1.637 8.616 56.046 2.900 15.261 49.534 4 1.476 7.769 63.815 1.476 7.769 63.815 2.713 14.281 63.815 5 665. 3.502 67.317 6 647. 3.403 70.720
- 6. American Research Journal of Humanities Social Science (ARJHSS)R) 2021 ARJHSS Journal www.arjhss.com Page | 90 7 622. 3.275 73.995 8 559. 2.942 76.936 9 523. 2.751 79.688 10 495. 2.607 82.295 11 470. 2.473 84.768 12 454. 2.387 87.155 13 394. 2.072 89.227 14 387. 2.038 91.266 15 368. 1.936 93.202 16 350. 1.843 95.045 17 345. 1.818 96.862 18 327. 1.722 98.584 19 269. 1.416 100.000 Extraction Method: Principal Component Analysis. Table 6: Rotation Matrix Rotated Component Matrixa Component 1 2 3 4 CN4 804. CN5 795. CN3 790. CN1 756. CN2 674. TT4 817. TT3 790. TT2 788. TT5 784. TT1 741. GV4 813. GV3 772. GV1 767. GV2 755. GV5 513. TK4 763. TK3 754. TK1 742. TK2 739. Extraction Method: Principal Component Analysis. Rotation Method: Varimax with Kaiser Normalization. a. Rotation converged in 5 iterations. First EFA result: KMO = 0.887 > 0.5, sig Barlett's Test = 0.000 < 0.05, so factor analysis to explore EFA is appropriate. There are 4 factors extracted with the criterion eigenvalue greater than 1 with a total cumulative variance of 63.815%. The results of the rotation matrix show that no bad variables are excluded, all observed variables have Factor loading greater than 0.5. EFA analysis for the dependent variable
- 7. American Research Journal of Humanities Social Science (ARJHSS)R) 2021 ARJHSS Journal www.arjhss.com Page | 91 Table 7: KMO and Bartlett analysis KMO and Bartlett's Test Kaiser-Meyer-Olkin Measure of Sampling Adequacy. 743. Bartlett's Test of Sphericity Approx. Chi-Square 568.097 df 3 Sig. 000. KMO coefficient = 0.743 > 0.5, sig Barlett's Test = 0.000 < 0.005, so factor analysis is appropriate. Table 8: Total variance extracted Total Variance Explained Component Initial Eigenvalues Extraction Sums of Squared Loadings Total % of Variance Cumulative % Total % of Variance Cumulative % 1 2.431 81.027 81.027 2.431 81.027 81.027 2 315. 10.487 91.515 3 255. 8.485 100.000 Extraction Method: Principal Component Analysis. The analysis results show that there is 1 factor extracted at eigenvalue equal to 2.431 > 1. This factor explains 81% of the data variation of the three observed variables involved in EFA. Because only one factor is extracted, the rotation matrix is not displayed, the author evaluates the results of the unrotated matrix table. Table 9: Rotation Matrix Component Matrixa Component 1 HL1 907. HL3 906. HL2 887. Extraction Method: Principal Component Analysis. a. 1 components extracted. The results show that 3 observed variables converge to 1 column, and all observed variables have factor loading coefficients greater than 0.5. Table 10: Statistics of final EFA analysis results Statistical results of the final EFA analysis of the dependent variable Factor Observed variables Element Name 1 HL1, HL2, HL 3 Satisfaction KMO coefficient = 0.743 > 0.5 Bartlett's Sig = 0.000 < 0.005 Total variance extracted from a factor = 81.027% 4.3. Evaluation of the fit of the multiple regression linear model To explain the variation of the dependent variable, we use the coefficient R2 , a higher the value of R2 is an indication that the relationship between the dependent and independent variable is stronger. Table 11: Linear Model Model Summaryb Model Summaryb Model R R Square Adjusted R Square Std. Error of the Estimate Durbin-Watson 1 .735a 540. 534. 44153. 1.757 a. Predictions: (Constant), Learner interaction, Technology quality, Course design, Teacher quality b. Dependent variable: Student satisfaction The R2 of this model is 0.534 > 0.5 ie 53.4%, which is the variation of student satisfaction about the quality of educational services explained by the linear relationship between the independent variables. The model is appropriate. To consider whether it can be applied in practice, the author conducts a model fit test. Check the fit of the model
- 8. American Research Journal of Humanities Social Science (ARJHSS)R) 2021 ARJHSS Journal www.arjhss.com Page | 92 Table 12: ANOVA . Analysis ANOVAa Model Sum of Squares Df Mean Square F Sig. 1 Regression 78.846 4 19.712 101.113 .000b Residual 67.257 345 195. Total 146.103 349 a. Dependent Variable: Student Satisfaction b. Predictors: (Constant), Learner interaction, Technology quality, Course design, Teacher quality Sig value. the F value of this model is very small (<0.05 significance level), thus hypothesis H0 is rejected. The model fits the data set and can be generalized to the whole population. Table 13: Coefficients Coefficientsa Model Unstandardized Coefficients Standardized Coefficients t Sig. Collinearity Statistics B Std. Error Beta Tolerance VIF 1 (Constant) 263. 171. 1.537 125. Course design 063. 037. 073. 1.696 091. 725. 1.380 Technology quality 076. 037. 088. 2.076 039. 737. 1.357 Teacher quality 351. 039. 395. 9.025 000. 697. 1.435 Interaction between learners 390. 035. 433. 11.157 000. 884. 1.131 a. Dependent Variable: Sự hài lòng sinh viên The criterion of Collinearity diagnostics with the variance magnification factor (VIF) of the independent variables is < 2, the multicollinearity of the independent variables is not significant, so the variables in the model are accepted. Finally, the Durbin Watson coefficient used to test the first-order series correlation shows that the model does not violate when using the multiple regression method because the obtained value is 1,757 (close to 2) and accepts the null hypothesis. first-order series correlation in the model. Thus, the multiple regression model satisfies the evaluation and suitability test conditions for drawing research results). Based on the standardized Beta coefficient, the following regression equation is built as follows: Evaluation results = 0.263 + 0.63*course design + 0.076*technology quality + 0.351*teacher quality + 0.390*student interaction. The above regression equation shows that the factors of Course design, Quality of technology, Quality of teachers, Interaction of learners, show independent variables. have a positive impact on student satisfaction. This result confirms that the hypothesis stated in the research model (H1-H4) is accepted. The study also shows that the factor that has the biggest influence on student satisfaction is the course design. Factors such as lectures are presented logically, easy to understand, clear and appropriate output standards to meet the knowledge needs of learners are very important. Second, the interaction between learners is a very important factor, affecting the satisfaction of students and students. Online learners often need a secure online learning environment that allows them to exchange and interact easily and effectively. V. Conclusion The measurement results show that 4 factors affecting student satisfaction during online learning under the influence of the Covid-19 pandemic are course design, teacher quality, and quality. technology, and interaction between learners. This conclusion is consistent with previous studies by Anderson, 2003; Jaggars & Xu, 2016; Lee & Tsai, 2011; Moore, 1989; Vai & Sosulski, 2011. This study hopes to be the basis for educational institutions to
- 9. American Research Journal of Humanities Social Science (ARJHSS)R) 2021 ARJHSS Journal www.arjhss.com Page | 93 develop innovative measures to promote educational service activities in line with the educational development trend in the coming time to meet increasing expectations of students and students. References [1]. Al-Shamayleh, H., Aljaafreh, R., Aljaafreh, A., Albadayneh, D., Al-Ali, M., Bazin, N., Coulibaly, Y. (2015). Measuring the quality of E-services and its impact on students satisfaction at Jordanian universities. Journal of Theoretical and Applied Information Technology, 74(3), 274-285. [2]. Anderson, T. (2003). Getting the mix right again: An updated and theoretical rationale for interaction. The International Review of Research in Open and Distributed Learning, 4(2). [3]. Aristovnik, A., Keržič, D., Ravšelj, D., Tomaževič, N., & Umek, L. (2020). Impacts of the COVID-19 pandemic on life of higher education students: A global perspective. Sustainability, 12(20), 8438. [4]. Baber, H. (2020). Determinants of students‘ perceived learning outcome and satisfaction in online learning during the pandemic of COVID-19. Journal of Education and e-Learning Research, 7(3), 285-292. [5]. Basuony, M. A., EmadEldeen, R., Farghaly, M., El-Bassiouny, N., & Mohamed, E. K. (2020). The factors affecting student satisfaction with online education during the COVID-19 pandemic: an empirical study of an emerging Muslim country. Journal of Islamic Marketing. [6]. Browne, B. A., Kaldenberg, D. O., Browne, W. G., & Brown, D. J. (1998). Student as customer: Factors affecting satisfaction and assessments of institutional quality. Journal of marketing for higher education, 8(3), 1-14. [7]. Bui, D. L., & Ta, V. A. (2019). University autonomy: Solution for Educational innovation in Vietnam. [8]. Butnaru, G. I., Niță, V., Anichiti, A., & Brînză, G. (2021). The Effectiveness of Online Education during Covid 19 Pandemic—A Comparative Analysis between the Perceptions of Academic Students and High School Students from Romania. Sustainability, 13(9), 5311. [9]. Butt, B. Z., & Ur Rehman, K. (2010). A study examining the students satisfaction in higher education. Procedia-Social and Behavioral Sciences, 2(2), 5446-5450. [10]. Capital University. (2021, 7 24). Capital.edu. Retrieved from https://www.capital.edu/academics/academic- offices/center-for-excellence-in-learning-and-teaching/about-course-design/ [11]. Chahrour, M., Assi, S., Bejjani, M., Nasrallah, A. A., Salhab, H., Fares, M., & Khachfe, H. H. (2020). A bibliometric analysis of COVID-19 research activity: a call for increased output. Cureus, 12(3). [12]. Coffman, D. L., & Gilligan, T. D. (2002). Social support, stress, and self-efficacy: Effects on students' satisfaction. Journal of College Student Retention: Research, Theory & Practice, 4(1), 53-66. [13]. Elliott, K. M., & Shin, D. (2002). Student satisfaction: An alternative approach to assessing this important concept. Journal of Higher Education policy and management, 24(2), 197-209. [14]. Eom, S. B., Wen, H. J., & Ashill, N. (2006). The determinants of students' perceived learning outcomes and satisfaction in university online education: An empirical investigation. Decision Sciences Journal of Innovative Education, 4(2), 215-235. [15]. Faize, F. A., & Nawaz, M. (2020). Evaluation and Improvement of students' satisfaction in online learning during COVID-19. Open Praxis, 12(4), 495-507. [16]. Fatani, T. H. (2020). Student satisfaction with videoconferencing teaching quality during the COVID-19 pandemic. BMC Medical Education, 20(1), 1-8. [17]. Glasser, W. (1993). The Quality School Teacher: ERIC. [18]. Hall, D. T. (1969). The impact of peer interaction during an academic role transition. Sociology of Education, 118-140. [19]. Ho, I. M. K., Cheong, K. Y., & Weldon, A. (2021). Predicting student satisfaction of emergency remote learning in higher education during COVID-19 using machine learning techniques. Plos one, 16(4), e0249423. [20]. Hong, K.-S., Lai, K.-W., & Holton, D. (2003). Students' satisfaction and perceived learning with a web- based course. Journal of Educational Technology & Society, 6(1), 116-124. [21]. Jaggars, S. S., & Xu, D. (2016). How do online course design features influence student performance? Computers & Education, 95, 270-284. [22]. Kc, D. (2017). Evaluation of moodle features at kajaani university of applied sciences–case study. Procedia computer science, 116, 121-128. [23]. Lee, S. W.-Y., & Tsai, C.-C. (2011). Identifying patterns of collaborative knowledge exploration in online asynchronous discussions. Instructional Science, 39(3), 321-347.
- 10. American Research Journal of Humanities Social Science (ARJHSS)R) 2021 ARJHSS Journal www.arjhss.com Page | 94 [24]. Lieu, C. X. (2020). E-learning turning lecturers to commentators Retrieved from https://etep.moet.gov.vn/tintuc/chitiet?Id=1328 [25]. Martínez-Caro, E., & Campuzano-Bolarín, F. (2011). Factors affecting students‘ satisfaction in engineering disciplines: traditional vs. blended approaches. European Journal of Engineering Education, 36(5), 473- 483. [26]. Meštrović, D. (2017). Service quality, students‘ satisfaction and behavioural intentions in stem and ic higher education institutions. Interdisciplinary Description of Complex Systems: INDECS, 15(1), 66-77. [27]. Milheim, K. L. (2004). Strategies for designing on-line courseware. International Journal of Instructional Media, 31(3), 267. [28]. Moore, M. G. (1989). Three types of interaction. The American Journal of Distance Education, 3. doi:https://doi.org/10.1080/08923648909526659 [29]. Nikolić, V., Petković, D., Denić, N., Milovančević, M., & Gavrilović, S. (2019). Appraisal and review of e- learning and ICT systems in teaching process. Physica A: Statistical Mechanics and its Applications, 513, 456-464. [30]. Nixon, J., & Topping, K. (2001). Emergent writing: The impact of structured peer interaction. Educational psychology, 21(1), 41-58. [31]. Ocak, M. (2020). What we learned about distance education during Covid-19. EPALE–Electronic Platform for Adult Learning in Europe. [32]. Ohliati, J., & Abbas, B. S. (2019). Measuring Students Satisfaction in Using Learning Management System. International Journal of Emerging Technologies in Learning, 14(4). [33]. Oliver, R. L. D., W.S. (1989). Processing of the satisfaction response in consumption: a suggested [34]. framework and research proposition. Journal of Consumer Satisfaction, Dissatisfaction and Complaining Behavior, 2, 1-16. [35]. Peters, M. A., & Humes, W. (2003). Education in the knowledge economy. In: SAGE Publications Sage UK: London, England. [36]. Pham, H.-H., & Ho, T.-T.-H. (2020). Toward a ‗new normal‘with e-learning in Vietnamese higher education during the post COVID-19 pandemic. Higher Education Research & Development, 39(7), 1327- 1331. [37]. Quality. (2021). Cambridge University Press. [38]. Rice, J. K. (2003). Teacher quality: Understanding the effectiveness of teacher attributes: ERIC. [39]. Sharma, K., Deo, G., Timalsina, S., Joshi, A., Shrestha, N., & Neupane, H. (2020). Online learning in the face of COVID-19 pandemic: Assessment of students‘ satisfaction at Chitwan medical college of Nepal. Kathmandu University Medical Journal, 18(2), 40-47. [40]. Shehzadi, S., Nisar, Q. A., Hussain, M. S., Basheer, M. F., Hameed, W. U., & Chaudhry, N. I. (2020). The role of digital learning toward students' satisfaction and university brand image at educational institutes of Pakistan: a post-effect of COVID-19. Asian Education and Development Studies. [41]. Singh, C. (2005). Impact of peer interaction on conceptual test performance. American journal of physics, 73(5), 446-451. [42]. Song, L., Singleton, E. S., Hill, J. R., & Koh, M. H. (2004). Improving online learning: Student perceptions of useful and challenging characteristics. The internet and higher education, 7(1), 59-70. [43]. Sun, P.-C., Tsai, R. J., Finger, G., Chen, Y.-Y., & Yeh, D. (2008). What drives a successful e-Learning? An empirical investigation of the critical factors influencing learner satisfaction. Computers & Education, 50(4), 1183-1202. [44]. Tomei, L. A. (2005). Taxonomy for the technology domain. In Taxonomy for the Technology Domain (pp. 89-108): IGI Global. [45]. Vai, M., & Sosulski, K. (2011). Essentials of online course design: A standards-based guide: Routledge. [46]. Wang, X., Su, Y., Cheung, S., Wong, E., & Kwong, T. (2013). An exploration of Biggs‘ constructive alignment in course design and its impact on students‘ learning approaches. Assessment & Evaluation in Higher Education, 38(4), 477-491. [47]. Xiang, Y.-T., Yang, Y., Li, W., Zhang, L., Zhang, Q., Cheung, T., & Ng, C. H. (2020). Timely mental health care for the 2019 novel coronavirus outbreak is urgently needed. The lancet psychiatry, 7(3), 228- 229. [48]. Yang, Y., & Cornelius, L. F. (2004). Students' perceptions towards the quality of online education: A qualitative approach. Association for Educational Communications and Technology.