SlideShare a Scribd company logo
1 of 18
Download to read offline
American Research Journal of Humanities Social Science (ARJHSS)R) 2021
ARJHSS Journal www.arjhss.com Page | 44
American Research Journal of Humanities Social Science (ARJHSS)
E-ISSN: 2378-702X
Volume-04, Issue-10, pp-44-61
www.arjhss.com
Research Paper Open Access
Identifying the Domains in Science, Reading and Mathematics in
which the U.S. High School Students Perform Lower in PISA.
OnderKoklu, Susan J. Cooper, C.DawnMartelli, Megan Atha
Florida Gulf Coast University
Abstract: The present study aimed to identify mathematics, science and reading item groups and
thespecification of items in which U.S. students have a significantly lower level of correct responses compared
toall other participants in PISA assessment. For this purpose, 269 items were analyzed by using
MultilevelMeasurement Models. Data were obtained from the results of 2015 and 2018 PISA administrations
released byOECD. Of the 269 items, 115 were Science,82 were Mathematics, and 72 were Reading items. All
269 itemswere grouped according to various content and cognitive domains. Then, these item groups were
analyzed byusing two-level linear measurement models via HLM-6 software with a measurement model using
both first andsecond level predictors for each of the three tests separately.Results of the study clearly indicated
that the U.S.students performed lower than international average on only one of the three item groups in
reading and only oneof the18 item groups in science. On the other hand, the U.S. students performed
significantly lower thaninternational average on five of the 12 item groups in mathematics.
Key words: Reading, Science, Mathematics, Student achievement, PISA, HLM
I. Introduction
Robust educational systems rely on accurate data to inform curricular and instructional decision-
making. Thus, comparative studies have long been conducted in order to measure the quality and effectiveness
of education provided to students all over the world (Kyriakides et al., 2020; Cai, et al., 2016; Vedder, 2020).
Educational policymakers, educators, and curriculum designers are able to identify strengths and weaknesses of
their educational systems by comparing their students` achievement levels with the students‟ achievement levels
in other countries (Hwang, et al., 2018; Klieme, 2020; Afdal, 2019). International studies such as TIMSS and
PISA provide good opportunities for educational policymakers, educational researchers and curriculum
designers in order to conduct these kind of comparative research studies (Nortvedt, 2018; Cordero et al., 2018;
Mullis et.al, 2009).
Achievement of the U.S. students in PISA and TIMSS has attracted the attention of researchers,
educators, policymakers, and the general public in recent years in the United States (Zhang &Bray, 2020; Elliott,
et al., 2019; Grabau&Ma, 2017; Han, 2017). Consequently, there is a growing body of research on factors linked
to achievement. Although effects of these factors on student achievement have been hypothesized and
investigated for the past two decades, few attempts have been made to systematically investigate how content
and cognitive domains are related to achievement. Thus, there are limited consistent and robust findings on
content and cognitive factors related to achievement.
With continuous improvement as a goal, the Organization for Economic Cooperation and Development
(OECD) developed the Programme for International Student Assessment (PISA) in 2000. PISA is an
international assessment administered to 15-year-old students every three years to measure reading,
mathematics, and science literacy as well as cross-curricular competencies, such as collaborative and creative
problem-solving (NCES, 2020).Through these foci, PISA has been designed measure how well students can
apply knowledge obtained both various learning contexts to real-world tasks as they are nearing the end of
formal schooling (Cogan et al., 2019; She et al., 2018).The most recent administration was conducted in
2018,and over 600,000 students participated across 79 countries (OECD, 2020).
American Research Journal of Humanities Social Science (ARJHSS)R) 2021
ARJHSS Journal www.arjhss.com Page | 45
Most PISA research focuses on domain-level differences across countries with analyses differentiating
for student characteristics such as gender and socioeconomic status (Cooper &Berry, 2020; Hwang &Yeo, 2020;
Thien, 2016; Teig et al., 2020). Additionally, research tends to also focus on how PISA results correlate to other
standardized measures such as the National Assessment of Educational Progress (NAEP) or the Trends in
InternationalMathematics and Science Study (TIMMS). While such work is important forinforming policy
reform, rarely do findings from such research inform instructionaldecision-making in U.S. classrooms. If U.S.
performance is to improve oninternational measures such as the PISA, a more thorough analysis of student
performance at the item-level is warranted. Such research is scant.
However, one recent study examined how spatial cognition as measured by the space and shape domain
related to overall performance on the mathematics portion of the test. Sorby and Panther (2020) analyzed trends
among high-performing countries and other countries of interest finding that success on PISA items is
significantly correlated with scores on tests of spatial cognition. The authors suggested improving spatial skills
could be an overlooked strategy for improving student performance on PISA (and by extension for improving
preparedness for life). More research that uses item-level analysis to inform instructional practices is needed.
Similarly, the present study aimed to identify mathematics, science and reading item groups and the
specification of items in which U.S. students have a significantly lower level of correct responses compared to
all other participants in PISA assessment. Considering the purpose, specific research questions are:
1. Considering content and cognitive domains, on which item groups do U.S. students perform statistically
significantly lower than students from other participant countries on the reading assessment?
2. Considering content and cognitive domains, on which item groups do U.S. students perform statistically
significantly lower than students from other participant countries on the science assessment?
3. Considering content and cognitive domains, on which item groups do U.S. students perform statistically
significantly lower than students from other participant countries on the mathematics assessment?
II. Method
The main objective is to identify specific item groups in which statistically significant differences exist
between the U.S. students‟ and other participants‟ science, mathematics and reading performances. For this
purpose, 269 items, which were released by OECD, were analyzed by using Multilevel Measurement Models via
HLM-6 software (Raudenbush, 2004). In the analysis of the data, the mean percent correct information for all of
the items were used on a continuous scale between 0 and 100. The same scale is used for open-ended questions.
Although open-ended items include partial credits, mean percent correct information represented the rates for
“full credit” responses. These percent correct rates also comprised the dependent variable of two level linear
hierarchical models.
2.1. Data
Program for International Student Assessment (PISA) is a measurement instrument developed and
administered by The Organization for Economic Cooperation and Development (OECD). PISA has been
administered worldwide since 2000 in three-year periods to measure 15-year-olds‟ ability to use their reading,
mathematics and science knowledge and skills to meet real-life challenges (OECD, 2019). Data from 269 items
were obtained from publicly provided results of 2015 and 2018 PISA administration released by OECD. Of the
269 items, 115 were Science, 82 were Mathematics, and 72 were Reading items.
2.2. Tests’ Frameworks
2.2.1. Science Assessment:
The science assessment framework for PISA-2018 is organized around three dimensions: a system
dimension specifying the domains of systems or subject matter to be assessed within science, a knowledge
dimension specifying the type of knowledge to be assessed and a competency dimension specifying the sets of
behaviors expected of students as they engage with the science content (Table-1). Distribution of total 115
science items can be seen in table-2 below.
American Research Journal of Humanities Social Science (ARJHSS)R) 2021
ARJHSS Journal www.arjhss.com Page | 46
Table 1. PISA Science Test System, Knowledge and Competency Domains
System Domain Knowledge Domain
Competency
Domain
(1) Living Systems
 Cells (e.g., structures and function, DNA,
differences between plant and animal cells)
 The concept of an organism (e.g., unicellular vs.
multicellular)
 Humans (e.g., health; nutrition; subsystems
such as the digestive, the respiratory, the
circulatory, the excretory and the reproductive
and their relationship)
 Populations (e.g., species, evolution,
biodiversity, genetic variation)
 Ecosystems (e.g., food chains, matter and
energy flow)
 Biosphere (e.g., ecosystem services,
sustainability)
(1) Content:
The content knowledge that
PISA assesses is selected from
the
major fields of physics,
chemistry, biology, and earth
and space sciences.
(1) Explain:
Explain
phenomena
scientifically.
(2) Physical Systems
 Structure of matter (e.g., particle model, bonds).
 Properties of matter (e.g., changes of state,
thermal and electrical conductivity).
 Chemical changes of matter (e.g., chemical
reactions, energy transfer, acids/bases).
 Motion and forces (e.g., velocity, friction) and
action at a distance (e.g., magnetic,
gravitational and electrostatic forces).
 Energy and its transformation (e.g.,
conservation, dissipation, chemical reactions).
 Interactions between energy and matter (e.g.,
light and radio waves, sound and seismic
waves).
(2) Procedural:
It is this knowledge of the
standard concepts and
procedures essential to
scientific enquiry that
underpins the
collection, analysis and
interpretation of scientific
data.
(2) Interpret:
Interpret data and
evidence
scientifically.
(3) Earth and Space
 Structures of the Earth (e.g., lithosphere,
atmosphere, hydrosphere).
 Energy in the Earth (e.g., sources, global
climate).
 Change in the Earth (e.g., plate tectonics,
geochemical cycles, constructive and destructive
forces).
 Earth‟s history (e.g., fossils, origin and
evolution).
 Earth in space (e.g., gravity, solar systems,
galaxies).
 The history and scale of the Universe and its
history (e.g., light year, Big Bang theory).
(3) Epistemic:
Epistemic knowledge is a
knowledge of the constructs
and defining features essential
to
the process of knowledge
building in science (e.g.
hypotheses, theories and
observations)
and their role in justifying the
knowledge produced by
science.
(3) Evaluate:
Evaluate and
design scientific
enquiry
Table 2. Distribution of science items used in PISA-2018 by subdomains.
Systems Knowledge Competency Number of Items
Living Systems
Content
Explain 18
18
47
Interpret
Evaluate
Procedural
Explain 3
22
Interpret 12
Evaluate 7
Epistemic
Explain
7
Interpret 2
Evaluate 5
Physical Systems
Content
Explain 14
17
38
Interpret 3
Evaluate
Procedural
Explain 1
14
Interpret 4
Evaluate 9
Epistemic Explain 7
American Research Journal of Humanities Social Science (ARJHSS)R) 2021
ARJHSS Journal www.arjhss.com Page | 47
Interpret
Evaluate 7
Earth and Space Systems
Content
Explain 12
14
30
Interpret 2
Evaluate
Procedural
Explain
11
Interpret 11
Evaluate
Epistemic
Explain 1
5
Interpret 2
Evaluate 2
2.2.2. Mathematics Assessment:
The mathematics assessment framework for PISA-2018 is organized around two dimensions: a content
dimension specifying the domains or subject matter to be assessed within mathematics and a process dimension
specifying the domains or thinking processes to be assessed (Table-3). The cognitive process domains describe
the sets of behaviors expected of students as they engage with the mathematics content. Distribution of total 82
math items can be seen in table-4 below.
Table 3.PISA Mathematics Test Content, and Cognitive Process Domains
Content Domain Process Domain
(1) Space and Shape
(1) Employ:
Employing Mathematical Concepts, Facts and Procedures.
(2) Quantity
(2) Interpret:
Interpreting, Applying and Evaluating Mathematical Outcomes.
(3) Change and Relationships
(3) Formulate:
Formulating Situations Mathematically
(4) Uncertainty and Data
Table 4. Distribution of mathematics items used in PISA-2018 by subdomains.
Space and
Shape
Quantity
Change and
Relationships
Uncertainty and
Data
TOTAL
Employ 8 12 10 5 35
Interpret 1 6 5 11 23
Formulate 10 3 7 4 24
TOTAL 19 21 22 20 82
2.2.3. Reading Assessment:
The reading assessment framework for PISA-2018 is organized around two dimensions: a subordinate
category dimension specifying the essential cognitive components of reading to be assessed, a cognitive process
dimension specifying the sets of behaviors expected of students as they engage with reading (Table-5).
Distribution of total 72reading items can be seen in table-6 below. Since the data could not be obtained for each
of the cognitive process seen in table-5 below, number of test items were only categorized by subordinate
categories.
American Research Journal of Humanities Social Science (ARJHSS)R) 2021
ARJHSS Journal www.arjhss.com Page | 48
Table 5. PISA Reading Test Dimensions
Subordinate Category Cognitive Processes
(1) Locating Information
On a daily basis, readers most often use texts for
purposes that require the location of specific
information, with little or no consideration for the
rest of the text. Locating information is an obligatory
component of reading when using complex digital
information such as search engines and websites
 Accessing and retrieving information within a
text.
 Searching for and selecting relevant text.
(2) Understanding
A large number of reading activities involve the
parsing and integration of extended passages of text
in order to form an understanding of the meaning
conveyed in the passage.
 Representing literal meaning.
 Integrating and generating inferences.
(3) Evaluating and Reflecting
Reasoning beyond the literal or inferred meaning of
the text. Reflecting on the content and form of the
text and critically assessing the quality and validity of
the information therein.
 Assessing quality and credibility.
 Reflecting on content and form.
 Detecting and handling conflict.
Table 6. Distribution of reading items used in PISA-2018 by categories.
Subordinate Category Number of Items
Locating Information 14
Understanding 41
Evaluating and Reflecting 17
2.3. Establishing item groups and coding
In the Science test, considering the “System”domain (3 groups), “Knowledge”domain (3 groups), and
“Competency” domain (3 groups), a total of 27 (3x3x3) item groups can be made up for expressing all futures of
each individual items. However, nine of those item groups have no items (i.e., questions) (see Table-2).
Therefore, only 18 of these item groups can be found explaining the 115science items. In order to represent these
groups in a systematic and more understandable way, an index made up by using letter and number codes. For
example, the item group “Living Systems-Procedural-Evaluate” is indicated as (S_S1_K2_C3) meaning
“Science, System-1, Knowledge-2, Competency-3” by using codes shown in Table 1.
Similarly, in the Mathematics test, item groups were established considering the “Content” domain (4
groups) and “Process” domain (3 groups) (see Table-3). A total of 12 (4x3) item groups were made up for
expressing all futures of 82 items used in mathematics test. In order to represent these groups in a systematic and
more understandable way, an index made up by using letter and number codes. For example, the item group
“Quantity-Formulate” is indicated as (M_C2_P3) meaning “Math, Content-2, Process-3” by using codes shown
in Table 3.
Finally, in the Reading test, item groups were established considering the “Subordinate Category”
domain (3 groups) as seen in table-5. Although, there is another dimension called “Cognitive process” in
specifications of reading items seen in Table-5, data could not be obtained for each of these categories.
Therefore, number of test items were only categorized by subordinate categories. A total of three item groups
were made up for expressing all futures of 72 items used in the reading test. In order to represent these groups in
a systematic and more understandable way, an index made up by using letter codes. For example, the item group
“Locate” is indicated as (R_L) meaning “Reading, Locate”.
These item groups were used as indicator variablesin the first level of two-level linear hierarchical
measurement model. If an item belongs to a group represented by indicator variable it was coded as “1”
otherwise it was coded as “0”. In the second step of two-level linear hierarchical measurement model,another
indicator variable was made up to be able to identify “U.S.” among other participant countries. This indicator
variable was coded as “1” for “U.S.” and “0” for the remaining participants.
2.4. Data Analysis
Data used in this study were filtered and reorganized as result of series of phases. All 269items (115
science, 82 math and 72 reading) were grouped according to various domains. Then, these item groups were
analyzed by using Multilevel Measurement Models for science, math, and reading separately. First, the mean
correct responses of obtained items for each participant country were obtained from OECD‟s database. Then,
American Research Journal of Humanities Social Science (ARJHSS)R) 2021
ARJHSS Journal www.arjhss.com Page | 49
items in three tests (science, math and reading) were grouped and coded as explained in previous section. In the
third stage, data obtained from first and second stages were combined via SAS program and data files needed for
the next phase were made up. Finally, data were analyzed by using two-level linear measurement models via
HLM-6 software (Raudenbush, 2004) for each of the three tests separately.
Average rate of correct response variable is continuous dependent variable in this model. This variable
is expressed as a percentage within the scale between 0 and 100.According to multilevel linear measurement
model defined by Kamata, Bauer and Miyazaki (2008), the average correct responses for item groups are nested
in individual participants. In this study, the same methodology was followed but average correct responses for
item groups were nested in groups of individuals. First level of the two-level measurement model is shown in
Equation 1 in which “i” indicates item (i = 1, 2,..., İ), “j” indicates group of individuals (j = 1, 2,..., J) and k
indicates predictor (k = 1, 2,..., K).
0 1 1 2 2 ( 1) ( 1)
...
ij j j ij j ij k j k ij Kj Kij ij
Y D D D D
     
 
       Eq. 1
In this equation, ij
Y represents predicted outcome indicating average correct response of individuals in
group “j” for item “i” in the test. Similarly, kij
D represents value of item “i” for predictor variable “k”. In other
words, it is an indicator variable that represents the item group where item “i” is.Parameter kj
 represents the
effect of the predictor variable “k”. Basically, it indicates the average rate of correct response of individual in
group “j” for item “i”. Similarly, ij
 represents the error for achievement levels of individuals in group “j” for
item group “i”.
Parameters such as 0 j
 and kj
 presented in the first level of the model are defined as dependent
variables in the second level of the model. In this case the second level of the model was formulized as follows.
0 01 0
1 10 11
2 20 21
( 1) ( 1)0 ( 1)1
0
( )
( )
( )
.
.
.
( )
j j j
j j
j j
k j k k j
Kj K
grup r
grup
grup
grup
 
  
  
  
 
  
 
 
 
 

Eq. 2
In the equation, parameters 10
 , 20
 , ( 1)0
k
  and 0
K
 present the rate of correctresponses for each
item group and they don‟t change by groups. The term 0 j
r
indicates achievement levels of groups. As aimed in
this study, the purpose is to compare average correct response rates of item groups in level two. Therefore, an
indicator variable was added to the model as shown in Equation 2 in level two. Here, ( )j
grup is an indicator
variable with two categories. While the focal group takes the value 1, reference group takes value 0.
Coefficients 10
 , 20
 , ( 1)0
k
  and 0
K
 represent mean correct response of item groups for reference category.
Coefficient 01
 represents the difference between mean correct responses for focal and reference groups for
selected reference item group (last item group above). Coefficients 11
 , 21
 and ( 1)1
k
  represent the difference
between mean correct responses for focal and reference groups for remaining item groups and is computed as
deviation from coefficient 01
 .Coefficient 01
 is called the main effect since it shows the achievement level
differencesbetween groups in terms of reference item while coefficients 11
 , 21
 and ( 1)1
k
  are called
interaction effects since they represent the deviation of achievement differences between groups from main
effect. Therefore,the sum of the main effect and interaction effects give the total effect. Interaction effects
mentioned here are called “cross-level interaction effect” in statistical literature and mentioned as fundamental
advantage of hierarchical modeling over traditional modeling (Raudenbush&Bryk; 2002).
III. Results
2.5. Two Level Measurement Model with Level-One Predictors Only
Analysis of data using this model reveals both average correct response for each item group and
achievement levels of all PISA participant countries. The predicted average rate of correct responses and
standard errors are shown in Table7, Table8, and Table9 below for science, math and reading respectively.
American Research Journal of Humanities Social Science (ARJHSS)R) 2021
ARJHSS Journal www.arjhss.com Page | 50
Table 7. Item Groups Descriptive for Science
Item Groups Number of Items Predicted Average Percent
Correct (%)
Standard Error
S_S1_K1_C1 18 45.45 1.78
S_S1_K2_C1 3 33.36 1.45
S_S1_K2_C2 12 51.59 1.77
S_S1_K2_C3 7 52.82 1.94
S_S1_K3_C2 2 56.71 1.95
S_S1_K3_C3 5 31.66 1.88
S_S2_K1_C1 14 47.3 1.79
S_S2_K1_C2 3 44.97 2.13
S_S2_K2_C1 1 22.81 1.35
S_S2_K2_C2 4 65.92 1.82
S_S2_K2_C3 9 50.25 2.01
S_S2_K3_C3 7 33.73 1.56
S_S3_K1_C1 12 42.61 1.91
S_S3_K1_C2 2 46.25 1.92
S_S3_K2_C2 11 53.27 1.86
S_S3_K3_C1 1 18.8 1.41
S_S3_K3_C2 2 33.77 1.67
S_S3_K3_C3 2 65.89 1.77
Table 8. Item Groups Descriptive for Mathematics
Item Groups Number of Items Predicted Average Percent
Correct (%)
Standard Error
M_C1_P1 8 35.68 1.66
M_C1_P2 1 78.82 1.34
M_C1_P3 10 22.02 1.32
M_C2_P1 12 49.97 1.87
M_C2_P2 6 55.05 1.53
M_C2_P3 3 43.96 1.96
M_C3_P1 10 40.83 1.39
M_C3_P2 5 49.98 1.81
M_C3_P3 7 31.06 1.41
M_C4_P1 5 46.02 1.47
M_C4_P2 11 50.62 1.86
M_C4_P3 4 32.48 1.9
Table 9. Item Groups Descriptive for Reading
Item Groups Number of Items Predicted Average Percent
Correct (%)
Standard Error
R_L 14 55.62 1.67
R_U 41 54.50 1.71
R_E 17 53.37 1.54
Predicted within-participants variance,
2
̂ , and predicted between-participants variance, 00
ˆ
 , were
computed for each of the three tests in order to calculate reliability coefficient for predictions. The following
tables (Table 10, Table 11, and Table 12) shows those variances for each of the 3 tests.
Table 10.Science: Two Level Measurement Model with Level-One Predictors Only
Random Effect Parameter Variance Degrees of
Freedom (df)
Chi-Square
value
p- value
Level-2 Error Term
00
ˆ
 95.24 35 4382.17 <0.001
Level-1 Error Term 2
̂ 149.53
Table 11.Math: Two Level Measurement Model with Level-One Predictors Only
Random Effect Parameter Variance Degrees of
Freedom (df)
Chi-Square
value
p- value
Level-2 Error Term
00
ˆ
 102.31 35 4511.24 <0.001
American Research Journal of Humanities Social Science (ARJHSS)R) 2021
ARJHSS Journal www.arjhss.com Page | 51
Level-1 Error Term 2
̂ 156.82
Table 12. Reading: Two Level Measurement Model with Level-One Predictors Only
Random Effect Parameter Variance Degrees of
Freedom (df)
Chi-Square
value
p- value
Level-2 Error Term
00
ˆ
 77.24 34 3974.62 <0.001
Level-1 Error Term 2
̂ 80.59
As indicated in the above tables, obtained variances are statistically significant (p-value <0.001) in 0.05
alpha level. The reliability coefficient, r̂ , of predicted achievement levels of all PISA participants were
calculated for each of the three tests by using the formula shown below. Reliability coefficients were found as
0.92, 0.88, 0.75 for science, math and reading respectively.
2.6. Two Level Measurement Model with Level-One and Level-Two Predictors
Both the average rate of correct responses and the standard errors for each item group for all PISA
participants (36, including the U.S.) were predicted by previous model. Achievement level differences between
the U.S. and all other participants for each item group were predicted and tested statistically by this model.
Predicted differences in average rate of correct responses, standard errors, and p-values were given in Table13.
In the table, while p-values in blue colored cells show statistically significant differences, orange colored rows
indicate item groups on which U.S. students significantly lower than international average.
Table 13. Predicted Differences in Average Rate of Correct Responses Between the United States and Other
PISA Participants and Standard Errors.
Item Groups
Numbe
r of
Items
Predicted
Average
Percent
Correct
Predicted
Difference
in Percent
Correct
Standard
Error
P-Value
Number of
countries
higher than
U.S.
Number of
countries
lower than
U.S.
S_S1_K1_C
1
18 45.45 +2.86 1.78 0.0030 10 26
S_S1_K2_C
1
3 33.36 +3.27 1.45 0.0000 11 25
S_S1_K2_C
2
12 51.59 +1.52 1.77 0.1320 15 21
S_S1_K2_C
3
7 52.82 +1.80 1.94 0.0481 11 25
S_S1_K3_C
2
2 56.71 +1.82 1.95 0.1888 15 21
S_S1_K3_C
3
5 31.66 +2.25 1.88 0.0540 16 20
S_S2_K1_C
1
14 47.3 +3.11 1.79 0.0046 12 24
S_S2_K1_C
2
3 44.97 -3.19 2.13 0.0342 24 12
S_S2_K2_C
1
1 22.81 +1.15 1.35 0.3680 17 19
S_S2_K2_C
2
4 65.92 +4.21 1.82 0.0007 11 25
S_S2_K2_C
3
9 50.25 +3.13 2.01 0.0018 11 25
S_S2_K3_C
3
7 33.73 +3.30 1.56 0.0000 11 25
S_S3_K1_C
1
12 42.61 +2.68 1.91 0.0161 12 24
S_S3_K1_C
2
2 46.25 +3.76 1.92 0.0059 14 22
S_S3_K2_C
2
11 53.27 +4.90 1.86 0.0000 8 28
S_S3_K3_C
1
1 18.8 +2.32 1.41 0.0002 7 29
S_S3_K3_C
2
2 33.77 +1.75 1.67 0.0795 13 23
S_S3_K3_C
3
2 65.89 +3.57 1.77 0.0001 9 27
M_C1_P1 8 35.68 -3.08 1.66 0.0066 29 7
M_C1_P2 1 78.82 -1.44 1.34 0.1658 28 8
M_C1_P3 10 22.02 -3.25 1.32 0.0002 28 8
M_C2_P1 12 49.97 -2.84 1.87 0.0114 30 6
M_C2_P2 6 55.05 -2.08 1.53 0.0396 27 9
M_C2_P3 3 43.96 -1.77 1.96 0.0597 28 8
M_C3_P1 10 40.83 -1.22 1.39 0.0801 24 12
M_C3_P2 5 49.98 +1.13 1.81 0.4239 22 14
M_C3_P3 7 31.06 -1.74 1.41 0.0743 27 9
M_C4_P1 5 46.02 +1.31 1.47 0.9303 20 16
M_C4_P2 11 50.62 -1.97 1.86 0.0840 27 9
M_C4_P3 4 32.48 -3.42 1.9 0.0397 29 7
R_L 14 55.62 -1.6 1.67 0.1092 18 17
R_U 41 54.5 +2.03 1.71 0.0315 12 23
R_E 17 53.37 +4.71 1.54 0.0000 3 32
American Research Journal of Humanities Social Science (ARJHSS)R) 2021
ARJHSS Journal www.arjhss.com Page | 52
2.7. Results for Science
Overall, the results from the current study revealed that the U.S. students have performed well in
science assessment compared to other participants. Specifically, the U.S. students have performed significantly
higher than international average on 11 of the 18 item groups in science. Similarly, they performed higher than
international average on six item groups although the differences were not significant. Data analysis also
revealed that while students from12 countries have performed better than U.S. students on these 17 item groups,
students from 23 countries have performed lower than the U.S. students.
On the other hand, U.S. students have performed significantly lower than international average on only
one of the 18 item groups in science. As seen in table-13, average percent correct responses of U.S. students on
the item group S_S2_K1_C2 (Physical Systems / Content Knowledge / Interpret) was 3.19 percent lower than
the international average. Sample items in this group can be seen in the following figures (figures-1-4). Data
analysis also revealed that while students from 26 countries have performed better than U.S. students on this
item group, U.S. students have performed better than only 11 of 35 countries.
Figure-1. Sample Science Item in Physical Systems / Content Knowledge / Interpret Item Group
Figure-2. Sample Science Item in Physical Systems / Content Knowledge / Interpret Item Group
Figure-3. Sample Science Item in Physical Systems / Content Knowledge / Interpret Item Group
American Research Journal of Humanities Social Science (ARJHSS)R) 2021
ARJHSS Journal www.arjhss.com Page | 53
Figure-4. Sample Science Item in Physical Systems / Content Knowledge / Interpret Item Group
Differences between averages and standard deviations were computed for this item group in order to see
the differences on individual items by using the information in OECD reports.It was clearly observed that
participants from U.S. performed lower than the other participants in all of the items in the S_S2_K1_C2 item
group. Effect size, as seen in the last column of Table14, shows the differences by using standard deviation
scale. Effect size was calculated by dividing differences between averages by standard deviation. For example,
effect size belonging to item CS413Q05S was found to be (-0.86) which means achievement level of the U.S.
participants is approximately one standard deviation lower than the average achievement level.
Table 14. Average Scores for Items in Physical Systems / Content Knowledge / Interpret Group.
Item Average (US)
Average
(International)
Difference SD
Effect Size of the
Difference
CS413Q06S 31.02 33.17 -2.15 9.37 -0.23
CS413Q04S 38.69 40.28 -1.58 10.41 -0.15
CS413Q05S 59.05 64.87 -5.82 6.73 -0.86
2.8. Results for Mathematics
Results of the study clearly showed that U.S. students have more difficulties in mathematics assessment
comparing to science and reading assessment. Particularly, the U.S. students performed significantly lower than
the international average on 5 of the 12 item groups in mathematics(Space and Shape/Employ, Space and
Shape/Formulate, Quantity/Employ, Quantity/Interpret, Uncertainty and Data/Formulate). Sample items in these
groups can be seen in the following figures (figures-5-9).Data analysis also revealed that while students from 28
countries have performed better than U.S. students on these 10 item groups, students from only seven countries
American Research Journal of Humanities Social Science (ARJHSS)R) 2021
ARJHSS Journal www.arjhss.com Page | 54
have performed lower than the U.S. students.On the other hand, U.S. students didn‟t perform significantly higher
than international average on any of the 12 item groups in mathematics.
Figure-5. Sample Math Item in “Space and Shape/ Formulate” Item Group
Figure-6. Sample Math Item in “Space and Shape / Employ” Item Group
Figure-7. Sample Math Item in “Quantity / Employ” Item Group
American Research Journal of Humanities Social Science (ARJHSS)R) 2021
ARJHSS Journal www.arjhss.com Page | 55
Figure-8. Sample Math Item in “Quantity / Interpret” Item Group
Figure-9. Sample Math Item in “Uncertainty and Data / Formulate” Item Group
2.9. Results for Reading
Results of the present study indicated that U.S. students performed considerably better on the reading
portion of the test when compared to their performance on the mathematics and science assessments. In
particular, the U.S. students performed lower than the international average on only one of the 3-item groups in
reading (R_L) (Locating Information), although this difference is not statically significant. Sample items in this
group can be seen in the following figures (Figures10-12). Data analysis also revealed that while students from
18 countries have performed better than U.S. students on that item group, students from 17 countries have
performed lower than the U.S. students.
On the other hand, U.S. students performed significantly higher than international average on the other
two item groups in reading (R_U and R_E) (Understanding and Evaluating/Reflecting). As seen in table-13, U.S.
students performed higher than international average on only two of the item groups although the differences
were not significant.
American Research Journal of Humanities Social Science (ARJHSS)R) 2021
ARJHSS Journal www.arjhss.com Page | 56
Figure-10. Sample Reading Item in “Locating Information” Item Group
Figure-11. Sample Reading Item in “Locating Information” Item Group
Figure-12. Sample Reading Item in “Locating Information” Item Group
The differences between averages and standard deviations were computed for this item group in order
to see the differences on individual items by using the information in OECD reports. Considering this
information, it was clearly observed that participants from U.S. performed significantly lower than the other
American Research Journal of Humanities Social Science (ARJHSS)R) 2021
ARJHSS Journal www.arjhss.com Page | 57
participants in three items in R_L item group. Effect size, as seen in the last column of Table15, shows the
differences in a more meaningful format by using standard deviation scale. Effect size was calculated by
dividing differences between averages by standard deviation. For example, effect size belonging to item
DR420Q02C was found to be (-1.30) which means achievement level of the U.S. participants more than one
standard deviation lower than the average achievement level.
IV. Discussion and Conclusion
As we examine examples from all around the world, we should consider that fundamental reform
movements in curriculum involving revisions and changes have been made for the last couple of decades in the
United States at both the national and state levels. International measurement studies such as PISA are
indispensable tools to be able to better understand the resulting effects of these U.S. curriculum reforms and
changes in long run. From this perspective, results of this study are important to understand the effects of these
curriculum reforms by comparing the students‟ achievement levels in PISAScience, Reading andMathematics
tests administered in 2018. Therefore, the aim of this study was to investigate and identify the item groups that
reveal statistically significant differences in achievement levels between participants from the U.S. and the
participants from the rest of the other countries. For this purpose, PISA items were analyzed by two-level linear
hierarchical measurement model.
The PISA test scores did not bring great news about the American education system, as the United
States continues to remain under international mean for mathematics and around the international mean for
reading and science. On the mathematics section, the U.S. scores significantly below the economically
developed countries in Europe and Asia. Compared to previous years the PISA scores on math are still
somewhat poor while science and especially reading scores are higher. The consistent finding has been that
American high school students perform less well in mathematics than their peers in many other countries. We
are not keeping up with our global counterparts, though the world is becoming increasingly interconnected and
interdependent. We performed slightly above the OECD average in reading and science (our scores have
remained unchanged in almost two decades while our counterparts' scores rose) but performed well below
average in mathematics.
Analysis of data showed that almost all student science responses fell within the predicted range. The
exception was item group S2_K1_C2, which refers to interpretation of content in physical systems. There were
only 3 items in this group. Physical systems refer to content learned in chemistry and physics course work. The
content includes the facts, concepts, and basic theories required to understand physical systems. Correct
responses required students to interpret information in the context provided. Interpretation involves analysis and
evaluation of data, the recognition that scientific evidence is uncertain, and that argumentation is needed to come
to a consensus about the meaning of the data. Further, interpretation may require students to make predictions or
suggest cause and effect relationships based on data.
In general, students in the United States are required to take three science credits in high school. In
some instances, all three of the science courses taken in high school may be related to living systems or earth and
space systems, and not physical systems. There are many reasons for this, including the fact that in many states
only biology has a high-stakes test requirement (Nolin&Parr, 2013; Momsenet al., 2010). In addition, students
may be more familiar with living systems content due to their experiences in elementary and middle school.
Further, courses such as chemistry and physics that are related to physical systems may be taught by
out-of-field teachers. Sometimes students rely on memorization of important facts, concepts, and theories in
physical systems courses so they lack the understanding required to interpret data effectively. (Dega, 2019;
Dewi&Primayana, 2019) Teaching physical systems content in context would benefit student understanding and
improve science literacy by relating content knowledge to the real world. Every day, reflective citizens make
decisions regarding their personal health and the environment, so they would benefit from learning how to
interpret data effectively.
Analysis of data showed that the U.S. students have performed considerably better in reading test
comparing to mathematics and science assessments. Particularly, the U.S. students performed lower than
international average on only one of the 3 item groups in reading (R_L) (Locating Information), although this
difference is not statically significant. Reading literacy, in PISA 2018, is defined as one‟s capacity to understand,
use, evaluate, reflect on, and engage with multiple texts, in a variety of formats, and across disciplines to achieve
one‟s goals; develop one‟s knowledge and potential; and participate in society (OECD, 2019). PISA assessments
in reading have changed to include multiple texts to reflect the “information-rich digital world,” reflecting the
evolution and growing influence of technology. Reading involves not only the printed page but also digital
formats. It requires readers to distinguish between fact and opinion, synthesize and interpret texts from multiple
sources, and deal with conflicting information across multiple disciplines. Analysis of data in this study showed
that the U.S. studentshave performed considerably better in the reading test compared to mathematics and
science assessments.
American Research Journal of Humanities Social Science (ARJHSS)R) 2021
ARJHSS Journal www.arjhss.com Page | 58
Literacy research has moved from a content area reading approach to a disciplinary reading approach in
which strategies that are distinctive to specific disciplines are used to help students comprehend discipline-based
texts (Milojević, 2020; Feng et al., 2019; Wandasari et al., 2019). Content area reading focuses on general
comprehension skills and study skills, rather than engaging students into reading like disciplinary experts.
Disciplinary literacy emphasizes that literacy and text are specialized and unique across the disciplines (Rainey,
Maher and Moje, 2020; Windschitl, 2019). For example, scientists engage in very different approaches to
reading than historians, and one can easily distinguish a math text from a literary one. Teaching literacy with a
disciplinary literacy approach requires different reading strategies. Disciplinary literacy encourages students to
grasp the ways literacy is used to create, disseminate, and critique information in the various disciplines.
Students need to be immersed in the language and thinking processes of that discipline, learn the content in each
discipline, and understand how and why reading and writing are used in each discipline.
The Common Core State Standards (CCSS) highlights that every teacher is a reading and writing
teacher in their discipline (Hayden&Eades-Baird, 2020; Lechtenberg et al., 2020). It established disciplinary
literacy goals to be introduced in the early sixth and seventh grades and to be mastered by twelfth grade.
However, traditional efforts to encourage every content area teacher to be a reading teacher have not been widely
accepted by teachers in the disciplines and not effective in raising reading achievement on a broad scale.
Disciplinary literacy is often a new and unfamiliar approach to students starting the middle grades. Students
struggling to learn to read in the early grade levels can quickly fall behind when reading to learn in the secondary
grade levels.
Establishing an appropriate curriculum for teacher preparation is a necessary component for improving
disciplinary literacy teaching for middle and high school students. There is also a need for explicit literacy
standards for teachers who teach in the disciplines along with sufficient resources to help guide their teaching in
varied disciplinary literacy contexts. Lastly, a key component to change includes a literacy curriculum that
guides students to better meet the specific demands of reading and writing in the disciplines than has been
provided by traditional conceptions of content-area reading.
Mathematics is an area where American students have always struggle (Schoenfeld, 2020; Frederick,
2020; Cuenca-Carlino, Freeman-Green et al., 2016; Barbieri &Booth, 2016). Results of this study suggested that
the U.S. students performed significantly below the OECD average. Our productivity is below the OECD
average and must be improved. Finland, Germany, Switzerland well outperform the U.S., for example. In a
detailed analysis the data revealed that the U.S. students performed significantly lower than international average
on 5 of the 12 item groups in mathematics (Space and Shape/Employ, Space and Shape/Formulate,
Quantity/Employ, Quantity/Interpret, Uncertainty and Data/Formulate).
Over 30 years of nationwide standardized testing, the mathematics scores of U.S. high school students
have barely shifted (Marsh et al., 2018; Woessmann, 2016). The findings of the present study indicate that U.S.
students mostly performed lower in the contents of “Space and Shape,” “Quantity,” and “Uncertainty and Data.”
Numerous possible reasons can be listed for the failure in so many content areas. One likely reason for students‟
limited mastery of quantity, for instance, is that many U.S. teachers lack a firm conceptual understanding of
fractions and division. In several studies (Coetzee&Mammen, 2017; Bentle&Bossé, 2018), it has been expressed
that the majority of elementary, middle school, high school and even college studentshave problems to generate
explanations for solving division problems with fractions. In contrast, most teachers in Japan and China
generated two or three explanations in response to the same question Coetzee&Mammen, 2017; Bentley&Bossé,
2018). One reason for the failure in geometry can be explained by student tendency to consider geometrical
objects as material objects and specific pictures rather than as theoretical, ideal objects which bear specific
properties (Antonini, 2018; Seah&Horne, 2019). This difficulty results to the phenomenon of students trying to
solve geometrical problems often relying on the visual perception of the given geometrical figure rather on a
mathematical deduction based on the properties of the geometrical objects involved. This is called „geometrical
figure to figural concept‟ difficulty (Fischbein, 1993)
Some other reasons for students‟ low performances in mathematics can be listed such as (1) difficulties
in formulating situations mathematically, such as representing a situation mathematically, recognizing
mathematical structure (including regularities, relationships, and patterns) in problems (Rahmawati&Retnawati,
2019; Jupri&Drijvers, 2016), (2) difficulties in evaluating the reasonableness of a mathematical solutions in the
context of a real-world problem (Sawatzki&Sullivan, 2018; Kanthawat et al., 2019), (3) difficulties in
understanding nonroutine (uncommon) problems completely(Fortes &Andrade, 2019; Chong et al., 2018;
Murphy et al., 2019). In order to better understand and identify specific reasons for this low performance, further
qualitative case studies should be conducted with high school students in different achievement levels. More
importantly, teacher educators, policy makers and teachers must analyze the quality of the instruction versus the
quantity of learning time spent.
Finally, PISA results clearly showed that students from the United States demonstrated learning gains
across all three subjects from 2015 to 2018, although the gains were slight and statistically insignificant.
American Research Journal of Humanities Social Science (ARJHSS)R) 2021
ARJHSS Journal www.arjhss.com Page | 59
Nonetheless, the gains were sufficient enough to move U.S. reading and science scores above the OECD
average. Math scores remained below the OECD average (NCES, 2020). This study clearly identified content
and cognitive domains in which the U.S. students have performed significantly lower than international average.
Therefore, the results of this study are important for teacher training programs, educational policy makers and
teachers to be able to examine and identify possible reasons for these low performances in specific areas.
References
[1]. Afdal, H. W. (2019). The promises and limitations of international comparative research on
teacher education. European Journal of Teacher Education, 42(2), 258-275.
[2]. Antonini, S. (2018). Figural concepts in proving by contradiction. Quadrante, 27(2), 115-132.
[3]. Barbieri, C., & Booth, J. L. (2016). Support for struggling students in algebra: Contributions of
incorrect worked examples. Learning and Individual Differences, 48, 36-44.
[4]. Bentley, B., &Bossé, M. J. (2018). College students' understanding of fraction
operations. International Electronic Journal of Mathematics Education, 13(3), 233-247.
[5]. Cai, J., Mok, I. A., Reddy, V., & Stacey, K. (2016). International comparative studies in
mathematics: Lessons for improving students’ learning. Springer Nature.
[6]. Chong, M. S. F., Shahrill, M., Putri, R. I. I., &Zulkardi. (2018, April). Teaching problem solving
using non-routine tasks. In AIP Conference Proceedings (Vol. 1952, No. 1, p. 020020). AIP
Publishing LLC.
[7]. Coetzee, J., &Mammen, K. J. (2017). Science and engineering students’ difficulties with
fractions at entry-level to university. International Electronic Journal of Mathematics
Education, 12(3), 281-310.
[8]. Cogan, L. S., Schmidt, W. H., & Guo, S. (2019). The role that mathematics plays in college-and
career-readiness: evidence from PISA. Journal of Curriculum Studies, 51(4), 530-553.
[9]. Cooper, G., & Berry, A. (2020). Demographic predictors of senior secondary participation in
biology, physics, chemistry and earth/space sciences: students’ access to cultural, social and
science capital. International Journal of Science Education, 42(1), 151-166.
[10]. Cordero, J. M., Cristobal, V., &Santín, D. (2018). Causal inference on education policies: a
survey of empirical studies using PISA, TIMSS and PIRLS. Journal of Economic Surveys, 32(3),
878-915.
[11]. Cuenca-Carlino, Y., Freeman-Green, S., Stephenson, G. W., &Hauth, C. (2016). Self-regulated
strategy development instruction for teaching multi-step equations to middle school students
struggling in math. The Journal of Special Education, 50(2), 75-85.
[12]. Dega, B. G. (2019). Cognitive diagnostic assessment of students’ responses: An example from
energy and momentum concepts. European Journal of Physics Education, 10(1), 13-23.
[13]. Dewi, P. Y., &Primayana, K. H. (2019). Effect of learning module with setting contextual
teaching and learning to increase the understanding of concepts. International Journal of
Education and Learning, 1(1), 19-26.
[14]. Elliott, J., Stankov, L., Lee, J., & Beckmann, J. F. (2019). What did PISA and TIMSS ever do for
us? The potential of large-scale datasets for understanding and improving educational
practice. Comparative Education, 55(1), 133-155.
[15]. Feng, L., Hodges, T. S., Waxman, H. C., & Joshi, R. M. (2019). Discovering the impact of
reading coursework and discipline-specific mentorship on first-year teachers’ self-efficacy: A
latent class analysis. Annals of Dyslexia, 69(1), 80-98.
[16]. Fischbein, E. (1993). The theory of figural concepts. Educational Studies in Mathematics, 24(2),
139-162.
[17]. Fortes, E. C., & Andrade, R. R. (2019). Mathematical creativity in solving non-Routine
problems. The Normal Lights, 13(1).
[18]. Frederick, K. D. (2020). The Outcomes of pre-teaching math lessons to students who struggle in math:
A single-subject design approach (Doctoral dissertation, The Chicago School of Professional
Psychology).
American Research Journal of Humanities Social Science (ARJHSS)R) 2021
ARJHSS Journal www.arjhss.com Page | 60
[19]. Grabau, L. J., & Ma, X. (2017). Science engagement and science achievement in the context of
science instruction: a multilevel analysis of US students and schools. International Journal of
Science Education, 39(8), 1045-1068.
[20]. Han, S. W. (2017). From achievement to non-test outcomes in PISA: National trends in stem
career expectations. In The impact of the OECD on education worldwide. Emerald Publishing
Limited.
[21]. Hayden, H. E., &Eades-Baird, M. (2020). Disciplinary literacy and the 4Es: Rigorous and
substantive responses to interdisciplinary standards. Literacy Research: Theory, Method, and
Practice.
[22]. Hwang, S., & Yeo, S. (2020). Gender differences in Korean elementary students: An analysis of
TIMSS 2011 and 2015 fourth grade mathematics assessment. The Mathematical Education, 59(3),
217-235.
[23]. Hwang, J., Choi, K. M., Bae, Y., & Shin, D. H. (2018). Do teachers’ instructional practices
moderate equity in mathematical and scientific literacy? An investigation of the PISA 2012
and 2015. International Journal of Science and Mathematics Education, 16(1), 25-45.
[24]. Jupri, A., &Drijvers, P. (2016). Student difficulties in mathematizing word problems in
algebra. Eurasia Journal of Mathematics, Science and Technology Education, 12(9), 2481-2502.
[25]. Kamata, A., Bauer, D. J., & Miyazaki, Y. (2008). Multilevel modeling of educational data. A. A.
OConnell&McCoach, DB (Eds.), 345-388.
[26]. Kanthawat, C., Supap, W., &Klin-eam, C. (2019). The development of grade 11 students’
mathematical literacy on sequences and series using mathematical modelling. In Journal of
Physics: Conf. Series (Vol. 1157, pp. 1-6).
[27]. Klieme, E. (2020). Policies and practices of assessment: A showcase for the use (and misuse) of
international large-scale assessments in educational effectiveness research. In International
Perspectives in Educational Effectiveness Research (pp. 147-181). Springer, Cham.
[28]. Kyriakides, L., Creemers, B., & Panayiotou, A. (2020). Developing and testing theories of
educational effectiveness addressing the dynamic nature of education. In International
Perspectives in Educational Effectiveness Research (pp. 33-69). Springer, Cham.
[29]. Lechtenberg, K., Thein, A. H., &Rushek, K. (2020). Challenging hierarchies of reading and text
selection in the revised publishers’ criteria for the Common Core State Standards. The
Bloomsbury Handbook of Reading Perspectives and Practices, 258.
[30]. Marsh, H. W., Pekrun, R., Murayama, K., Arens, A. K., Parker, P. D., Guo, J., &Dicke, T. (2018).
An integrated model of academic self-concept development: Academic self-concept, grades,
test scores, and tracking over 6 years. Developmental Psychology, 54(2), 263.
[31]. Milojević, S. (2020). Practical method to reclassify Web of Science articles into unique subject
categories and broad disciplines. Quantitative Science Studies, 1(1), 183-206.
[32]. Momsen, J. L., Long, T. M., Wyse, S. A., & Ebert-May, D. (2010). Just the facts? Introductory
undergraduate biology courses focus on low-level cognitive skills. CBE—Life Sciences
Education, 9(4), 435-440.
[33]. Murphy, P. E. L., Evans, T., Klymchuk, S., Novak, J., Stephens, J., & Thomas, M. (2019).
University STEM students' perceptions of creativity in non-routine problem-solving. ANZIAM
Journal, 61, C152-C165.
[34]. Nolin, J. B., & Parr, B. (2013). Utilization of a high stakes high school graduation exam to
assess the impact of agricultural education: A measure of curriculum integration. Journal of
Agricultural Education, 54(3), 41-53.
[35]. Nortvedt, G. A. (2018). Policy impact of PISA on mathematics education: The case of
Norway. European Journal of Psychology of Education, 33(3), 427-444.
[36]. OECD. (2019). PISA 2018 assessment and analytical framework. OECD publishing.
[37]. Raudenbush, S. W. (2004). HLM 6: Hierarchical linear and nonlinear modeling. Scientific
Software International.
American Research Journal of Humanities Social Science (ARJHSS)R) 2021
ARJHSS Journal www.arjhss.com Page | 61
[38]. Raudenbush, S. W., & Bryk, A. S. (2002). Hierarchical linear models: Applications and data
analysis methods (Vol. 1),SAGE.
[39]. Rahmawati, F., &Retnawati, H. (2019, March). An analysis of students’ difficulties in solving
PISA-like mathematical problems. In Journal of Physics: Conference Series (Vol. 1200, No. 1, p.
012015). IOP Publishing.
[40]. Rainey, E. C., Maher, B. L., & Moje, E. B. (2020). Learning disciplinary literacy teaching: An
examination of preservice teachers’ literacy teaching in secondary subject area
classrooms. Teaching and Teacher Education, 94, 103123.
[41]. Sawatzki, C., & Sullivan, P. (2018). Shopping for shoes: Teaching students to apply and
interpret mathematics in the real world. International Journal of Science and Mathematics
Education, 16(7), 1355-1373.
[42]. Schoenfeld, A. H. (2020). Mathematical practices, in theory and practice. ZDM–The
International Journal on Mathematics Education.
[43]. She, H. C., Stacey, K., & Schmidt, W. H. (2018). Science and mathematics literacy: PISA for
better school education. International Journal of Science and Mathematics Education, 16(1), 1-5.
[44]. Seah, R., & Horne, M. (2019). A learning progression for geometric reasoning. In Researching
and using progressions (trajectories) in mathematics education (pp. 157-180). Brill Sense.
[45]. Sorby, S. A., & Panther, G. C. (2020). Is the key to better PISA math scores improving spatial
skills? Mathematics Education Research Journal, 1-21.
[46]. Teig, N., Scherer, R., &Kjærnsli, M. (2020). Identifying patterns of students' performance on
simulated inquiry tasks using PISA 2015 log‐file data. Journal of Research in Science Teaching.
[47]. Thien, L. M. (2016). Malaysian students’ performance in mathematics literacy in PISA from
gender and socioeconomic status perspectives. The Asia-Pacific Education Researcher, 25(4), 657-
666.
[48]. Vedder, P. (2020). Measuring the quality of education:An introduction. Measuring the Quality
of Education, 1.
[49]. Wandasari, Y., Kristiawan, M., & Arafat, Y. (2019). Policy evaluation of school’s literacy
movement on improving discipline of state high school students. International Journal of
Scientific & Technology Research, 8(4), 190-198.
[50]. Windschitl, M. (2019). Disciplinary literacy versus doing school. Journal of Adolescent & Adult
Literacy, 63(1), 7-13.
[51]. Woessmann, L. (2016). The importance of school systems: Evidence from international
differences in student achievement. Journal of Economic Perspectives, 30(3), 3-32.
[52]. Zhang, W., & Bray, M. (2020). Comparative research on shadow education: Achievements,
challenges, and the agenda ahead. European Journal of Education, 55(3), 322-341.

More Related Content

Similar to H4104461.pdf

Guided discovery learning strategy and senior school students performance in ...
Guided discovery learning strategy and senior school students performance in ...Guided discovery learning strategy and senior school students performance in ...
Guided discovery learning strategy and senior school students performance in ...Alexander Decker
 
A Bibliometrics Study On Homework From 1977 To 2020
A Bibliometrics Study On Homework From 1977 To 2020A Bibliometrics Study On Homework From 1977 To 2020
A Bibliometrics Study On Homework From 1977 To 2020Amy Roman
 
COGNITIVE AND EPISTEMIC SPACES IN THE CSTA COMPUTER SCIENCE LEARNING STANDARDS
COGNITIVE AND EPISTEMIC SPACES IN THE CSTA COMPUTER SCIENCE LEARNING STANDARDSCOGNITIVE AND EPISTEMIC SPACES IN THE CSTA COMPUTER SCIENCE LEARNING STANDARDS
COGNITIVE AND EPISTEMIC SPACES IN THE CSTA COMPUTER SCIENCE LEARNING STANDARDSIJITE
 
Application Essays And The Performance Of Merit In US Selective Admissions
Application Essays And The Performance Of Merit In US Selective AdmissionsApplication Essays And The Performance Of Merit In US Selective Admissions
Application Essays And The Performance Of Merit In US Selective AdmissionsJim Webb
 
Accessing The General Education Math Curriculum For Secondary Students With H...
Accessing The General Education Math Curriculum For Secondary Students With H...Accessing The General Education Math Curriculum For Secondary Students With H...
Accessing The General Education Math Curriculum For Secondary Students With H...Andrea Porter
 
ACADEMIC PERFORMANCE.Pdf
ACADEMIC PERFORMANCE.PdfACADEMIC PERFORMANCE.Pdf
ACADEMIC PERFORMANCE.PdfRenee Lewis
 
Research PowerPoint presentation senior high
Research PowerPoint presentation senior highResearch PowerPoint presentation senior high
Research PowerPoint presentation senior highCynthiaPinyuhan1
 
Demographic factors and students’ academic achievement in tertiary institutio...
Demographic factors and students’ academic achievement in tertiary institutio...Demographic factors and students’ academic achievement in tertiary institutio...
Demographic factors and students’ academic achievement in tertiary institutio...Alexander Decker
 
An Analysis Of Student Reflections Of Semester Projects In Introductory Stati...
An Analysis Of Student Reflections Of Semester Projects In Introductory Stati...An Analysis Of Student Reflections Of Semester Projects In Introductory Stati...
An Analysis Of Student Reflections Of Semester Projects In Introductory Stati...Jennifer Roman
 
Recommendations for Solving Low Rates of College Readiness at
 Recommendations for Solving Low Rates of College Readiness at Recommendations for Solving Low Rates of College Readiness at
Recommendations for Solving Low Rates of College Readiness atMoseStaton39
 
Educators’ Perspectives towards Inclusion of Students with Mild to Moderate D...
Educators’ Perspectives towards Inclusion of Students with Mild to Moderate D...Educators’ Perspectives towards Inclusion of Students with Mild to Moderate D...
Educators’ Perspectives towards Inclusion of Students with Mild to Moderate D...ijtsrd
 
Academic Honesty In The International Baccalaureate Diploma Programme
Academic Honesty In The International Baccalaureate Diploma ProgrammeAcademic Honesty In The International Baccalaureate Diploma Programme
Academic Honesty In The International Baccalaureate Diploma ProgrammeClaire Webber
 
Statistical Scoring Algorithm for Learning and Study Skills
Statistical Scoring Algorithm for Learning and Study SkillsStatistical Scoring Algorithm for Learning and Study Skills
Statistical Scoring Algorithm for Learning and Study Skillsertekg
 
E-Learning Research in Asia during 1996–2018 and the Four Country Indicators....
E-Learning Research in Asia during 1996–2018 and the Four Country Indicators....E-Learning Research in Asia during 1996–2018 and the Four Country Indicators....
E-Learning Research in Asia during 1996–2018 and the Four Country Indicators....eraser Juan José Calderón
 
Faheem, simaa mohamed improving student attitudes ije v4 n1 2016
Faheem, simaa mohamed improving student attitudes ije v4 n1 2016Faheem, simaa mohamed improving student attitudes ije v4 n1 2016
Faheem, simaa mohamed improving student attitudes ije v4 n1 2016William Kritsonis
 
A Meta-Analysis Of The Effectiveness Of Intelligent Tutoring Systems On K 12 ...
A Meta-Analysis Of The Effectiveness Of Intelligent Tutoring Systems On K 12 ...A Meta-Analysis Of The Effectiveness Of Intelligent Tutoring Systems On K 12 ...
A Meta-Analysis Of The Effectiveness Of Intelligent Tutoring Systems On K 12 ...Justin Knight
 
Survey design
Survey designSurvey design
Survey designwawaaa789
 
Singer_CLASP_November_2015.pptx
Singer_CLASP_November_2015.pptxSinger_CLASP_November_2015.pptx
Singer_CLASP_November_2015.pptxKumarNatarajan24
 

Similar to H4104461.pdf (20)

Guided discovery learning strategy and senior school students performance in ...
Guided discovery learning strategy and senior school students performance in ...Guided discovery learning strategy and senior school students performance in ...
Guided discovery learning strategy and senior school students performance in ...
 
A Bibliometrics Study On Homework From 1977 To 2020
A Bibliometrics Study On Homework From 1977 To 2020A Bibliometrics Study On Homework From 1977 To 2020
A Bibliometrics Study On Homework From 1977 To 2020
 
COGNITIVE AND EPISTEMIC SPACES IN THE CSTA COMPUTER SCIENCE LEARNING STANDARDS
COGNITIVE AND EPISTEMIC SPACES IN THE CSTA COMPUTER SCIENCE LEARNING STANDARDSCOGNITIVE AND EPISTEMIC SPACES IN THE CSTA COMPUTER SCIENCE LEARNING STANDARDS
COGNITIVE AND EPISTEMIC SPACES IN THE CSTA COMPUTER SCIENCE LEARNING STANDARDS
 
Application Essays And The Performance Of Merit In US Selective Admissions
Application Essays And The Performance Of Merit In US Selective AdmissionsApplication Essays And The Performance Of Merit In US Selective Admissions
Application Essays And The Performance Of Merit In US Selective Admissions
 
Accessing The General Education Math Curriculum For Secondary Students With H...
Accessing The General Education Math Curriculum For Secondary Students With H...Accessing The General Education Math Curriculum For Secondary Students With H...
Accessing The General Education Math Curriculum For Secondary Students With H...
 
ACADEMIC PERFORMANCE.Pdf
ACADEMIC PERFORMANCE.PdfACADEMIC PERFORMANCE.Pdf
ACADEMIC PERFORMANCE.Pdf
 
Lectura 4
Lectura 4Lectura 4
Lectura 4
 
Research PowerPoint presentation senior high
Research PowerPoint presentation senior highResearch PowerPoint presentation senior high
Research PowerPoint presentation senior high
 
Seminar On PISA
Seminar On PISASeminar On PISA
Seminar On PISA
 
Demographic factors and students’ academic achievement in tertiary institutio...
Demographic factors and students’ academic achievement in tertiary institutio...Demographic factors and students’ academic achievement in tertiary institutio...
Demographic factors and students’ academic achievement in tertiary institutio...
 
An Analysis Of Student Reflections Of Semester Projects In Introductory Stati...
An Analysis Of Student Reflections Of Semester Projects In Introductory Stati...An Analysis Of Student Reflections Of Semester Projects In Introductory Stati...
An Analysis Of Student Reflections Of Semester Projects In Introductory Stati...
 
Recommendations for Solving Low Rates of College Readiness at
 Recommendations for Solving Low Rates of College Readiness at Recommendations for Solving Low Rates of College Readiness at
Recommendations for Solving Low Rates of College Readiness at
 
Educators’ Perspectives towards Inclusion of Students with Mild to Moderate D...
Educators’ Perspectives towards Inclusion of Students with Mild to Moderate D...Educators’ Perspectives towards Inclusion of Students with Mild to Moderate D...
Educators’ Perspectives towards Inclusion of Students with Mild to Moderate D...
 
Academic Honesty In The International Baccalaureate Diploma Programme
Academic Honesty In The International Baccalaureate Diploma ProgrammeAcademic Honesty In The International Baccalaureate Diploma Programme
Academic Honesty In The International Baccalaureate Diploma Programme
 
Statistical Scoring Algorithm for Learning and Study Skills
Statistical Scoring Algorithm for Learning and Study SkillsStatistical Scoring Algorithm for Learning and Study Skills
Statistical Scoring Algorithm for Learning and Study Skills
 
E-Learning Research in Asia during 1996–2018 and the Four Country Indicators....
E-Learning Research in Asia during 1996–2018 and the Four Country Indicators....E-Learning Research in Asia during 1996–2018 and the Four Country Indicators....
E-Learning Research in Asia during 1996–2018 and the Four Country Indicators....
 
Faheem, simaa mohamed improving student attitudes ije v4 n1 2016
Faheem, simaa mohamed improving student attitudes ije v4 n1 2016Faheem, simaa mohamed improving student attitudes ije v4 n1 2016
Faheem, simaa mohamed improving student attitudes ije v4 n1 2016
 
A Meta-Analysis Of The Effectiveness Of Intelligent Tutoring Systems On K 12 ...
A Meta-Analysis Of The Effectiveness Of Intelligent Tutoring Systems On K 12 ...A Meta-Analysis Of The Effectiveness Of Intelligent Tutoring Systems On K 12 ...
A Meta-Analysis Of The Effectiveness Of Intelligent Tutoring Systems On K 12 ...
 
Survey design
Survey designSurvey design
Survey design
 
Singer_CLASP_November_2015.pptx
Singer_CLASP_November_2015.pptxSinger_CLASP_November_2015.pptx
Singer_CLASP_November_2015.pptx
 

More from American Research Journal of Humanities & Social Science

More from American Research Journal of Humanities & Social Science (20)

O49117143.pdf
O49117143.pdfO49117143.pdf
O49117143.pdf
 
N412114120.pdf
N412114120.pdfN412114120.pdf
N412114120.pdf
 
M41095107.pdf
M41095107.pdfM41095107.pdf
M41095107.pdf
 
F493852.pdf
F493852.pdfF493852.pdf
F493852.pdf
 
J4127989.pdf
J4127989.pdfJ4127989.pdf
J4127989.pdf
 
J497785.pdf
J497785.pdfJ497785.pdf
J497785.pdf
 
I4127078.pdf
I4127078.pdfI4127078.pdf
I4127078.pdf
 
G4125261.pdf
G4125261.pdfG4125261.pdf
G4125261.pdf
 
J4107480.pdf
J4107480.pdfJ4107480.pdf
J4107480.pdf
 
K4108187.pdf
K4108187.pdfK4108187.pdf
K4108187.pdf
 
H4126269.pdf
H4126269.pdfH4126269.pdf
H4126269.pdf
 
H496771.pdf
H496771.pdfH496771.pdf
H496771.pdf
 
F4103238.pdf
F4103238.pdfF4103238.pdf
F4103238.pdf
 
A490108.pdf
A490108.pdfA490108.pdf
A490108.pdf
 
D4123036.pdf
D4123036.pdfD4123036.pdf
D4123036.pdf
 
I497276.pdf
I497276.pdfI497276.pdf
I497276.pdf
 
G495366.pdf
G495366.pdfG495366.pdf
G495366.pdf
 
G4114953.pdf
G4114953.pdfG4114953.pdf
G4114953.pdf
 
F4114248.pdf
F4114248.pdfF4114248.pdf
F4114248.pdf
 
E493137.pdf
E493137.pdfE493137.pdf
E493137.pdf
 

Recently uploaded

भारत-रोम व्यापार.pptx, Indo-Roman Trade,
भारत-रोम व्यापार.pptx, Indo-Roman Trade,भारत-रोम व्यापार.pptx, Indo-Roman Trade,
भारत-रोम व्यापार.pptx, Indo-Roman Trade,Virag Sontakke
 
18-04-UA_REPORT_MEDIALITERAСY_INDEX-DM_23-1-final-eng.pdf
18-04-UA_REPORT_MEDIALITERAСY_INDEX-DM_23-1-final-eng.pdf18-04-UA_REPORT_MEDIALITERAСY_INDEX-DM_23-1-final-eng.pdf
18-04-UA_REPORT_MEDIALITERAСY_INDEX-DM_23-1-final-eng.pdfssuser54595a
 
ECONOMIC CONTEXT - PAPER 1 Q3: NEWSPAPERS.pptx
ECONOMIC CONTEXT - PAPER 1 Q3: NEWSPAPERS.pptxECONOMIC CONTEXT - PAPER 1 Q3: NEWSPAPERS.pptx
ECONOMIC CONTEXT - PAPER 1 Q3: NEWSPAPERS.pptxiammrhaywood
 
Software Engineering Methodologies (overview)
Software Engineering Methodologies (overview)Software Engineering Methodologies (overview)
Software Engineering Methodologies (overview)eniolaolutunde
 
ECONOMIC CONTEXT - LONG FORM TV DRAMA - PPT
ECONOMIC CONTEXT - LONG FORM TV DRAMA - PPTECONOMIC CONTEXT - LONG FORM TV DRAMA - PPT
ECONOMIC CONTEXT - LONG FORM TV DRAMA - PPTiammrhaywood
 
Hierarchy of management that covers different levels of management
Hierarchy of management that covers different levels of managementHierarchy of management that covers different levels of management
Hierarchy of management that covers different levels of managementmkooblal
 
Incoming and Outgoing Shipments in 1 STEP Using Odoo 17
Incoming and Outgoing Shipments in 1 STEP Using Odoo 17Incoming and Outgoing Shipments in 1 STEP Using Odoo 17
Incoming and Outgoing Shipments in 1 STEP Using Odoo 17Celine George
 
internship ppt on smartinternz platform as salesforce developer
internship ppt on smartinternz platform as salesforce developerinternship ppt on smartinternz platform as salesforce developer
internship ppt on smartinternz platform as salesforce developerunnathinaik
 
Alper Gobel In Media Res Media Component
Alper Gobel In Media Res Media ComponentAlper Gobel In Media Res Media Component
Alper Gobel In Media Res Media ComponentInMediaRes1
 
Capitol Tech U Doctoral Presentation - April 2024.pptx
Capitol Tech U Doctoral Presentation - April 2024.pptxCapitol Tech U Doctoral Presentation - April 2024.pptx
Capitol Tech U Doctoral Presentation - April 2024.pptxCapitolTechU
 
Enzyme, Pharmaceutical Aids, Miscellaneous Last Part of Chapter no 5th.pdf
Enzyme, Pharmaceutical Aids, Miscellaneous Last Part of Chapter no 5th.pdfEnzyme, Pharmaceutical Aids, Miscellaneous Last Part of Chapter no 5th.pdf
Enzyme, Pharmaceutical Aids, Miscellaneous Last Part of Chapter no 5th.pdfSumit Tiwari
 
Types of Journalistic Writing Grade 8.pptx
Types of Journalistic Writing Grade 8.pptxTypes of Journalistic Writing Grade 8.pptx
Types of Journalistic Writing Grade 8.pptxEyham Joco
 
KSHARA STURA .pptx---KSHARA KARMA THERAPY (CAUSTIC THERAPY)————IMP.OF KSHARA ...
KSHARA STURA .pptx---KSHARA KARMA THERAPY (CAUSTIC THERAPY)————IMP.OF KSHARA ...KSHARA STURA .pptx---KSHARA KARMA THERAPY (CAUSTIC THERAPY)————IMP.OF KSHARA ...
KSHARA STURA .pptx---KSHARA KARMA THERAPY (CAUSTIC THERAPY)————IMP.OF KSHARA ...M56BOOKSTORE PRODUCT/SERVICE
 
CELL CYCLE Division Science 8 quarter IV.pptx
CELL CYCLE Division Science 8 quarter IV.pptxCELL CYCLE Division Science 8 quarter IV.pptx
CELL CYCLE Division Science 8 quarter IV.pptxJiesonDelaCerna
 
CARE OF CHILD IN INCUBATOR..........pptx
CARE OF CHILD IN INCUBATOR..........pptxCARE OF CHILD IN INCUBATOR..........pptx
CARE OF CHILD IN INCUBATOR..........pptxGaneshChakor2
 
Meghan Sutherland In Media Res Media Component
Meghan Sutherland In Media Res Media ComponentMeghan Sutherland In Media Res Media Component
Meghan Sutherland In Media Res Media ComponentInMediaRes1
 
Earth Day Presentation wow hello nice great
Earth Day Presentation wow hello nice greatEarth Day Presentation wow hello nice great
Earth Day Presentation wow hello nice greatYousafMalik24
 

Recently uploaded (20)

भारत-रोम व्यापार.pptx, Indo-Roman Trade,
भारत-रोम व्यापार.pptx, Indo-Roman Trade,भारत-रोम व्यापार.pptx, Indo-Roman Trade,
भारत-रोम व्यापार.pptx, Indo-Roman Trade,
 
18-04-UA_REPORT_MEDIALITERAСY_INDEX-DM_23-1-final-eng.pdf
18-04-UA_REPORT_MEDIALITERAСY_INDEX-DM_23-1-final-eng.pdf18-04-UA_REPORT_MEDIALITERAСY_INDEX-DM_23-1-final-eng.pdf
18-04-UA_REPORT_MEDIALITERAСY_INDEX-DM_23-1-final-eng.pdf
 
ECONOMIC CONTEXT - PAPER 1 Q3: NEWSPAPERS.pptx
ECONOMIC CONTEXT - PAPER 1 Q3: NEWSPAPERS.pptxECONOMIC CONTEXT - PAPER 1 Q3: NEWSPAPERS.pptx
ECONOMIC CONTEXT - PAPER 1 Q3: NEWSPAPERS.pptx
 
Software Engineering Methodologies (overview)
Software Engineering Methodologies (overview)Software Engineering Methodologies (overview)
Software Engineering Methodologies (overview)
 
ECONOMIC CONTEXT - LONG FORM TV DRAMA - PPT
ECONOMIC CONTEXT - LONG FORM TV DRAMA - PPTECONOMIC CONTEXT - LONG FORM TV DRAMA - PPT
ECONOMIC CONTEXT - LONG FORM TV DRAMA - PPT
 
Hierarchy of management that covers different levels of management
Hierarchy of management that covers different levels of managementHierarchy of management that covers different levels of management
Hierarchy of management that covers different levels of management
 
Incoming and Outgoing Shipments in 1 STEP Using Odoo 17
Incoming and Outgoing Shipments in 1 STEP Using Odoo 17Incoming and Outgoing Shipments in 1 STEP Using Odoo 17
Incoming and Outgoing Shipments in 1 STEP Using Odoo 17
 
ESSENTIAL of (CS/IT/IS) class 06 (database)
ESSENTIAL of (CS/IT/IS) class 06 (database)ESSENTIAL of (CS/IT/IS) class 06 (database)
ESSENTIAL of (CS/IT/IS) class 06 (database)
 
internship ppt on smartinternz platform as salesforce developer
internship ppt on smartinternz platform as salesforce developerinternship ppt on smartinternz platform as salesforce developer
internship ppt on smartinternz platform as salesforce developer
 
Alper Gobel In Media Res Media Component
Alper Gobel In Media Res Media ComponentAlper Gobel In Media Res Media Component
Alper Gobel In Media Res Media Component
 
Capitol Tech U Doctoral Presentation - April 2024.pptx
Capitol Tech U Doctoral Presentation - April 2024.pptxCapitol Tech U Doctoral Presentation - April 2024.pptx
Capitol Tech U Doctoral Presentation - April 2024.pptx
 
Enzyme, Pharmaceutical Aids, Miscellaneous Last Part of Chapter no 5th.pdf
Enzyme, Pharmaceutical Aids, Miscellaneous Last Part of Chapter no 5th.pdfEnzyme, Pharmaceutical Aids, Miscellaneous Last Part of Chapter no 5th.pdf
Enzyme, Pharmaceutical Aids, Miscellaneous Last Part of Chapter no 5th.pdf
 
Types of Journalistic Writing Grade 8.pptx
Types of Journalistic Writing Grade 8.pptxTypes of Journalistic Writing Grade 8.pptx
Types of Journalistic Writing Grade 8.pptx
 
KSHARA STURA .pptx---KSHARA KARMA THERAPY (CAUSTIC THERAPY)————IMP.OF KSHARA ...
KSHARA STURA .pptx---KSHARA KARMA THERAPY (CAUSTIC THERAPY)————IMP.OF KSHARA ...KSHARA STURA .pptx---KSHARA KARMA THERAPY (CAUSTIC THERAPY)————IMP.OF KSHARA ...
KSHARA STURA .pptx---KSHARA KARMA THERAPY (CAUSTIC THERAPY)————IMP.OF KSHARA ...
 
TataKelola dan KamSiber Kecerdasan Buatan v022.pdf
TataKelola dan KamSiber Kecerdasan Buatan v022.pdfTataKelola dan KamSiber Kecerdasan Buatan v022.pdf
TataKelola dan KamSiber Kecerdasan Buatan v022.pdf
 
Model Call Girl in Tilak Nagar Delhi reach out to us at 🔝9953056974🔝
Model Call Girl in Tilak Nagar Delhi reach out to us at 🔝9953056974🔝Model Call Girl in Tilak Nagar Delhi reach out to us at 🔝9953056974🔝
Model Call Girl in Tilak Nagar Delhi reach out to us at 🔝9953056974🔝
 
CELL CYCLE Division Science 8 quarter IV.pptx
CELL CYCLE Division Science 8 quarter IV.pptxCELL CYCLE Division Science 8 quarter IV.pptx
CELL CYCLE Division Science 8 quarter IV.pptx
 
CARE OF CHILD IN INCUBATOR..........pptx
CARE OF CHILD IN INCUBATOR..........pptxCARE OF CHILD IN INCUBATOR..........pptx
CARE OF CHILD IN INCUBATOR..........pptx
 
Meghan Sutherland In Media Res Media Component
Meghan Sutherland In Media Res Media ComponentMeghan Sutherland In Media Res Media Component
Meghan Sutherland In Media Res Media Component
 
Earth Day Presentation wow hello nice great
Earth Day Presentation wow hello nice greatEarth Day Presentation wow hello nice great
Earth Day Presentation wow hello nice great
 

H4104461.pdf

  • 1. American Research Journal of Humanities Social Science (ARJHSS)R) 2021 ARJHSS Journal www.arjhss.com Page | 44 American Research Journal of Humanities Social Science (ARJHSS) E-ISSN: 2378-702X Volume-04, Issue-10, pp-44-61 www.arjhss.com Research Paper Open Access Identifying the Domains in Science, Reading and Mathematics in which the U.S. High School Students Perform Lower in PISA. OnderKoklu, Susan J. Cooper, C.DawnMartelli, Megan Atha Florida Gulf Coast University Florida Gulf Coast University Florida Gulf Coast University Florida Gulf Coast University Abstract: The present study aimed to identify mathematics, science and reading item groups and thespecification of items in which U.S. students have a significantly lower level of correct responses compared toall other participants in PISA assessment. For this purpose, 269 items were analyzed by using MultilevelMeasurement Models. Data were obtained from the results of 2015 and 2018 PISA administrations released byOECD. Of the 269 items, 115 were Science,82 were Mathematics, and 72 were Reading items. All 269 itemswere grouped according to various content and cognitive domains. Then, these item groups were analyzed byusing two-level linear measurement models via HLM-6 software with a measurement model using both first andsecond level predictors for each of the three tests separately.Results of the study clearly indicated that the U.S.students performed lower than international average on only one of the three item groups in reading and only oneof the18 item groups in science. On the other hand, the U.S. students performed significantly lower thaninternational average on five of the 12 item groups in mathematics. Key words: Reading, Science, Mathematics, Student achievement, PISA, HLM I. Introduction Robust educational systems rely on accurate data to inform curricular and instructional decision- making. Thus, comparative studies have long been conducted in order to measure the quality and effectiveness of education provided to students all over the world (Kyriakides et al., 2020; Cai, et al., 2016; Vedder, 2020). Educational policymakers, educators, and curriculum designers are able to identify strengths and weaknesses of their educational systems by comparing their students` achievement levels with the students‟ achievement levels in other countries (Hwang, et al., 2018; Klieme, 2020; Afdal, 2019). International studies such as TIMSS and PISA provide good opportunities for educational policymakers, educational researchers and curriculum designers in order to conduct these kind of comparative research studies (Nortvedt, 2018; Cordero et al., 2018; Mullis et.al, 2009). Achievement of the U.S. students in PISA and TIMSS has attracted the attention of researchers, educators, policymakers, and the general public in recent years in the United States (Zhang &Bray, 2020; Elliott, et al., 2019; Grabau&Ma, 2017; Han, 2017). Consequently, there is a growing body of research on factors linked to achievement. Although effects of these factors on student achievement have been hypothesized and investigated for the past two decades, few attempts have been made to systematically investigate how content and cognitive domains are related to achievement. Thus, there are limited consistent and robust findings on content and cognitive factors related to achievement. With continuous improvement as a goal, the Organization for Economic Cooperation and Development (OECD) developed the Programme for International Student Assessment (PISA) in 2000. PISA is an international assessment administered to 15-year-old students every three years to measure reading, mathematics, and science literacy as well as cross-curricular competencies, such as collaborative and creative problem-solving (NCES, 2020).Through these foci, PISA has been designed measure how well students can apply knowledge obtained both various learning contexts to real-world tasks as they are nearing the end of formal schooling (Cogan et al., 2019; She et al., 2018).The most recent administration was conducted in 2018,and over 600,000 students participated across 79 countries (OECD, 2020).
  • 2. American Research Journal of Humanities Social Science (ARJHSS)R) 2021 ARJHSS Journal www.arjhss.com Page | 45 Most PISA research focuses on domain-level differences across countries with analyses differentiating for student characteristics such as gender and socioeconomic status (Cooper &Berry, 2020; Hwang &Yeo, 2020; Thien, 2016; Teig et al., 2020). Additionally, research tends to also focus on how PISA results correlate to other standardized measures such as the National Assessment of Educational Progress (NAEP) or the Trends in InternationalMathematics and Science Study (TIMMS). While such work is important forinforming policy reform, rarely do findings from such research inform instructionaldecision-making in U.S. classrooms. If U.S. performance is to improve oninternational measures such as the PISA, a more thorough analysis of student performance at the item-level is warranted. Such research is scant. However, one recent study examined how spatial cognition as measured by the space and shape domain related to overall performance on the mathematics portion of the test. Sorby and Panther (2020) analyzed trends among high-performing countries and other countries of interest finding that success on PISA items is significantly correlated with scores on tests of spatial cognition. The authors suggested improving spatial skills could be an overlooked strategy for improving student performance on PISA (and by extension for improving preparedness for life). More research that uses item-level analysis to inform instructional practices is needed. Similarly, the present study aimed to identify mathematics, science and reading item groups and the specification of items in which U.S. students have a significantly lower level of correct responses compared to all other participants in PISA assessment. Considering the purpose, specific research questions are: 1. Considering content and cognitive domains, on which item groups do U.S. students perform statistically significantly lower than students from other participant countries on the reading assessment? 2. Considering content and cognitive domains, on which item groups do U.S. students perform statistically significantly lower than students from other participant countries on the science assessment? 3. Considering content and cognitive domains, on which item groups do U.S. students perform statistically significantly lower than students from other participant countries on the mathematics assessment? II. Method The main objective is to identify specific item groups in which statistically significant differences exist between the U.S. students‟ and other participants‟ science, mathematics and reading performances. For this purpose, 269 items, which were released by OECD, were analyzed by using Multilevel Measurement Models via HLM-6 software (Raudenbush, 2004). In the analysis of the data, the mean percent correct information for all of the items were used on a continuous scale between 0 and 100. The same scale is used for open-ended questions. Although open-ended items include partial credits, mean percent correct information represented the rates for “full credit” responses. These percent correct rates also comprised the dependent variable of two level linear hierarchical models. 2.1. Data Program for International Student Assessment (PISA) is a measurement instrument developed and administered by The Organization for Economic Cooperation and Development (OECD). PISA has been administered worldwide since 2000 in three-year periods to measure 15-year-olds‟ ability to use their reading, mathematics and science knowledge and skills to meet real-life challenges (OECD, 2019). Data from 269 items were obtained from publicly provided results of 2015 and 2018 PISA administration released by OECD. Of the 269 items, 115 were Science, 82 were Mathematics, and 72 were Reading items. 2.2. Tests’ Frameworks 2.2.1. Science Assessment: The science assessment framework for PISA-2018 is organized around three dimensions: a system dimension specifying the domains of systems or subject matter to be assessed within science, a knowledge dimension specifying the type of knowledge to be assessed and a competency dimension specifying the sets of behaviors expected of students as they engage with the science content (Table-1). Distribution of total 115 science items can be seen in table-2 below.
  • 3. American Research Journal of Humanities Social Science (ARJHSS)R) 2021 ARJHSS Journal www.arjhss.com Page | 46 Table 1. PISA Science Test System, Knowledge and Competency Domains System Domain Knowledge Domain Competency Domain (1) Living Systems  Cells (e.g., structures and function, DNA, differences between plant and animal cells)  The concept of an organism (e.g., unicellular vs. multicellular)  Humans (e.g., health; nutrition; subsystems such as the digestive, the respiratory, the circulatory, the excretory and the reproductive and their relationship)  Populations (e.g., species, evolution, biodiversity, genetic variation)  Ecosystems (e.g., food chains, matter and energy flow)  Biosphere (e.g., ecosystem services, sustainability) (1) Content: The content knowledge that PISA assesses is selected from the major fields of physics, chemistry, biology, and earth and space sciences. (1) Explain: Explain phenomena scientifically. (2) Physical Systems  Structure of matter (e.g., particle model, bonds).  Properties of matter (e.g., changes of state, thermal and electrical conductivity).  Chemical changes of matter (e.g., chemical reactions, energy transfer, acids/bases).  Motion and forces (e.g., velocity, friction) and action at a distance (e.g., magnetic, gravitational and electrostatic forces).  Energy and its transformation (e.g., conservation, dissipation, chemical reactions).  Interactions between energy and matter (e.g., light and radio waves, sound and seismic waves). (2) Procedural: It is this knowledge of the standard concepts and procedures essential to scientific enquiry that underpins the collection, analysis and interpretation of scientific data. (2) Interpret: Interpret data and evidence scientifically. (3) Earth and Space  Structures of the Earth (e.g., lithosphere, atmosphere, hydrosphere).  Energy in the Earth (e.g., sources, global climate).  Change in the Earth (e.g., plate tectonics, geochemical cycles, constructive and destructive forces).  Earth‟s history (e.g., fossils, origin and evolution).  Earth in space (e.g., gravity, solar systems, galaxies).  The history and scale of the Universe and its history (e.g., light year, Big Bang theory). (3) Epistemic: Epistemic knowledge is a knowledge of the constructs and defining features essential to the process of knowledge building in science (e.g. hypotheses, theories and observations) and their role in justifying the knowledge produced by science. (3) Evaluate: Evaluate and design scientific enquiry Table 2. Distribution of science items used in PISA-2018 by subdomains. Systems Knowledge Competency Number of Items Living Systems Content Explain 18 18 47 Interpret Evaluate Procedural Explain 3 22 Interpret 12 Evaluate 7 Epistemic Explain 7 Interpret 2 Evaluate 5 Physical Systems Content Explain 14 17 38 Interpret 3 Evaluate Procedural Explain 1 14 Interpret 4 Evaluate 9 Epistemic Explain 7
  • 4. American Research Journal of Humanities Social Science (ARJHSS)R) 2021 ARJHSS Journal www.arjhss.com Page | 47 Interpret Evaluate 7 Earth and Space Systems Content Explain 12 14 30 Interpret 2 Evaluate Procedural Explain 11 Interpret 11 Evaluate Epistemic Explain 1 5 Interpret 2 Evaluate 2 2.2.2. Mathematics Assessment: The mathematics assessment framework for PISA-2018 is organized around two dimensions: a content dimension specifying the domains or subject matter to be assessed within mathematics and a process dimension specifying the domains or thinking processes to be assessed (Table-3). The cognitive process domains describe the sets of behaviors expected of students as they engage with the mathematics content. Distribution of total 82 math items can be seen in table-4 below. Table 3.PISA Mathematics Test Content, and Cognitive Process Domains Content Domain Process Domain (1) Space and Shape (1) Employ: Employing Mathematical Concepts, Facts and Procedures. (2) Quantity (2) Interpret: Interpreting, Applying and Evaluating Mathematical Outcomes. (3) Change and Relationships (3) Formulate: Formulating Situations Mathematically (4) Uncertainty and Data Table 4. Distribution of mathematics items used in PISA-2018 by subdomains. Space and Shape Quantity Change and Relationships Uncertainty and Data TOTAL Employ 8 12 10 5 35 Interpret 1 6 5 11 23 Formulate 10 3 7 4 24 TOTAL 19 21 22 20 82 2.2.3. Reading Assessment: The reading assessment framework for PISA-2018 is organized around two dimensions: a subordinate category dimension specifying the essential cognitive components of reading to be assessed, a cognitive process dimension specifying the sets of behaviors expected of students as they engage with reading (Table-5). Distribution of total 72reading items can be seen in table-6 below. Since the data could not be obtained for each of the cognitive process seen in table-5 below, number of test items were only categorized by subordinate categories.
  • 5. American Research Journal of Humanities Social Science (ARJHSS)R) 2021 ARJHSS Journal www.arjhss.com Page | 48 Table 5. PISA Reading Test Dimensions Subordinate Category Cognitive Processes (1) Locating Information On a daily basis, readers most often use texts for purposes that require the location of specific information, with little or no consideration for the rest of the text. Locating information is an obligatory component of reading when using complex digital information such as search engines and websites  Accessing and retrieving information within a text.  Searching for and selecting relevant text. (2) Understanding A large number of reading activities involve the parsing and integration of extended passages of text in order to form an understanding of the meaning conveyed in the passage.  Representing literal meaning.  Integrating and generating inferences. (3) Evaluating and Reflecting Reasoning beyond the literal or inferred meaning of the text. Reflecting on the content and form of the text and critically assessing the quality and validity of the information therein.  Assessing quality and credibility.  Reflecting on content and form.  Detecting and handling conflict. Table 6. Distribution of reading items used in PISA-2018 by categories. Subordinate Category Number of Items Locating Information 14 Understanding 41 Evaluating and Reflecting 17 2.3. Establishing item groups and coding In the Science test, considering the “System”domain (3 groups), “Knowledge”domain (3 groups), and “Competency” domain (3 groups), a total of 27 (3x3x3) item groups can be made up for expressing all futures of each individual items. However, nine of those item groups have no items (i.e., questions) (see Table-2). Therefore, only 18 of these item groups can be found explaining the 115science items. In order to represent these groups in a systematic and more understandable way, an index made up by using letter and number codes. For example, the item group “Living Systems-Procedural-Evaluate” is indicated as (S_S1_K2_C3) meaning “Science, System-1, Knowledge-2, Competency-3” by using codes shown in Table 1. Similarly, in the Mathematics test, item groups were established considering the “Content” domain (4 groups) and “Process” domain (3 groups) (see Table-3). A total of 12 (4x3) item groups were made up for expressing all futures of 82 items used in mathematics test. In order to represent these groups in a systematic and more understandable way, an index made up by using letter and number codes. For example, the item group “Quantity-Formulate” is indicated as (M_C2_P3) meaning “Math, Content-2, Process-3” by using codes shown in Table 3. Finally, in the Reading test, item groups were established considering the “Subordinate Category” domain (3 groups) as seen in table-5. Although, there is another dimension called “Cognitive process” in specifications of reading items seen in Table-5, data could not be obtained for each of these categories. Therefore, number of test items were only categorized by subordinate categories. A total of three item groups were made up for expressing all futures of 72 items used in the reading test. In order to represent these groups in a systematic and more understandable way, an index made up by using letter codes. For example, the item group “Locate” is indicated as (R_L) meaning “Reading, Locate”. These item groups were used as indicator variablesin the first level of two-level linear hierarchical measurement model. If an item belongs to a group represented by indicator variable it was coded as “1” otherwise it was coded as “0”. In the second step of two-level linear hierarchical measurement model,another indicator variable was made up to be able to identify “U.S.” among other participant countries. This indicator variable was coded as “1” for “U.S.” and “0” for the remaining participants. 2.4. Data Analysis Data used in this study were filtered and reorganized as result of series of phases. All 269items (115 science, 82 math and 72 reading) were grouped according to various domains. Then, these item groups were analyzed by using Multilevel Measurement Models for science, math, and reading separately. First, the mean correct responses of obtained items for each participant country were obtained from OECD‟s database. Then,
  • 6. American Research Journal of Humanities Social Science (ARJHSS)R) 2021 ARJHSS Journal www.arjhss.com Page | 49 items in three tests (science, math and reading) were grouped and coded as explained in previous section. In the third stage, data obtained from first and second stages were combined via SAS program and data files needed for the next phase were made up. Finally, data were analyzed by using two-level linear measurement models via HLM-6 software (Raudenbush, 2004) for each of the three tests separately. Average rate of correct response variable is continuous dependent variable in this model. This variable is expressed as a percentage within the scale between 0 and 100.According to multilevel linear measurement model defined by Kamata, Bauer and Miyazaki (2008), the average correct responses for item groups are nested in individual participants. In this study, the same methodology was followed but average correct responses for item groups were nested in groups of individuals. First level of the two-level measurement model is shown in Equation 1 in which “i” indicates item (i = 1, 2,..., İ), “j” indicates group of individuals (j = 1, 2,..., J) and k indicates predictor (k = 1, 2,..., K). 0 1 1 2 2 ( 1) ( 1) ... ij j j ij j ij k j k ij Kj Kij ij Y D D D D                Eq. 1 In this equation, ij Y represents predicted outcome indicating average correct response of individuals in group “j” for item “i” in the test. Similarly, kij D represents value of item “i” for predictor variable “k”. In other words, it is an indicator variable that represents the item group where item “i” is.Parameter kj  represents the effect of the predictor variable “k”. Basically, it indicates the average rate of correct response of individual in group “j” for item “i”. Similarly, ij  represents the error for achievement levels of individuals in group “j” for item group “i”. Parameters such as 0 j  and kj  presented in the first level of the model are defined as dependent variables in the second level of the model. In this case the second level of the model was formulized as follows. 0 01 0 1 10 11 2 20 21 ( 1) ( 1)0 ( 1)1 0 ( ) ( ) ( ) . . . ( ) j j j j j j j k j k k j Kj K grup r grup grup grup                          Eq. 2 In the equation, parameters 10  , 20  , ( 1)0 k   and 0 K  present the rate of correctresponses for each item group and they don‟t change by groups. The term 0 j r indicates achievement levels of groups. As aimed in this study, the purpose is to compare average correct response rates of item groups in level two. Therefore, an indicator variable was added to the model as shown in Equation 2 in level two. Here, ( )j grup is an indicator variable with two categories. While the focal group takes the value 1, reference group takes value 0. Coefficients 10  , 20  , ( 1)0 k   and 0 K  represent mean correct response of item groups for reference category. Coefficient 01  represents the difference between mean correct responses for focal and reference groups for selected reference item group (last item group above). Coefficients 11  , 21  and ( 1)1 k   represent the difference between mean correct responses for focal and reference groups for remaining item groups and is computed as deviation from coefficient 01  .Coefficient 01  is called the main effect since it shows the achievement level differencesbetween groups in terms of reference item while coefficients 11  , 21  and ( 1)1 k   are called interaction effects since they represent the deviation of achievement differences between groups from main effect. Therefore,the sum of the main effect and interaction effects give the total effect. Interaction effects mentioned here are called “cross-level interaction effect” in statistical literature and mentioned as fundamental advantage of hierarchical modeling over traditional modeling (Raudenbush&Bryk; 2002). III. Results 2.5. Two Level Measurement Model with Level-One Predictors Only Analysis of data using this model reveals both average correct response for each item group and achievement levels of all PISA participant countries. The predicted average rate of correct responses and standard errors are shown in Table7, Table8, and Table9 below for science, math and reading respectively.
  • 7. American Research Journal of Humanities Social Science (ARJHSS)R) 2021 ARJHSS Journal www.arjhss.com Page | 50 Table 7. Item Groups Descriptive for Science Item Groups Number of Items Predicted Average Percent Correct (%) Standard Error S_S1_K1_C1 18 45.45 1.78 S_S1_K2_C1 3 33.36 1.45 S_S1_K2_C2 12 51.59 1.77 S_S1_K2_C3 7 52.82 1.94 S_S1_K3_C2 2 56.71 1.95 S_S1_K3_C3 5 31.66 1.88 S_S2_K1_C1 14 47.3 1.79 S_S2_K1_C2 3 44.97 2.13 S_S2_K2_C1 1 22.81 1.35 S_S2_K2_C2 4 65.92 1.82 S_S2_K2_C3 9 50.25 2.01 S_S2_K3_C3 7 33.73 1.56 S_S3_K1_C1 12 42.61 1.91 S_S3_K1_C2 2 46.25 1.92 S_S3_K2_C2 11 53.27 1.86 S_S3_K3_C1 1 18.8 1.41 S_S3_K3_C2 2 33.77 1.67 S_S3_K3_C3 2 65.89 1.77 Table 8. Item Groups Descriptive for Mathematics Item Groups Number of Items Predicted Average Percent Correct (%) Standard Error M_C1_P1 8 35.68 1.66 M_C1_P2 1 78.82 1.34 M_C1_P3 10 22.02 1.32 M_C2_P1 12 49.97 1.87 M_C2_P2 6 55.05 1.53 M_C2_P3 3 43.96 1.96 M_C3_P1 10 40.83 1.39 M_C3_P2 5 49.98 1.81 M_C3_P3 7 31.06 1.41 M_C4_P1 5 46.02 1.47 M_C4_P2 11 50.62 1.86 M_C4_P3 4 32.48 1.9 Table 9. Item Groups Descriptive for Reading Item Groups Number of Items Predicted Average Percent Correct (%) Standard Error R_L 14 55.62 1.67 R_U 41 54.50 1.71 R_E 17 53.37 1.54 Predicted within-participants variance, 2 ̂ , and predicted between-participants variance, 00 ˆ  , were computed for each of the three tests in order to calculate reliability coefficient for predictions. The following tables (Table 10, Table 11, and Table 12) shows those variances for each of the 3 tests. Table 10.Science: Two Level Measurement Model with Level-One Predictors Only Random Effect Parameter Variance Degrees of Freedom (df) Chi-Square value p- value Level-2 Error Term 00 ˆ  95.24 35 4382.17 <0.001 Level-1 Error Term 2 ̂ 149.53 Table 11.Math: Two Level Measurement Model with Level-One Predictors Only Random Effect Parameter Variance Degrees of Freedom (df) Chi-Square value p- value Level-2 Error Term 00 ˆ  102.31 35 4511.24 <0.001
  • 8. American Research Journal of Humanities Social Science (ARJHSS)R) 2021 ARJHSS Journal www.arjhss.com Page | 51 Level-1 Error Term 2 ̂ 156.82 Table 12. Reading: Two Level Measurement Model with Level-One Predictors Only Random Effect Parameter Variance Degrees of Freedom (df) Chi-Square value p- value Level-2 Error Term 00 ˆ  77.24 34 3974.62 <0.001 Level-1 Error Term 2 ̂ 80.59 As indicated in the above tables, obtained variances are statistically significant (p-value <0.001) in 0.05 alpha level. The reliability coefficient, r̂ , of predicted achievement levels of all PISA participants were calculated for each of the three tests by using the formula shown below. Reliability coefficients were found as 0.92, 0.88, 0.75 for science, math and reading respectively. 2.6. Two Level Measurement Model with Level-One and Level-Two Predictors Both the average rate of correct responses and the standard errors for each item group for all PISA participants (36, including the U.S.) were predicted by previous model. Achievement level differences between the U.S. and all other participants for each item group were predicted and tested statistically by this model. Predicted differences in average rate of correct responses, standard errors, and p-values were given in Table13. In the table, while p-values in blue colored cells show statistically significant differences, orange colored rows indicate item groups on which U.S. students significantly lower than international average. Table 13. Predicted Differences in Average Rate of Correct Responses Between the United States and Other PISA Participants and Standard Errors. Item Groups Numbe r of Items Predicted Average Percent Correct Predicted Difference in Percent Correct Standard Error P-Value Number of countries higher than U.S. Number of countries lower than U.S. S_S1_K1_C 1 18 45.45 +2.86 1.78 0.0030 10 26 S_S1_K2_C 1 3 33.36 +3.27 1.45 0.0000 11 25 S_S1_K2_C 2 12 51.59 +1.52 1.77 0.1320 15 21 S_S1_K2_C 3 7 52.82 +1.80 1.94 0.0481 11 25 S_S1_K3_C 2 2 56.71 +1.82 1.95 0.1888 15 21 S_S1_K3_C 3 5 31.66 +2.25 1.88 0.0540 16 20 S_S2_K1_C 1 14 47.3 +3.11 1.79 0.0046 12 24 S_S2_K1_C 2 3 44.97 -3.19 2.13 0.0342 24 12 S_S2_K2_C 1 1 22.81 +1.15 1.35 0.3680 17 19 S_S2_K2_C 2 4 65.92 +4.21 1.82 0.0007 11 25 S_S2_K2_C 3 9 50.25 +3.13 2.01 0.0018 11 25 S_S2_K3_C 3 7 33.73 +3.30 1.56 0.0000 11 25 S_S3_K1_C 1 12 42.61 +2.68 1.91 0.0161 12 24 S_S3_K1_C 2 2 46.25 +3.76 1.92 0.0059 14 22 S_S3_K2_C 2 11 53.27 +4.90 1.86 0.0000 8 28 S_S3_K3_C 1 1 18.8 +2.32 1.41 0.0002 7 29 S_S3_K3_C 2 2 33.77 +1.75 1.67 0.0795 13 23 S_S3_K3_C 3 2 65.89 +3.57 1.77 0.0001 9 27 M_C1_P1 8 35.68 -3.08 1.66 0.0066 29 7 M_C1_P2 1 78.82 -1.44 1.34 0.1658 28 8 M_C1_P3 10 22.02 -3.25 1.32 0.0002 28 8 M_C2_P1 12 49.97 -2.84 1.87 0.0114 30 6 M_C2_P2 6 55.05 -2.08 1.53 0.0396 27 9 M_C2_P3 3 43.96 -1.77 1.96 0.0597 28 8 M_C3_P1 10 40.83 -1.22 1.39 0.0801 24 12 M_C3_P2 5 49.98 +1.13 1.81 0.4239 22 14 M_C3_P3 7 31.06 -1.74 1.41 0.0743 27 9 M_C4_P1 5 46.02 +1.31 1.47 0.9303 20 16 M_C4_P2 11 50.62 -1.97 1.86 0.0840 27 9 M_C4_P3 4 32.48 -3.42 1.9 0.0397 29 7 R_L 14 55.62 -1.6 1.67 0.1092 18 17 R_U 41 54.5 +2.03 1.71 0.0315 12 23 R_E 17 53.37 +4.71 1.54 0.0000 3 32
  • 9. American Research Journal of Humanities Social Science (ARJHSS)R) 2021 ARJHSS Journal www.arjhss.com Page | 52 2.7. Results for Science Overall, the results from the current study revealed that the U.S. students have performed well in science assessment compared to other participants. Specifically, the U.S. students have performed significantly higher than international average on 11 of the 18 item groups in science. Similarly, they performed higher than international average on six item groups although the differences were not significant. Data analysis also revealed that while students from12 countries have performed better than U.S. students on these 17 item groups, students from 23 countries have performed lower than the U.S. students. On the other hand, U.S. students have performed significantly lower than international average on only one of the 18 item groups in science. As seen in table-13, average percent correct responses of U.S. students on the item group S_S2_K1_C2 (Physical Systems / Content Knowledge / Interpret) was 3.19 percent lower than the international average. Sample items in this group can be seen in the following figures (figures-1-4). Data analysis also revealed that while students from 26 countries have performed better than U.S. students on this item group, U.S. students have performed better than only 11 of 35 countries. Figure-1. Sample Science Item in Physical Systems / Content Knowledge / Interpret Item Group Figure-2. Sample Science Item in Physical Systems / Content Knowledge / Interpret Item Group Figure-3. Sample Science Item in Physical Systems / Content Knowledge / Interpret Item Group
  • 10. American Research Journal of Humanities Social Science (ARJHSS)R) 2021 ARJHSS Journal www.arjhss.com Page | 53 Figure-4. Sample Science Item in Physical Systems / Content Knowledge / Interpret Item Group Differences between averages and standard deviations were computed for this item group in order to see the differences on individual items by using the information in OECD reports.It was clearly observed that participants from U.S. performed lower than the other participants in all of the items in the S_S2_K1_C2 item group. Effect size, as seen in the last column of Table14, shows the differences by using standard deviation scale. Effect size was calculated by dividing differences between averages by standard deviation. For example, effect size belonging to item CS413Q05S was found to be (-0.86) which means achievement level of the U.S. participants is approximately one standard deviation lower than the average achievement level. Table 14. Average Scores for Items in Physical Systems / Content Knowledge / Interpret Group. Item Average (US) Average (International) Difference SD Effect Size of the Difference CS413Q06S 31.02 33.17 -2.15 9.37 -0.23 CS413Q04S 38.69 40.28 -1.58 10.41 -0.15 CS413Q05S 59.05 64.87 -5.82 6.73 -0.86 2.8. Results for Mathematics Results of the study clearly showed that U.S. students have more difficulties in mathematics assessment comparing to science and reading assessment. Particularly, the U.S. students performed significantly lower than the international average on 5 of the 12 item groups in mathematics(Space and Shape/Employ, Space and Shape/Formulate, Quantity/Employ, Quantity/Interpret, Uncertainty and Data/Formulate). Sample items in these groups can be seen in the following figures (figures-5-9).Data analysis also revealed that while students from 28 countries have performed better than U.S. students on these 10 item groups, students from only seven countries
  • 11. American Research Journal of Humanities Social Science (ARJHSS)R) 2021 ARJHSS Journal www.arjhss.com Page | 54 have performed lower than the U.S. students.On the other hand, U.S. students didn‟t perform significantly higher than international average on any of the 12 item groups in mathematics. Figure-5. Sample Math Item in “Space and Shape/ Formulate” Item Group Figure-6. Sample Math Item in “Space and Shape / Employ” Item Group Figure-7. Sample Math Item in “Quantity / Employ” Item Group
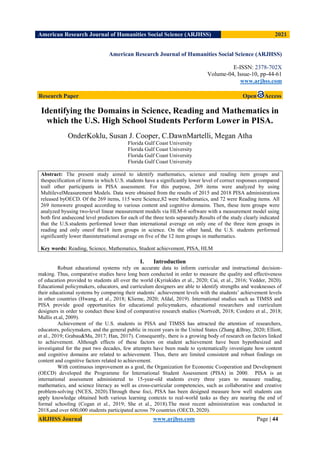
  • 12. American Research Journal of Humanities Social Science (ARJHSS)R) 2021 ARJHSS Journal www.arjhss.com Page | 55 Figure-8. Sample Math Item in “Quantity / Interpret” Item Group Figure-9. Sample Math Item in “Uncertainty and Data / Formulate” Item Group 2.9. Results for Reading Results of the present study indicated that U.S. students performed considerably better on the reading portion of the test when compared to their performance on the mathematics and science assessments. In particular, the U.S. students performed lower than the international average on only one of the 3-item groups in reading (R_L) (Locating Information), although this difference is not statically significant. Sample items in this group can be seen in the following figures (Figures10-12). Data analysis also revealed that while students from 18 countries have performed better than U.S. students on that item group, students from 17 countries have performed lower than the U.S. students. On the other hand, U.S. students performed significantly higher than international average on the other two item groups in reading (R_U and R_E) (Understanding and Evaluating/Reflecting). As seen in table-13, U.S. students performed higher than international average on only two of the item groups although the differences were not significant.
  • 13. American Research Journal of Humanities Social Science (ARJHSS)R) 2021 ARJHSS Journal www.arjhss.com Page | 56 Figure-10. Sample Reading Item in “Locating Information” Item Group Figure-11. Sample Reading Item in “Locating Information” Item Group Figure-12. Sample Reading Item in “Locating Information” Item Group The differences between averages and standard deviations were computed for this item group in order to see the differences on individual items by using the information in OECD reports. Considering this information, it was clearly observed that participants from U.S. performed significantly lower than the other
  • 14. American Research Journal of Humanities Social Science (ARJHSS)R) 2021 ARJHSS Journal www.arjhss.com Page | 57 participants in three items in R_L item group. Effect size, as seen in the last column of Table15, shows the differences in a more meaningful format by using standard deviation scale. Effect size was calculated by dividing differences between averages by standard deviation. For example, effect size belonging to item DR420Q02C was found to be (-1.30) which means achievement level of the U.S. participants more than one standard deviation lower than the average achievement level. IV. Discussion and Conclusion As we examine examples from all around the world, we should consider that fundamental reform movements in curriculum involving revisions and changes have been made for the last couple of decades in the United States at both the national and state levels. International measurement studies such as PISA are indispensable tools to be able to better understand the resulting effects of these U.S. curriculum reforms and changes in long run. From this perspective, results of this study are important to understand the effects of these curriculum reforms by comparing the students‟ achievement levels in PISAScience, Reading andMathematics tests administered in 2018. Therefore, the aim of this study was to investigate and identify the item groups that reveal statistically significant differences in achievement levels between participants from the U.S. and the participants from the rest of the other countries. For this purpose, PISA items were analyzed by two-level linear hierarchical measurement model. The PISA test scores did not bring great news about the American education system, as the United States continues to remain under international mean for mathematics and around the international mean for reading and science. On the mathematics section, the U.S. scores significantly below the economically developed countries in Europe and Asia. Compared to previous years the PISA scores on math are still somewhat poor while science and especially reading scores are higher. The consistent finding has been that American high school students perform less well in mathematics than their peers in many other countries. We are not keeping up with our global counterparts, though the world is becoming increasingly interconnected and interdependent. We performed slightly above the OECD average in reading and science (our scores have remained unchanged in almost two decades while our counterparts' scores rose) but performed well below average in mathematics. Analysis of data showed that almost all student science responses fell within the predicted range. The exception was item group S2_K1_C2, which refers to interpretation of content in physical systems. There were only 3 items in this group. Physical systems refer to content learned in chemistry and physics course work. The content includes the facts, concepts, and basic theories required to understand physical systems. Correct responses required students to interpret information in the context provided. Interpretation involves analysis and evaluation of data, the recognition that scientific evidence is uncertain, and that argumentation is needed to come to a consensus about the meaning of the data. Further, interpretation may require students to make predictions or suggest cause and effect relationships based on data. In general, students in the United States are required to take three science credits in high school. In some instances, all three of the science courses taken in high school may be related to living systems or earth and space systems, and not physical systems. There are many reasons for this, including the fact that in many states only biology has a high-stakes test requirement (Nolin&Parr, 2013; Momsenet al., 2010). In addition, students may be more familiar with living systems content due to their experiences in elementary and middle school. Further, courses such as chemistry and physics that are related to physical systems may be taught by out-of-field teachers. Sometimes students rely on memorization of important facts, concepts, and theories in physical systems courses so they lack the understanding required to interpret data effectively. (Dega, 2019; Dewi&Primayana, 2019) Teaching physical systems content in context would benefit student understanding and improve science literacy by relating content knowledge to the real world. Every day, reflective citizens make decisions regarding their personal health and the environment, so they would benefit from learning how to interpret data effectively. Analysis of data showed that the U.S. students have performed considerably better in reading test comparing to mathematics and science assessments. Particularly, the U.S. students performed lower than international average on only one of the 3 item groups in reading (R_L) (Locating Information), although this difference is not statically significant. Reading literacy, in PISA 2018, is defined as one‟s capacity to understand, use, evaluate, reflect on, and engage with multiple texts, in a variety of formats, and across disciplines to achieve one‟s goals; develop one‟s knowledge and potential; and participate in society (OECD, 2019). PISA assessments in reading have changed to include multiple texts to reflect the “information-rich digital world,” reflecting the evolution and growing influence of technology. Reading involves not only the printed page but also digital formats. It requires readers to distinguish between fact and opinion, synthesize and interpret texts from multiple sources, and deal with conflicting information across multiple disciplines. Analysis of data in this study showed that the U.S. studentshave performed considerably better in the reading test compared to mathematics and science assessments.
  • 15. American Research Journal of Humanities Social Science (ARJHSS)R) 2021 ARJHSS Journal www.arjhss.com Page | 58 Literacy research has moved from a content area reading approach to a disciplinary reading approach in which strategies that are distinctive to specific disciplines are used to help students comprehend discipline-based texts (Milojević, 2020; Feng et al., 2019; Wandasari et al., 2019). Content area reading focuses on general comprehension skills and study skills, rather than engaging students into reading like disciplinary experts. Disciplinary literacy emphasizes that literacy and text are specialized and unique across the disciplines (Rainey, Maher and Moje, 2020; Windschitl, 2019). For example, scientists engage in very different approaches to reading than historians, and one can easily distinguish a math text from a literary one. Teaching literacy with a disciplinary literacy approach requires different reading strategies. Disciplinary literacy encourages students to grasp the ways literacy is used to create, disseminate, and critique information in the various disciplines. Students need to be immersed in the language and thinking processes of that discipline, learn the content in each discipline, and understand how and why reading and writing are used in each discipline. The Common Core State Standards (CCSS) highlights that every teacher is a reading and writing teacher in their discipline (Hayden&Eades-Baird, 2020; Lechtenberg et al., 2020). It established disciplinary literacy goals to be introduced in the early sixth and seventh grades and to be mastered by twelfth grade. However, traditional efforts to encourage every content area teacher to be a reading teacher have not been widely accepted by teachers in the disciplines and not effective in raising reading achievement on a broad scale. Disciplinary literacy is often a new and unfamiliar approach to students starting the middle grades. Students struggling to learn to read in the early grade levels can quickly fall behind when reading to learn in the secondary grade levels. Establishing an appropriate curriculum for teacher preparation is a necessary component for improving disciplinary literacy teaching for middle and high school students. There is also a need for explicit literacy standards for teachers who teach in the disciplines along with sufficient resources to help guide their teaching in varied disciplinary literacy contexts. Lastly, a key component to change includes a literacy curriculum that guides students to better meet the specific demands of reading and writing in the disciplines than has been provided by traditional conceptions of content-area reading. Mathematics is an area where American students have always struggle (Schoenfeld, 2020; Frederick, 2020; Cuenca-Carlino, Freeman-Green et al., 2016; Barbieri &Booth, 2016). Results of this study suggested that the U.S. students performed significantly below the OECD average. Our productivity is below the OECD average and must be improved. Finland, Germany, Switzerland well outperform the U.S., for example. In a detailed analysis the data revealed that the U.S. students performed significantly lower than international average on 5 of the 12 item groups in mathematics (Space and Shape/Employ, Space and Shape/Formulate, Quantity/Employ, Quantity/Interpret, Uncertainty and Data/Formulate). Over 30 years of nationwide standardized testing, the mathematics scores of U.S. high school students have barely shifted (Marsh et al., 2018; Woessmann, 2016). The findings of the present study indicate that U.S. students mostly performed lower in the contents of “Space and Shape,” “Quantity,” and “Uncertainty and Data.” Numerous possible reasons can be listed for the failure in so many content areas. One likely reason for students‟ limited mastery of quantity, for instance, is that many U.S. teachers lack a firm conceptual understanding of fractions and division. In several studies (Coetzee&Mammen, 2017; Bentle&Bossé, 2018), it has been expressed that the majority of elementary, middle school, high school and even college studentshave problems to generate explanations for solving division problems with fractions. In contrast, most teachers in Japan and China generated two or three explanations in response to the same question Coetzee&Mammen, 2017; Bentley&Bossé, 2018). One reason for the failure in geometry can be explained by student tendency to consider geometrical objects as material objects and specific pictures rather than as theoretical, ideal objects which bear specific properties (Antonini, 2018; Seah&Horne, 2019). This difficulty results to the phenomenon of students trying to solve geometrical problems often relying on the visual perception of the given geometrical figure rather on a mathematical deduction based on the properties of the geometrical objects involved. This is called „geometrical figure to figural concept‟ difficulty (Fischbein, 1993) Some other reasons for students‟ low performances in mathematics can be listed such as (1) difficulties in formulating situations mathematically, such as representing a situation mathematically, recognizing mathematical structure (including regularities, relationships, and patterns) in problems (Rahmawati&Retnawati, 2019; Jupri&Drijvers, 2016), (2) difficulties in evaluating the reasonableness of a mathematical solutions in the context of a real-world problem (Sawatzki&Sullivan, 2018; Kanthawat et al., 2019), (3) difficulties in understanding nonroutine (uncommon) problems completely(Fortes &Andrade, 2019; Chong et al., 2018; Murphy et al., 2019). In order to better understand and identify specific reasons for this low performance, further qualitative case studies should be conducted with high school students in different achievement levels. More importantly, teacher educators, policy makers and teachers must analyze the quality of the instruction versus the quantity of learning time spent. Finally, PISA results clearly showed that students from the United States demonstrated learning gains across all three subjects from 2015 to 2018, although the gains were slight and statistically insignificant.
  • 16. American Research Journal of Humanities Social Science (ARJHSS)R) 2021 ARJHSS Journal www.arjhss.com Page | 59 Nonetheless, the gains were sufficient enough to move U.S. reading and science scores above the OECD average. Math scores remained below the OECD average (NCES, 2020). This study clearly identified content and cognitive domains in which the U.S. students have performed significantly lower than international average. Therefore, the results of this study are important for teacher training programs, educational policy makers and teachers to be able to examine and identify possible reasons for these low performances in specific areas. References [1]. Afdal, H. W. (2019). The promises and limitations of international comparative research on teacher education. European Journal of Teacher Education, 42(2), 258-275. [2]. Antonini, S. (2018). Figural concepts in proving by contradiction. Quadrante, 27(2), 115-132. [3]. Barbieri, C., & Booth, J. L. (2016). Support for struggling students in algebra: Contributions of incorrect worked examples. Learning and Individual Differences, 48, 36-44. [4]. Bentley, B., &Bossé, M. J. (2018). College students' understanding of fraction operations. International Electronic Journal of Mathematics Education, 13(3), 233-247. [5]. Cai, J., Mok, I. A., Reddy, V., & Stacey, K. (2016). International comparative studies in mathematics: Lessons for improving students’ learning. Springer Nature. [6]. Chong, M. S. F., Shahrill, M., Putri, R. I. I., &Zulkardi. (2018, April). Teaching problem solving using non-routine tasks. In AIP Conference Proceedings (Vol. 1952, No. 1, p. 020020). AIP Publishing LLC. [7]. Coetzee, J., &Mammen, K. J. (2017). Science and engineering students’ difficulties with fractions at entry-level to university. International Electronic Journal of Mathematics Education, 12(3), 281-310. [8]. Cogan, L. S., Schmidt, W. H., & Guo, S. (2019). The role that mathematics plays in college-and career-readiness: evidence from PISA. Journal of Curriculum Studies, 51(4), 530-553. [9]. Cooper, G., & Berry, A. (2020). Demographic predictors of senior secondary participation in biology, physics, chemistry and earth/space sciences: students’ access to cultural, social and science capital. International Journal of Science Education, 42(1), 151-166. [10]. Cordero, J. M., Cristobal, V., &Santín, D. (2018). Causal inference on education policies: a survey of empirical studies using PISA, TIMSS and PIRLS. Journal of Economic Surveys, 32(3), 878-915. [11]. Cuenca-Carlino, Y., Freeman-Green, S., Stephenson, G. W., &Hauth, C. (2016). Self-regulated strategy development instruction for teaching multi-step equations to middle school students struggling in math. The Journal of Special Education, 50(2), 75-85. [12]. Dega, B. G. (2019). Cognitive diagnostic assessment of students’ responses: An example from energy and momentum concepts. European Journal of Physics Education, 10(1), 13-23. [13]. Dewi, P. Y., &Primayana, K. H. (2019). Effect of learning module with setting contextual teaching and learning to increase the understanding of concepts. International Journal of Education and Learning, 1(1), 19-26. [14]. Elliott, J., Stankov, L., Lee, J., & Beckmann, J. F. (2019). What did PISA and TIMSS ever do for us? The potential of large-scale datasets for understanding and improving educational practice. Comparative Education, 55(1), 133-155. [15]. Feng, L., Hodges, T. S., Waxman, H. C., & Joshi, R. M. (2019). Discovering the impact of reading coursework and discipline-specific mentorship on first-year teachers’ self-efficacy: A latent class analysis. Annals of Dyslexia, 69(1), 80-98. [16]. Fischbein, E. (1993). The theory of figural concepts. Educational Studies in Mathematics, 24(2), 139-162. [17]. Fortes, E. C., & Andrade, R. R. (2019). Mathematical creativity in solving non-Routine problems. The Normal Lights, 13(1). [18]. Frederick, K. D. (2020). The Outcomes of pre-teaching math lessons to students who struggle in math: A single-subject design approach (Doctoral dissertation, The Chicago School of Professional Psychology).
  • 17. American Research Journal of Humanities Social Science (ARJHSS)R) 2021 ARJHSS Journal www.arjhss.com Page | 60 [19]. Grabau, L. J., & Ma, X. (2017). Science engagement and science achievement in the context of science instruction: a multilevel analysis of US students and schools. International Journal of Science Education, 39(8), 1045-1068. [20]. Han, S. W. (2017). From achievement to non-test outcomes in PISA: National trends in stem career expectations. In The impact of the OECD on education worldwide. Emerald Publishing Limited. [21]. Hayden, H. E., &Eades-Baird, M. (2020). Disciplinary literacy and the 4Es: Rigorous and substantive responses to interdisciplinary standards. Literacy Research: Theory, Method, and Practice. [22]. Hwang, S., & Yeo, S. (2020). Gender differences in Korean elementary students: An analysis of TIMSS 2011 and 2015 fourth grade mathematics assessment. The Mathematical Education, 59(3), 217-235. [23]. Hwang, J., Choi, K. M., Bae, Y., & Shin, D. H. (2018). Do teachers’ instructional practices moderate equity in mathematical and scientific literacy? An investigation of the PISA 2012 and 2015. International Journal of Science and Mathematics Education, 16(1), 25-45. [24]. Jupri, A., &Drijvers, P. (2016). Student difficulties in mathematizing word problems in algebra. Eurasia Journal of Mathematics, Science and Technology Education, 12(9), 2481-2502. [25]. Kamata, A., Bauer, D. J., & Miyazaki, Y. (2008). Multilevel modeling of educational data. A. A. OConnell&McCoach, DB (Eds.), 345-388. [26]. Kanthawat, C., Supap, W., &Klin-eam, C. (2019). The development of grade 11 students’ mathematical literacy on sequences and series using mathematical modelling. In Journal of Physics: Conf. Series (Vol. 1157, pp. 1-6). [27]. Klieme, E. (2020). Policies and practices of assessment: A showcase for the use (and misuse) of international large-scale assessments in educational effectiveness research. In International Perspectives in Educational Effectiveness Research (pp. 147-181). Springer, Cham. [28]. Kyriakides, L., Creemers, B., & Panayiotou, A. (2020). Developing and testing theories of educational effectiveness addressing the dynamic nature of education. In International Perspectives in Educational Effectiveness Research (pp. 33-69). Springer, Cham. [29]. Lechtenberg, K., Thein, A. H., &Rushek, K. (2020). Challenging hierarchies of reading and text selection in the revised publishers’ criteria for the Common Core State Standards. The Bloomsbury Handbook of Reading Perspectives and Practices, 258. [30]. Marsh, H. W., Pekrun, R., Murayama, K., Arens, A. K., Parker, P. D., Guo, J., &Dicke, T. (2018). An integrated model of academic self-concept development: Academic self-concept, grades, test scores, and tracking over 6 years. Developmental Psychology, 54(2), 263. [31]. Milojević, S. (2020). Practical method to reclassify Web of Science articles into unique subject categories and broad disciplines. Quantitative Science Studies, 1(1), 183-206. [32]. Momsen, J. L., Long, T. M., Wyse, S. A., & Ebert-May, D. (2010). Just the facts? Introductory undergraduate biology courses focus on low-level cognitive skills. CBE—Life Sciences Education, 9(4), 435-440. [33]. Murphy, P. E. L., Evans, T., Klymchuk, S., Novak, J., Stephens, J., & Thomas, M. (2019). University STEM students' perceptions of creativity in non-routine problem-solving. ANZIAM Journal, 61, C152-C165. [34]. Nolin, J. B., & Parr, B. (2013). Utilization of a high stakes high school graduation exam to assess the impact of agricultural education: A measure of curriculum integration. Journal of Agricultural Education, 54(3), 41-53. [35]. Nortvedt, G. A. (2018). Policy impact of PISA on mathematics education: The case of Norway. European Journal of Psychology of Education, 33(3), 427-444. [36]. OECD. (2019). PISA 2018 assessment and analytical framework. OECD publishing. [37]. Raudenbush, S. W. (2004). HLM 6: Hierarchical linear and nonlinear modeling. Scientific Software International.
  • 18. American Research Journal of Humanities Social Science (ARJHSS)R) 2021 ARJHSS Journal www.arjhss.com Page | 61 [38]. Raudenbush, S. W., & Bryk, A. S. (2002). Hierarchical linear models: Applications and data analysis methods (Vol. 1),SAGE. [39]. Rahmawati, F., &Retnawati, H. (2019, March). An analysis of students’ difficulties in solving PISA-like mathematical problems. In Journal of Physics: Conference Series (Vol. 1200, No. 1, p. 012015). IOP Publishing. [40]. Rainey, E. C., Maher, B. L., & Moje, E. B. (2020). Learning disciplinary literacy teaching: An examination of preservice teachers’ literacy teaching in secondary subject area classrooms. Teaching and Teacher Education, 94, 103123. [41]. Sawatzki, C., & Sullivan, P. (2018). Shopping for shoes: Teaching students to apply and interpret mathematics in the real world. International Journal of Science and Mathematics Education, 16(7), 1355-1373. [42]. Schoenfeld, A. H. (2020). Mathematical practices, in theory and practice. ZDM–The International Journal on Mathematics Education. [43]. She, H. C., Stacey, K., & Schmidt, W. H. (2018). Science and mathematics literacy: PISA for better school education. International Journal of Science and Mathematics Education, 16(1), 1-5. [44]. Seah, R., & Horne, M. (2019). A learning progression for geometric reasoning. In Researching and using progressions (trajectories) in mathematics education (pp. 157-180). Brill Sense. [45]. Sorby, S. A., & Panther, G. C. (2020). Is the key to better PISA math scores improving spatial skills? Mathematics Education Research Journal, 1-21. [46]. Teig, N., Scherer, R., &Kjærnsli, M. (2020). Identifying patterns of students' performance on simulated inquiry tasks using PISA 2015 log‐file data. Journal of Research in Science Teaching. [47]. Thien, L. M. (2016). Malaysian students’ performance in mathematics literacy in PISA from gender and socioeconomic status perspectives. The Asia-Pacific Education Researcher, 25(4), 657- 666. [48]. Vedder, P. (2020). Measuring the quality of education:An introduction. Measuring the Quality of Education, 1. [49]. Wandasari, Y., Kristiawan, M., & Arafat, Y. (2019). Policy evaluation of school’s literacy movement on improving discipline of state high school students. International Journal of Scientific & Technology Research, 8(4), 190-198. [50]. Windschitl, M. (2019). Disciplinary literacy versus doing school. Journal of Adolescent & Adult Literacy, 63(1), 7-13. [51]. Woessmann, L. (2016). The importance of school systems: Evidence from international differences in student achievement. Journal of Economic Perspectives, 30(3), 3-32. [52]. Zhang, W., & Bray, M. (2020). Comparative research on shadow education: Achievements, challenges, and the agenda ahead. European Journal of Education, 55(3), 322-341.