
Recommended
Recommended
More Related Content
Similar to AbstractThe American Intellectual Union collected data from its .docx
Similar to AbstractThe American Intellectual Union collected data from its .docx (10)
More from annetnash8266
More from annetnash8266 (20)
Recently uploaded
Recently uploaded (20)
AbstractThe American Intellectual Union collected data from its .docx
- 1. Abstract The American Intellectual Union collected data from its employees and using that information it is important to examine each and every aspect of the data to get a clear picture of the makeup of the company’s employees. Throughout this report one quantitative and one qualitative variable will be analyzed. Introduction Gender and job satisfaction are two vital components in the workplace to help managers understand the behavior of their employees. Within the data selection, we get to choose from two points of information, qualitative and quantitative data. Chosen Variables There are several other variables that can be collected to be useful to a business but for the purpose of this report, it will focus only on gender and extrinsic job satisfaction. Difference in variable types It is important to know what the difference in the two data sets are before one can make an appropriate choice. Understanding the difference is quiet simple. Qualitative data deals with things that cannot be measured or things that are descriptive; such as smells, colors, or tastes (Bluman, 2010). One can think of it as ‘qualit’ative = ‘qualit’y. The gender is a great example of qualitative data. The codes are set to male as 1 and female as 2. Quantitative data deals with things that are measured and numbers, such as speed, ages, height, time, length, etc. (Bluman, 2010). One can think of it as ‘quantit’ative – ‘quantit’y. The extrinsic job satisfaction shows an example of this by the values provided in a range from 1 to 7. Mean, median, and mode are referred to as the measures of central tendency. The mean is simply the average; the sum of all the set data divided by the number of that data. The median is the middle; if the data was put in numerical order, the number in the middle would be the median. The mode is the number that
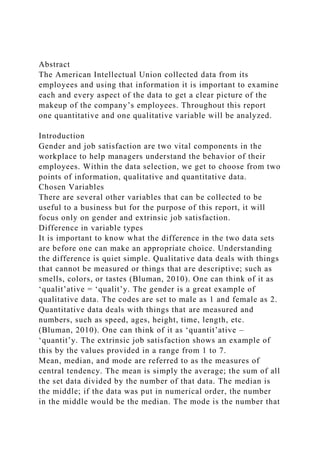
- 2. appears most frequent. In some cases, it is possible to have no mode or to have more than one (Schultzkie, 2011). Explanation of descriptive statistics The median is 1. This measure is actually meaningless. While there’s a gender group 1, it cannot be sorted from smallest to the largest. The mode is 1. This is useful for this group. It suggests that most of the people in this group are 1; in this case male. The mean is 1.39. This is meaningless as well. Since there are only 2 groups, there can’t be a 1.39 group. The standard deviation is 0.49 and the variance is 0.24. Explanation of descriptive statistics The median is 5.6. This is useful for this group. The mode is 5.6. This is also useful in this group. The mean is 5.413888889. This is valid for a variable. The standard deviation is 0.488234591 and the variance is 0.238373016. Description of Chart A pie chart can be used to show part of something and how it relates to a whole. This type of chart is needed when showing percentages. It takes a circle and divides it into pieces, one per each category. The width of each piece is determined by the points in each category. For the gender group, you can see the pie chart above. The chart shows 22 males and 14 females. This helps confirm that the mode was 1 showing there are more males than females in the workplace for this company. Chart/Graph for quantitative variable Description of Chart A histogram shows a graphical display of classified frequencies. It’s a table that shows what proportions fall into several or many specific categories. It contains intervals for values that the variables take and each are associated with a bar that is
- 3. represented by the number of points that fall into that interval. For extrinsic job satisfaction, a histogram was used. As seen above, the intervals start at 4.6-5 and end at 6.6-7. Explanation of standard deviation and variance The measures of variability and spread of distribution about the means are standard deviation and variance. The average amounts by which the scores in distribution differ from means, ignoring signs of difference is called standard deviation. The square root of variance is called standard deviation. We already found out that the mean of the qualitative variable is useless; therefore the qualitative variable a standard deviation and variance cannot be used for the mean, but can be used for the quantitative variables. Importance of charts and graphs Graphs and charts are illustrations that represent numerical quantities and facts in a visual form. Graphs are used for many types of data and can be done in several types such as circle, line, or bar. They are vital because they make it easier when comparing numbers and making facts more understandable. They make raw data easier and quicker to read and can display the important information of that data. Charts can show large amounts of data in a single graph or chart and make it easier to comprehend the relationship between the different parts of all the data (Bluman, 2010). Conclusion After investigating two variables; gender and extrinsic, it can be seen that the company is made up of mostly males and noticed that most of the measures are actually useless. With extrinsic it was seen that median and mode were the same and the mean was slightly different indicating a pretty normal distribution. Moral Dilemma
- 4. The moral dilemma in this case is an attorney’s emotional conflict with his professional obligations. Attorney Frank Armani empathizes with father of a victim and debates with disclosing confidential information that would breech the client/ attorney agreement. “A right versus right situation occurs when one is faced with an urgent and intricate situation that makes you make choices about your integrity and moral character” (Badaracco Jr., 2009). The client of the attorney has the right to a fair case. The rights of the client are not to be violated by the attorney due to moral conflicts of the attorney. “The Constitution of the United States of America and Amendment V has the strongest claim for due process of law and rights to liberty until proven guilty in a court of law where breaking the right to confidentiality would harm due process and rights to liberty (Badaracco& West, 1990). Model I made my decision through the reading Right vs. Right. The attorney was faced with protecting his client and disclosing confidential information and sympathizing with a father. The attorney had to chose between integrity and moral character this is a clear right vs. right. Right vs. Right The decision I made was right vs. right. Attorney Frank Armani’s moral obligation is to his client. As an attorney you must honor client and attorney confidential agreements. “The requirement that an attorney may not reveal communications, conversations and letters between himself/ herself and his/her client, under the theory that a person should be able to speak freely and honestly with his/her attorney without fear of future revelation” (dictionary law, 2013).Outside of the legal world it is hard to understand how not disclosing important information is morally correct. Society would have it that giving the father some peace and empathizing with his lost is morally correct. However, sometimes client information may conflict with personal morals. Since it is important to practice good ethics in business it is essential to honor all legally binding documents
- 5. despite personal emotions. Personal application This week’s assignment can be applied in real life. Do legal obligations trump personal obligations? We have legal obligations as citizen and in some professions. However, we all have emotions and empathize with others. As professionals in business we must make ethical choices and abide by the laws set before us. This applies to personal lives in when we have sensitive information that is not ours to disclose. In our professional lives we protect our jobs by following the guidelines and provisions of our jobs. In medical offices we cannot disclose patient information without the consent of the patient. Lawyers, family members, press ect. often attempt to retrieve confidential patient information. If a person inquires information on a patient regardless of the reason we cannot even disclose if the patient is in the building. It is an attempt to protect the patient’s privacy. This scenario applies to the Armani case and the medical field.