Download as PDF, PPTX


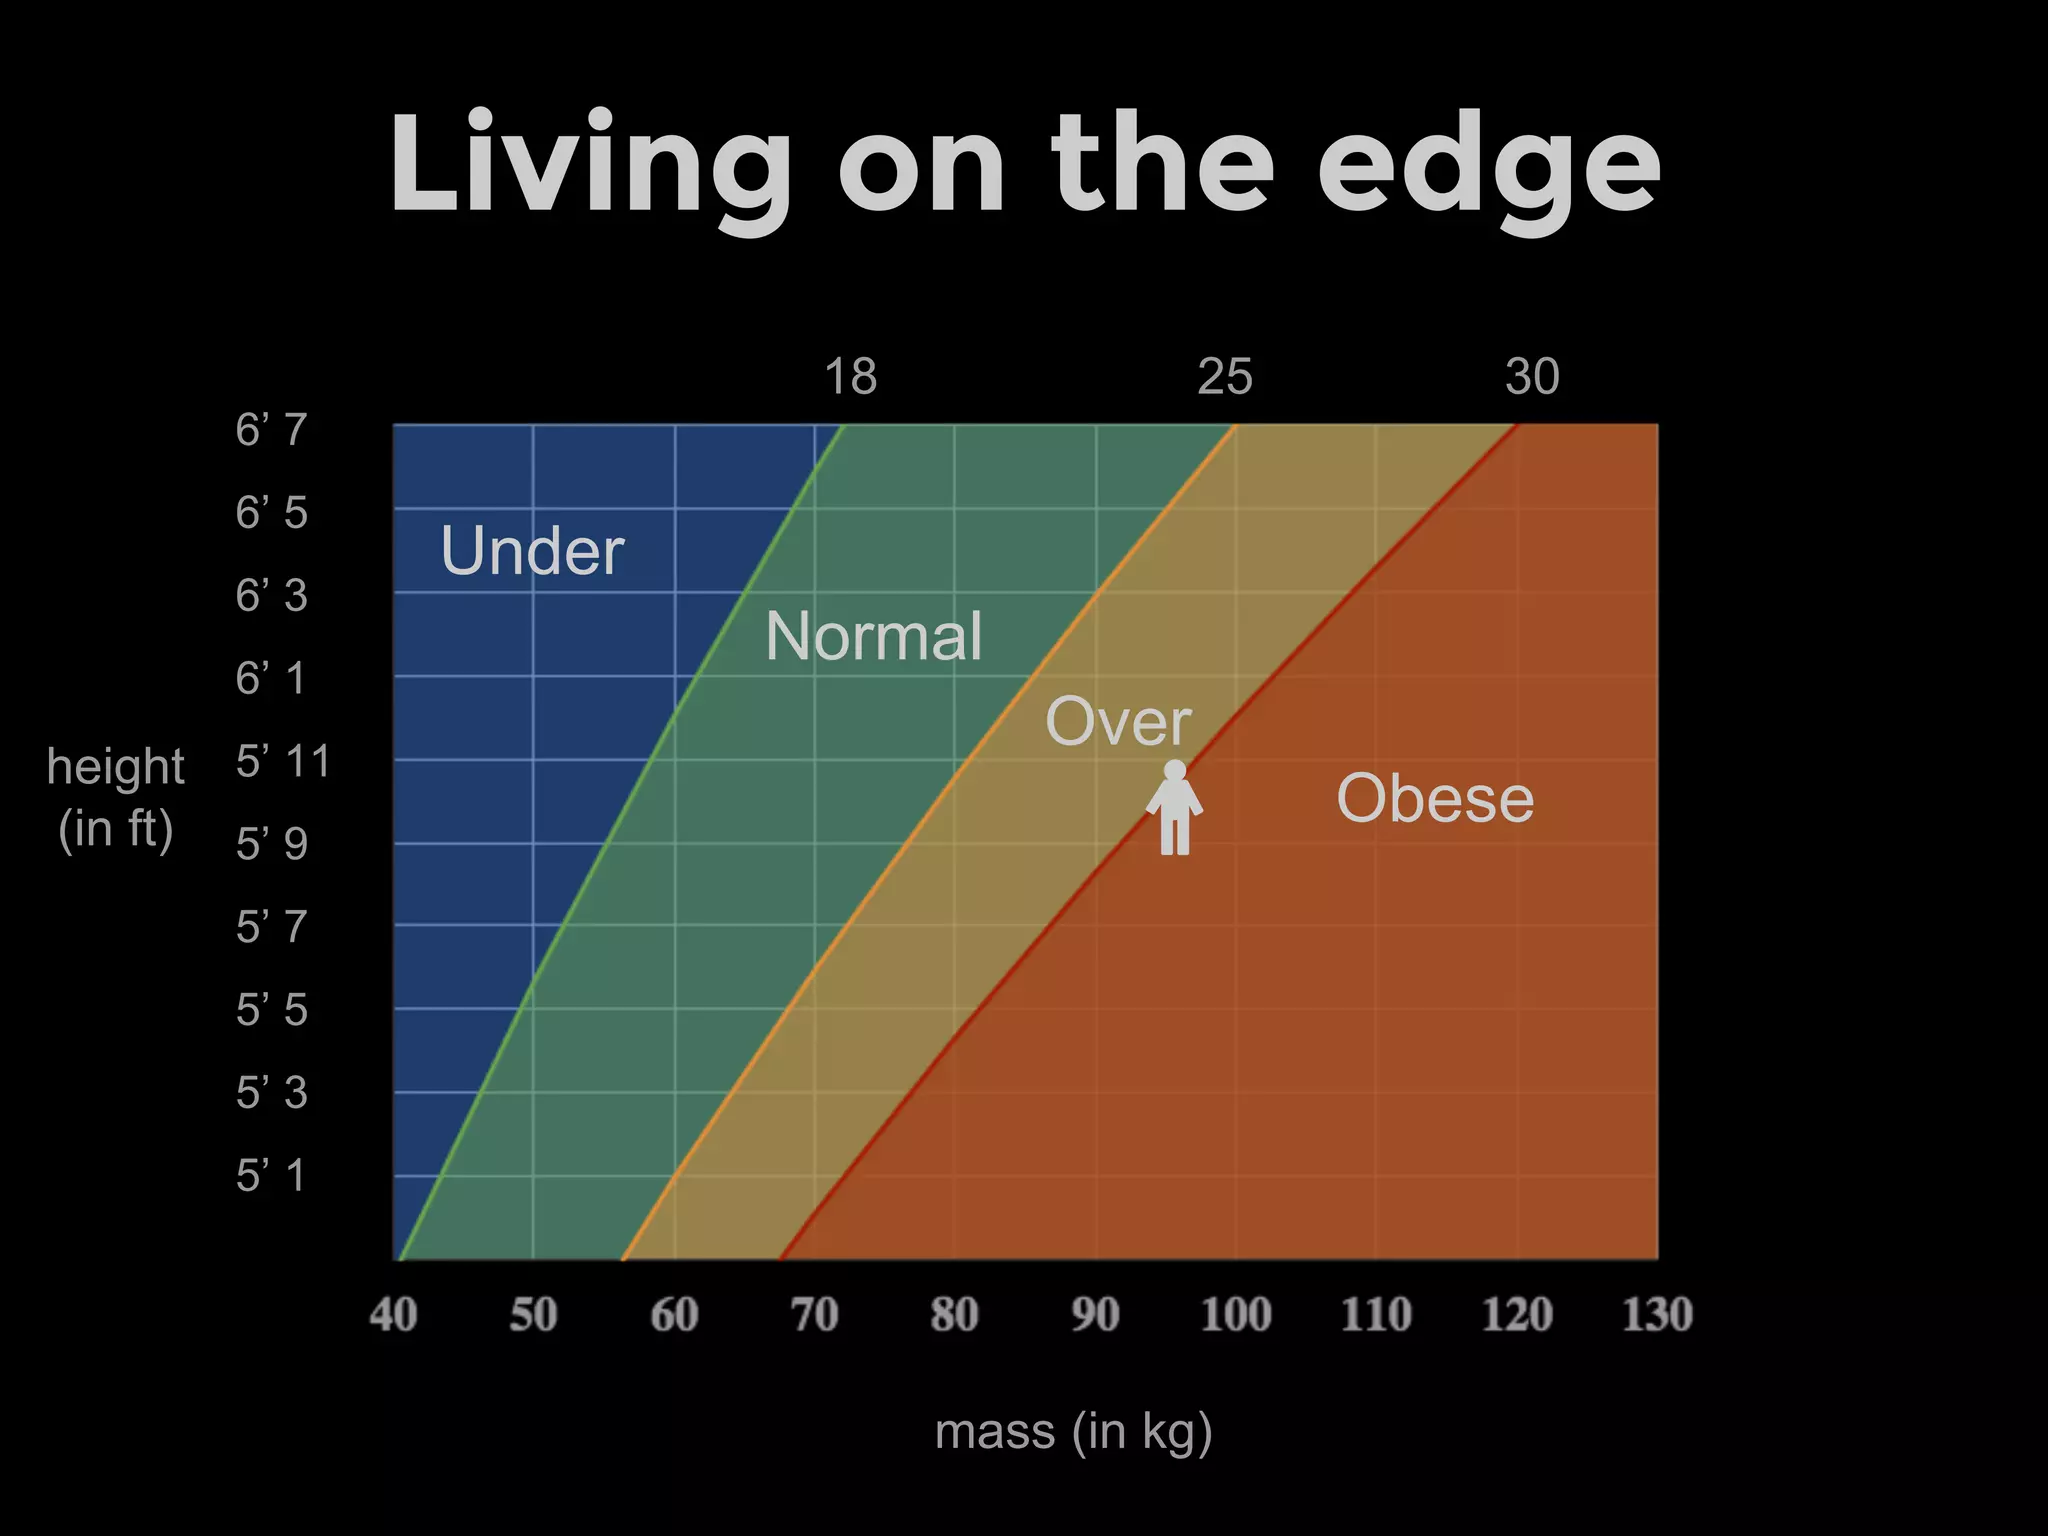
![Body Mass Index (BMI)
BMI =
mass (kg)
[ height (m) ]2h
m](https://image.slidesharecdn.com/craftingvisualstorieswithdata-140318183623-phpapp01/75/Crafting-Visual-Stories-with-Data-23-2048.jpg)
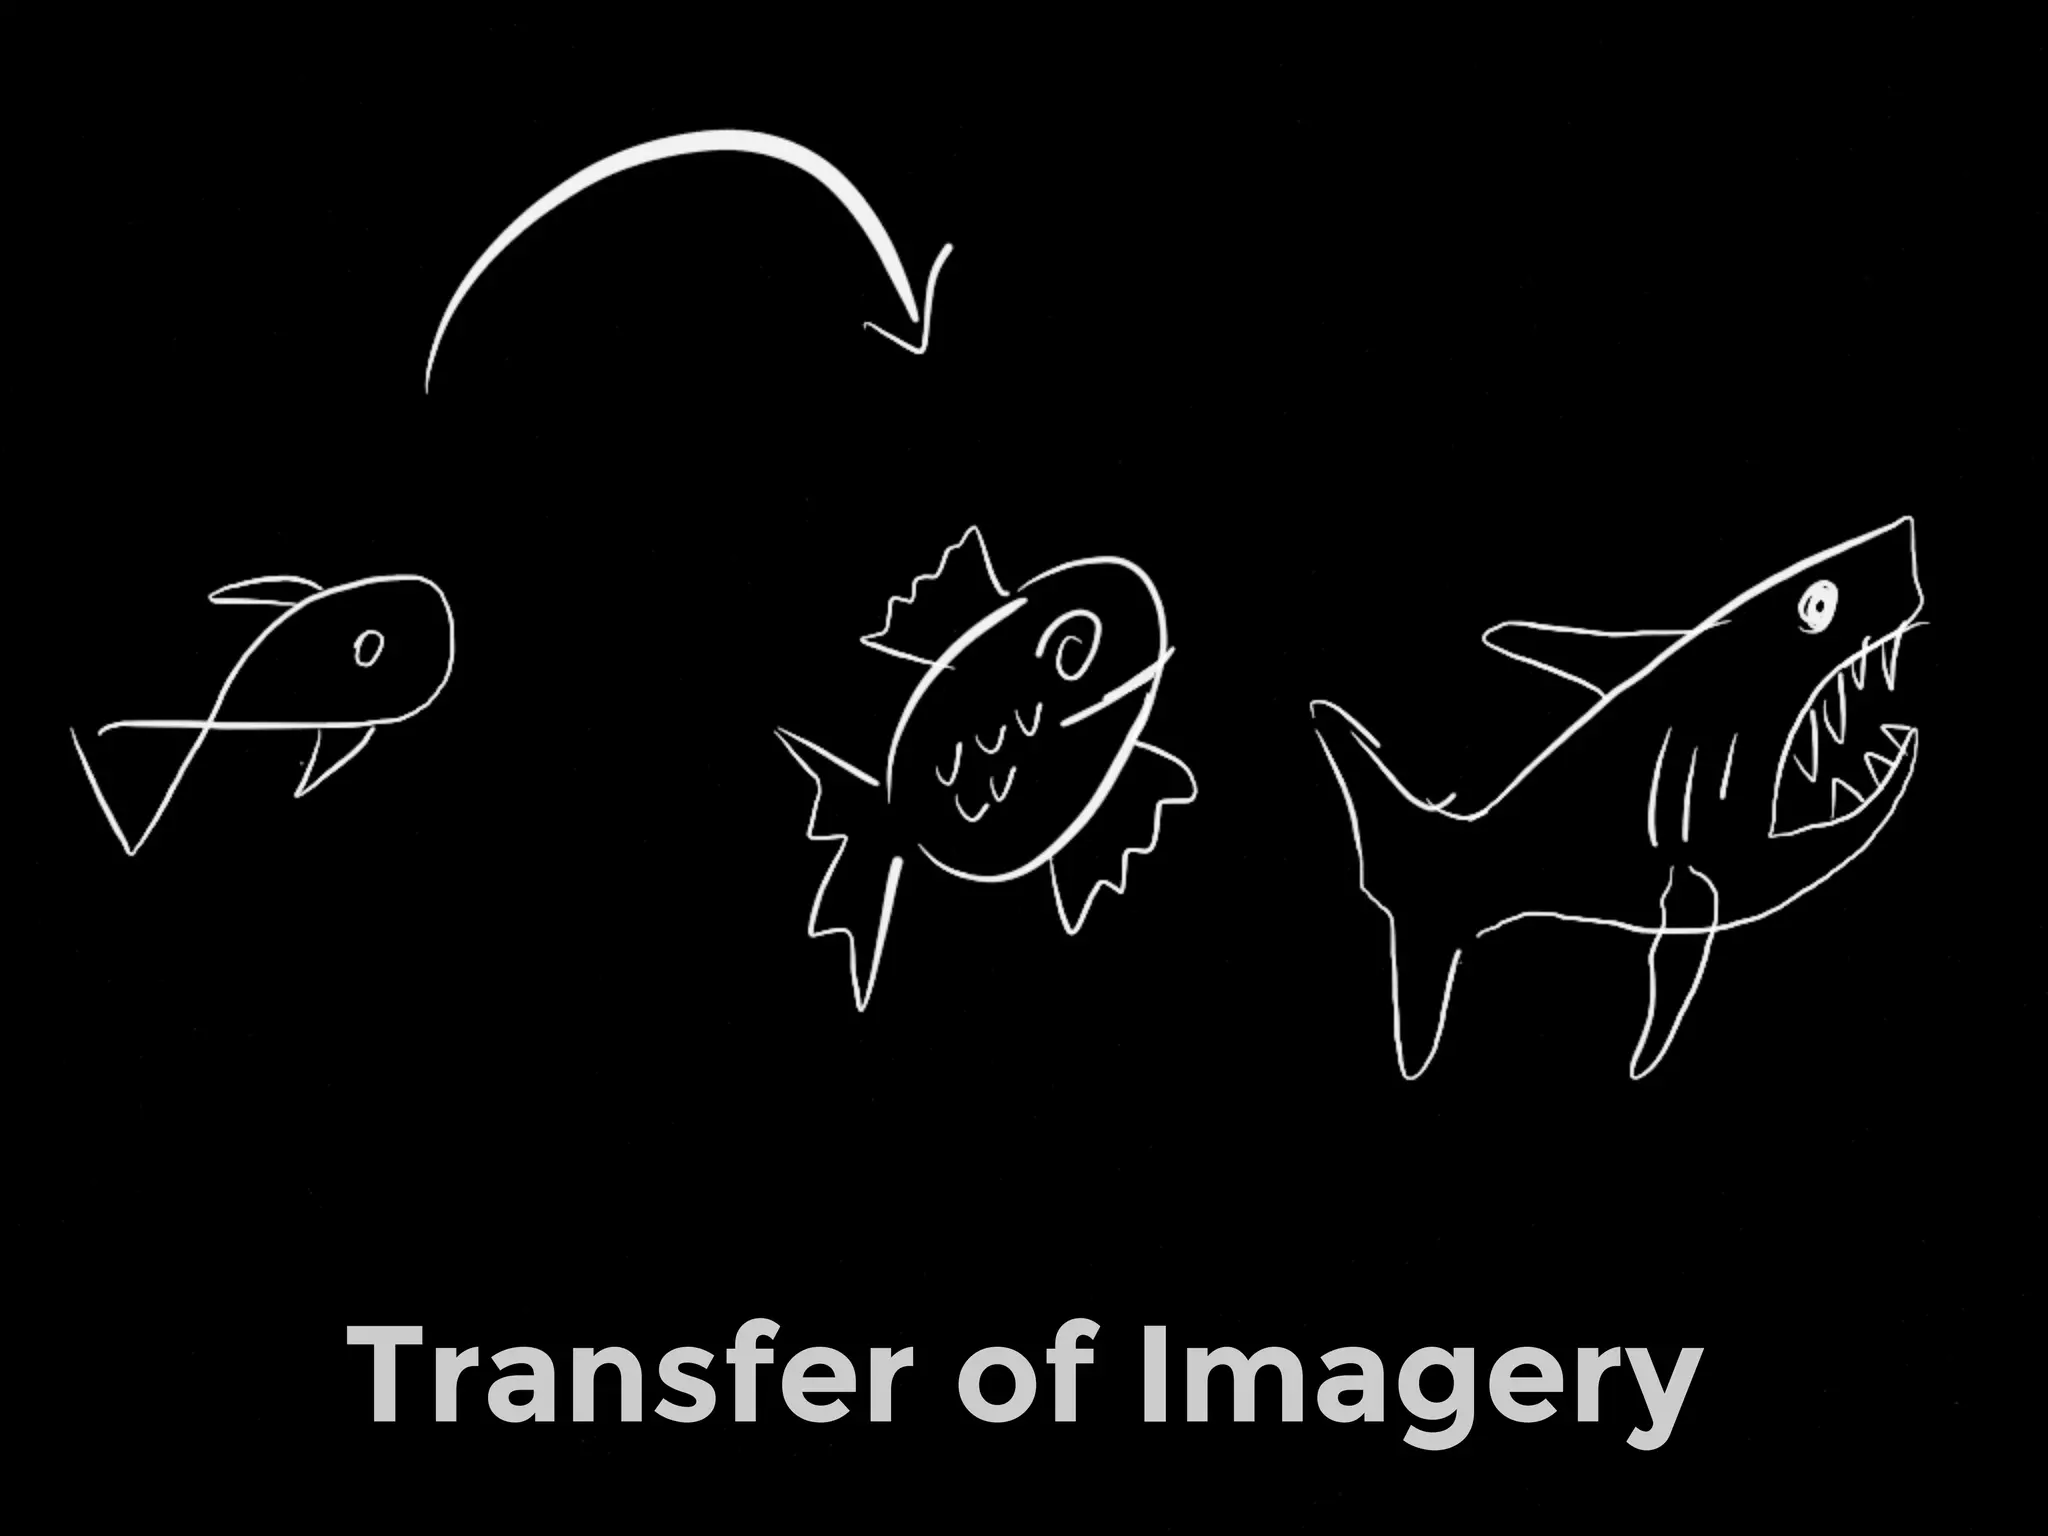
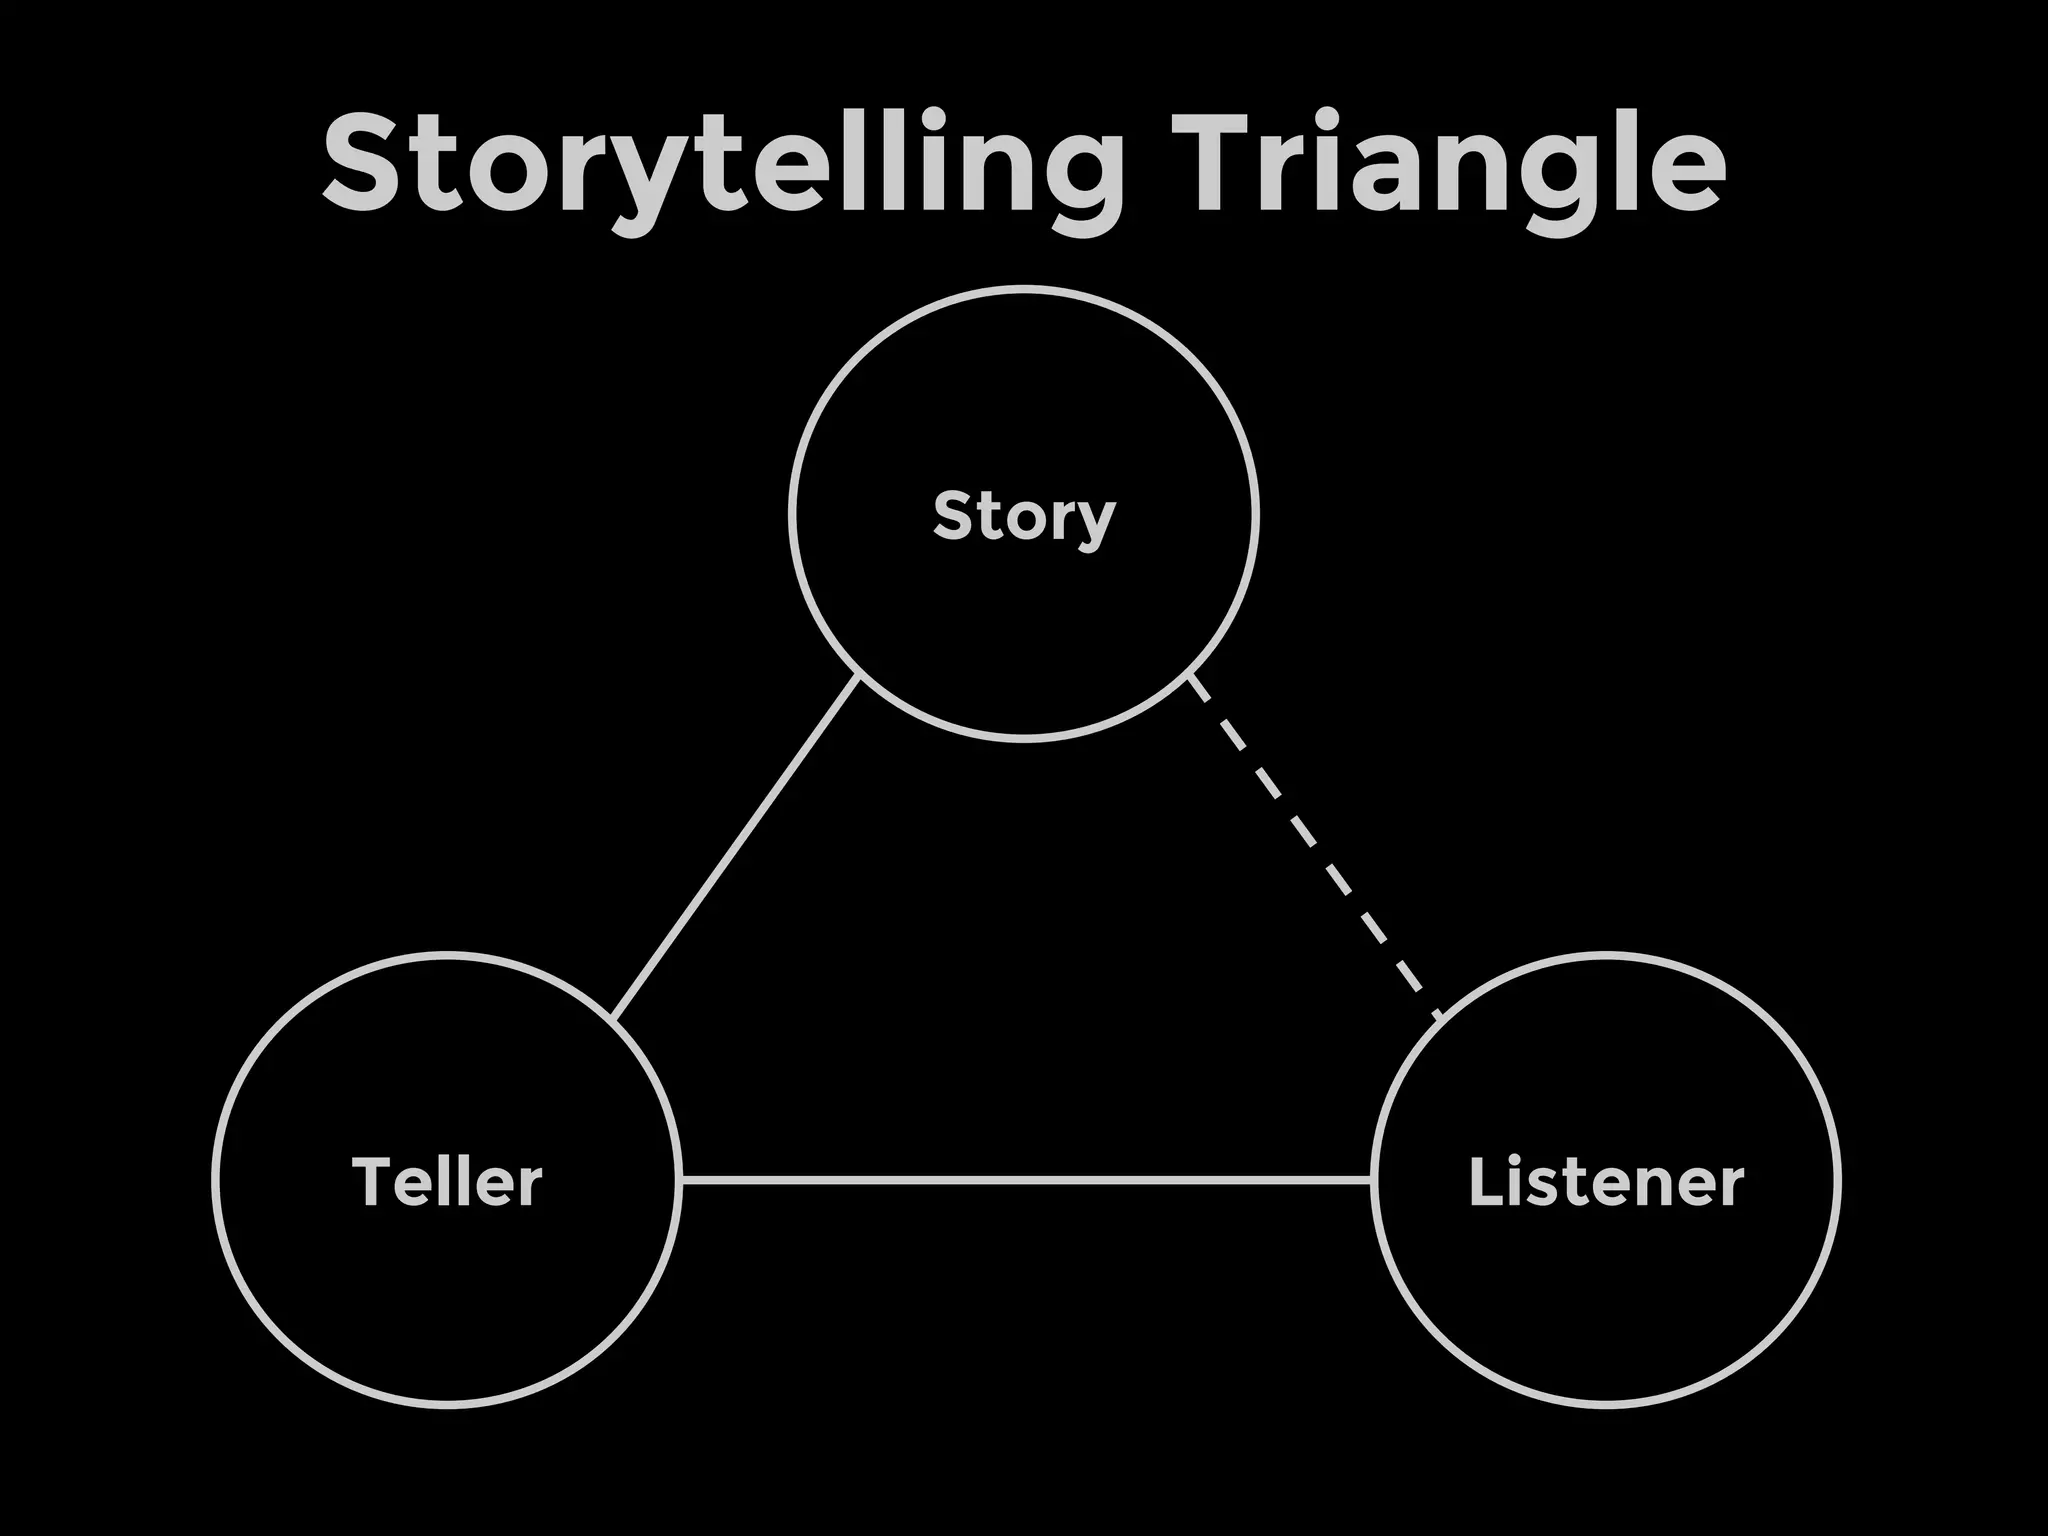
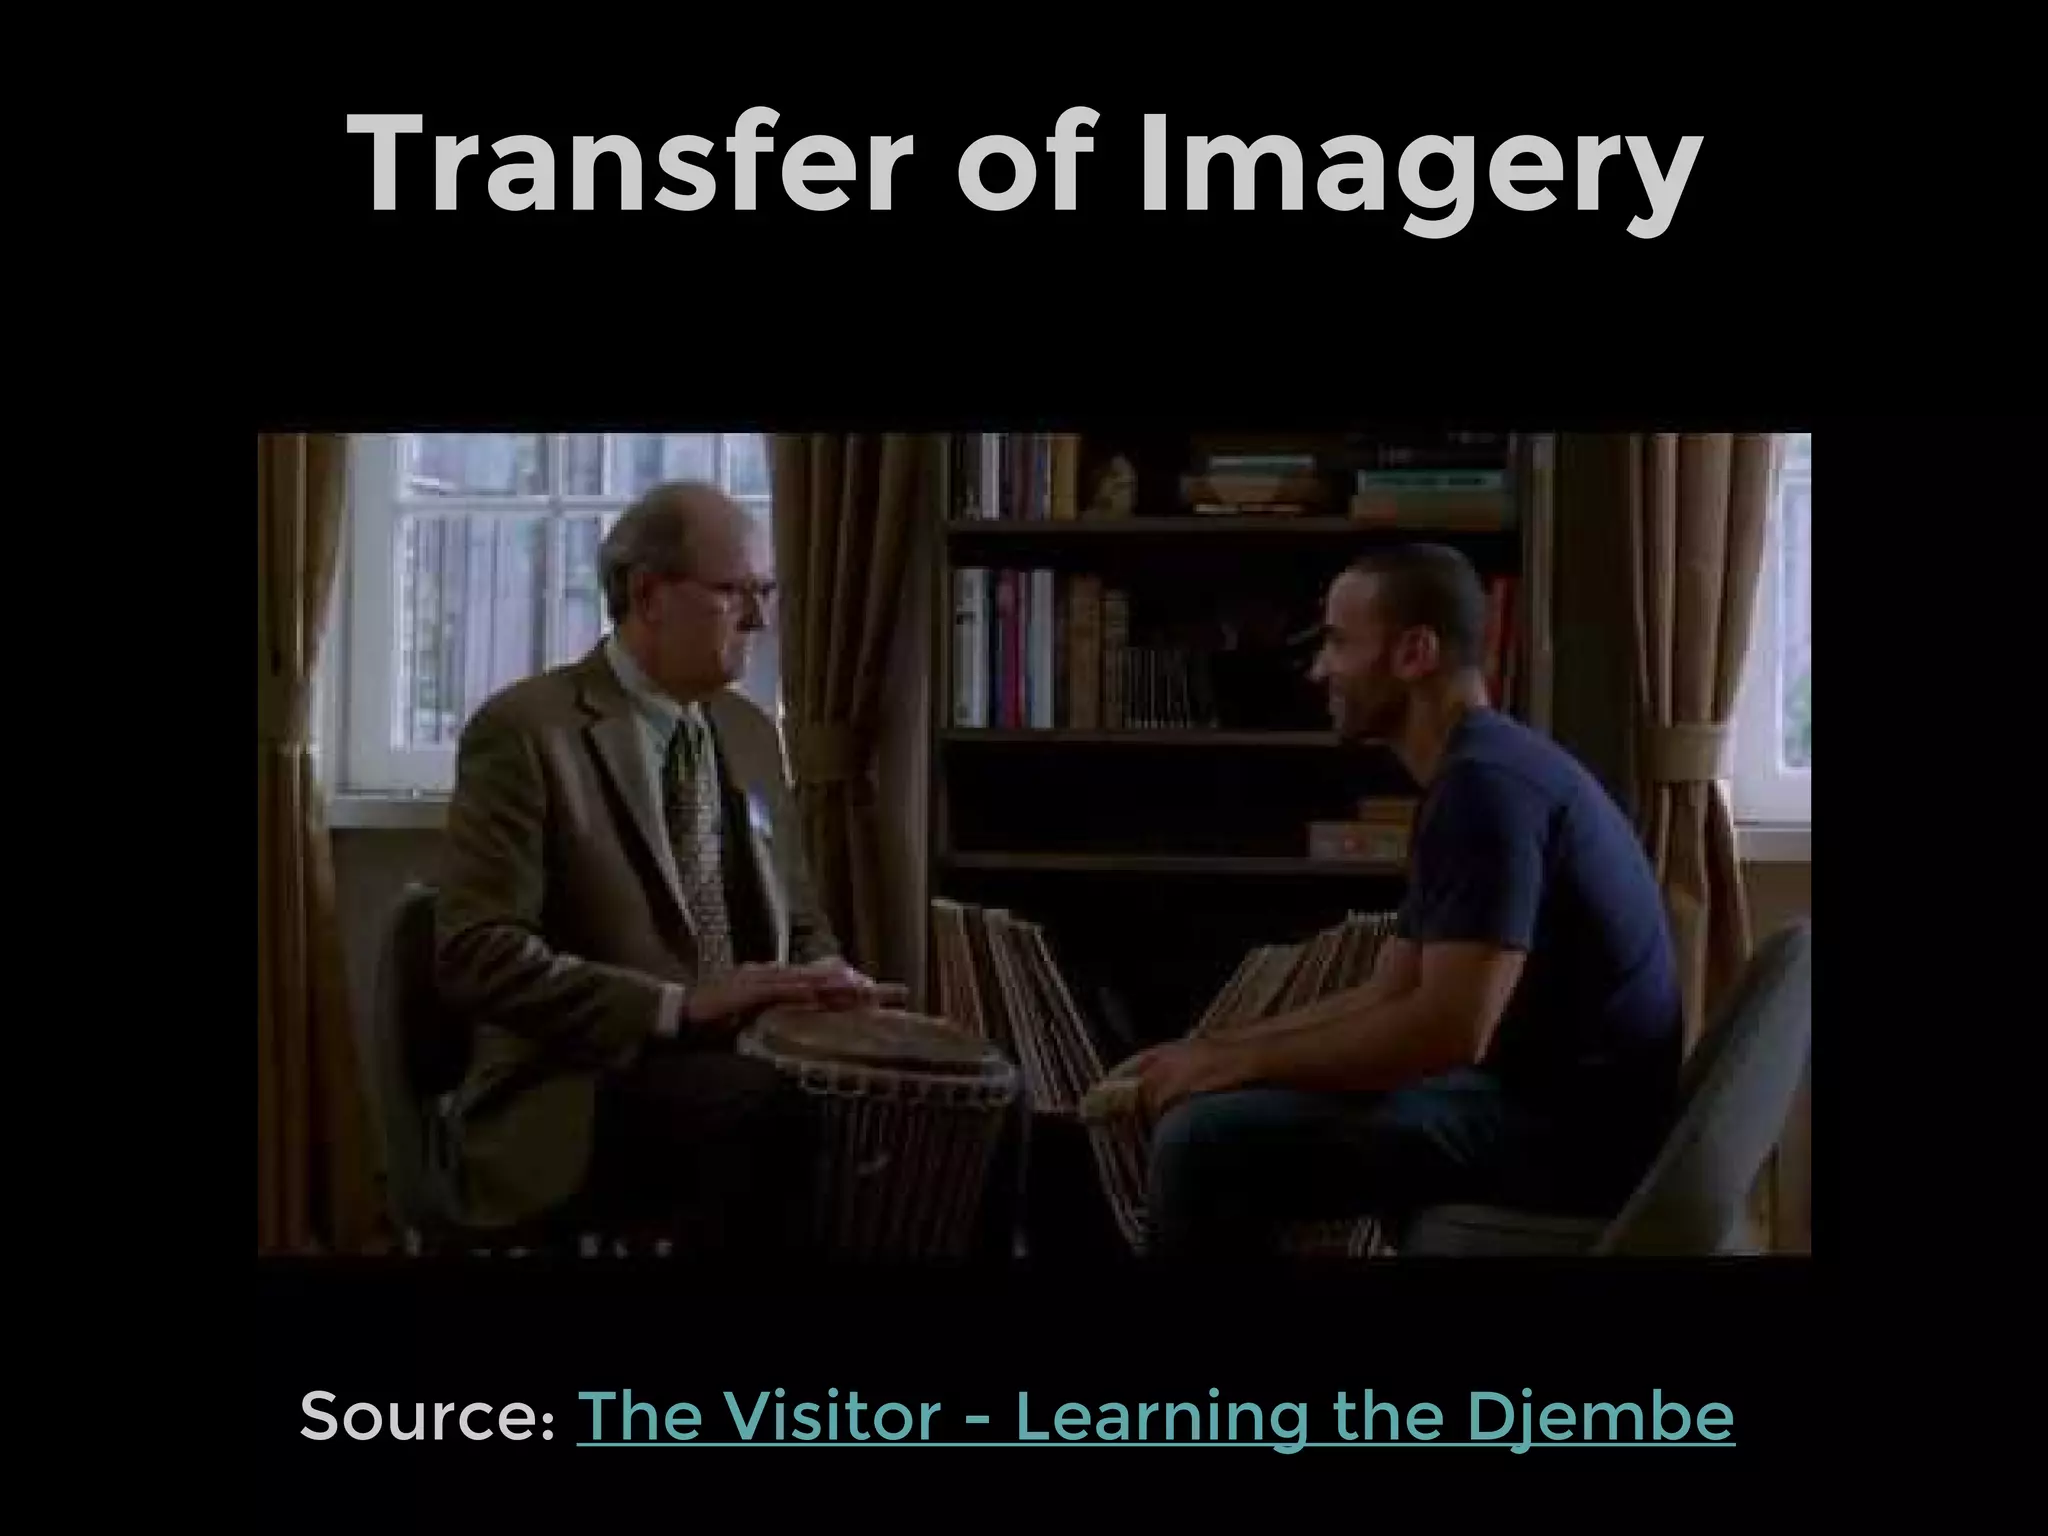
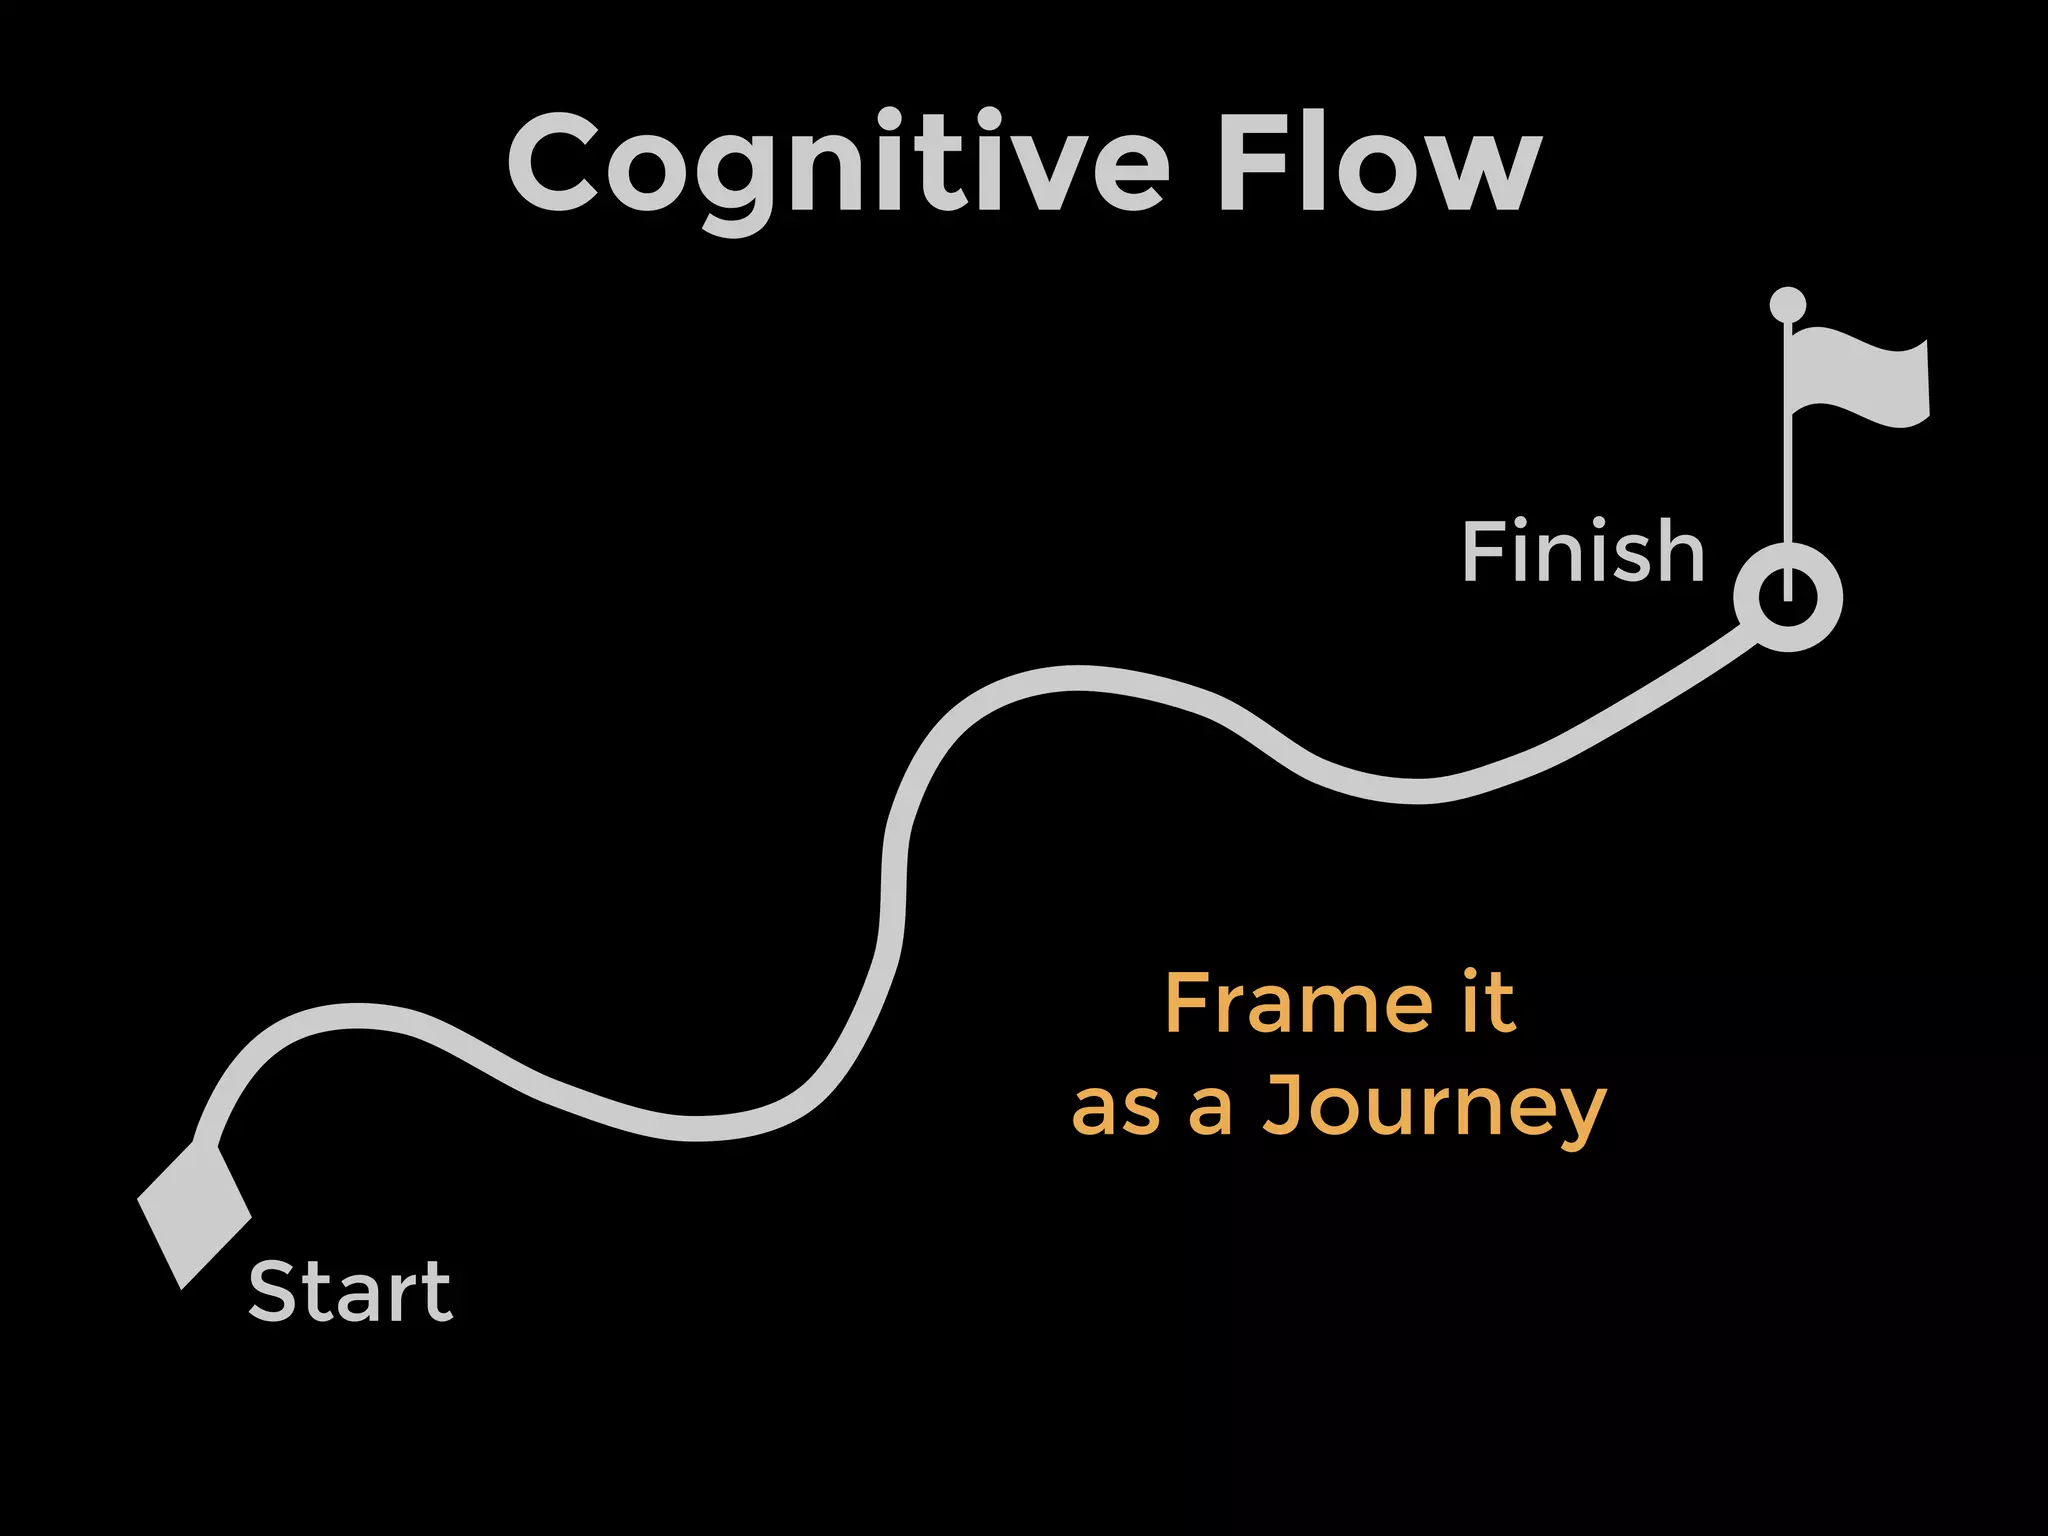
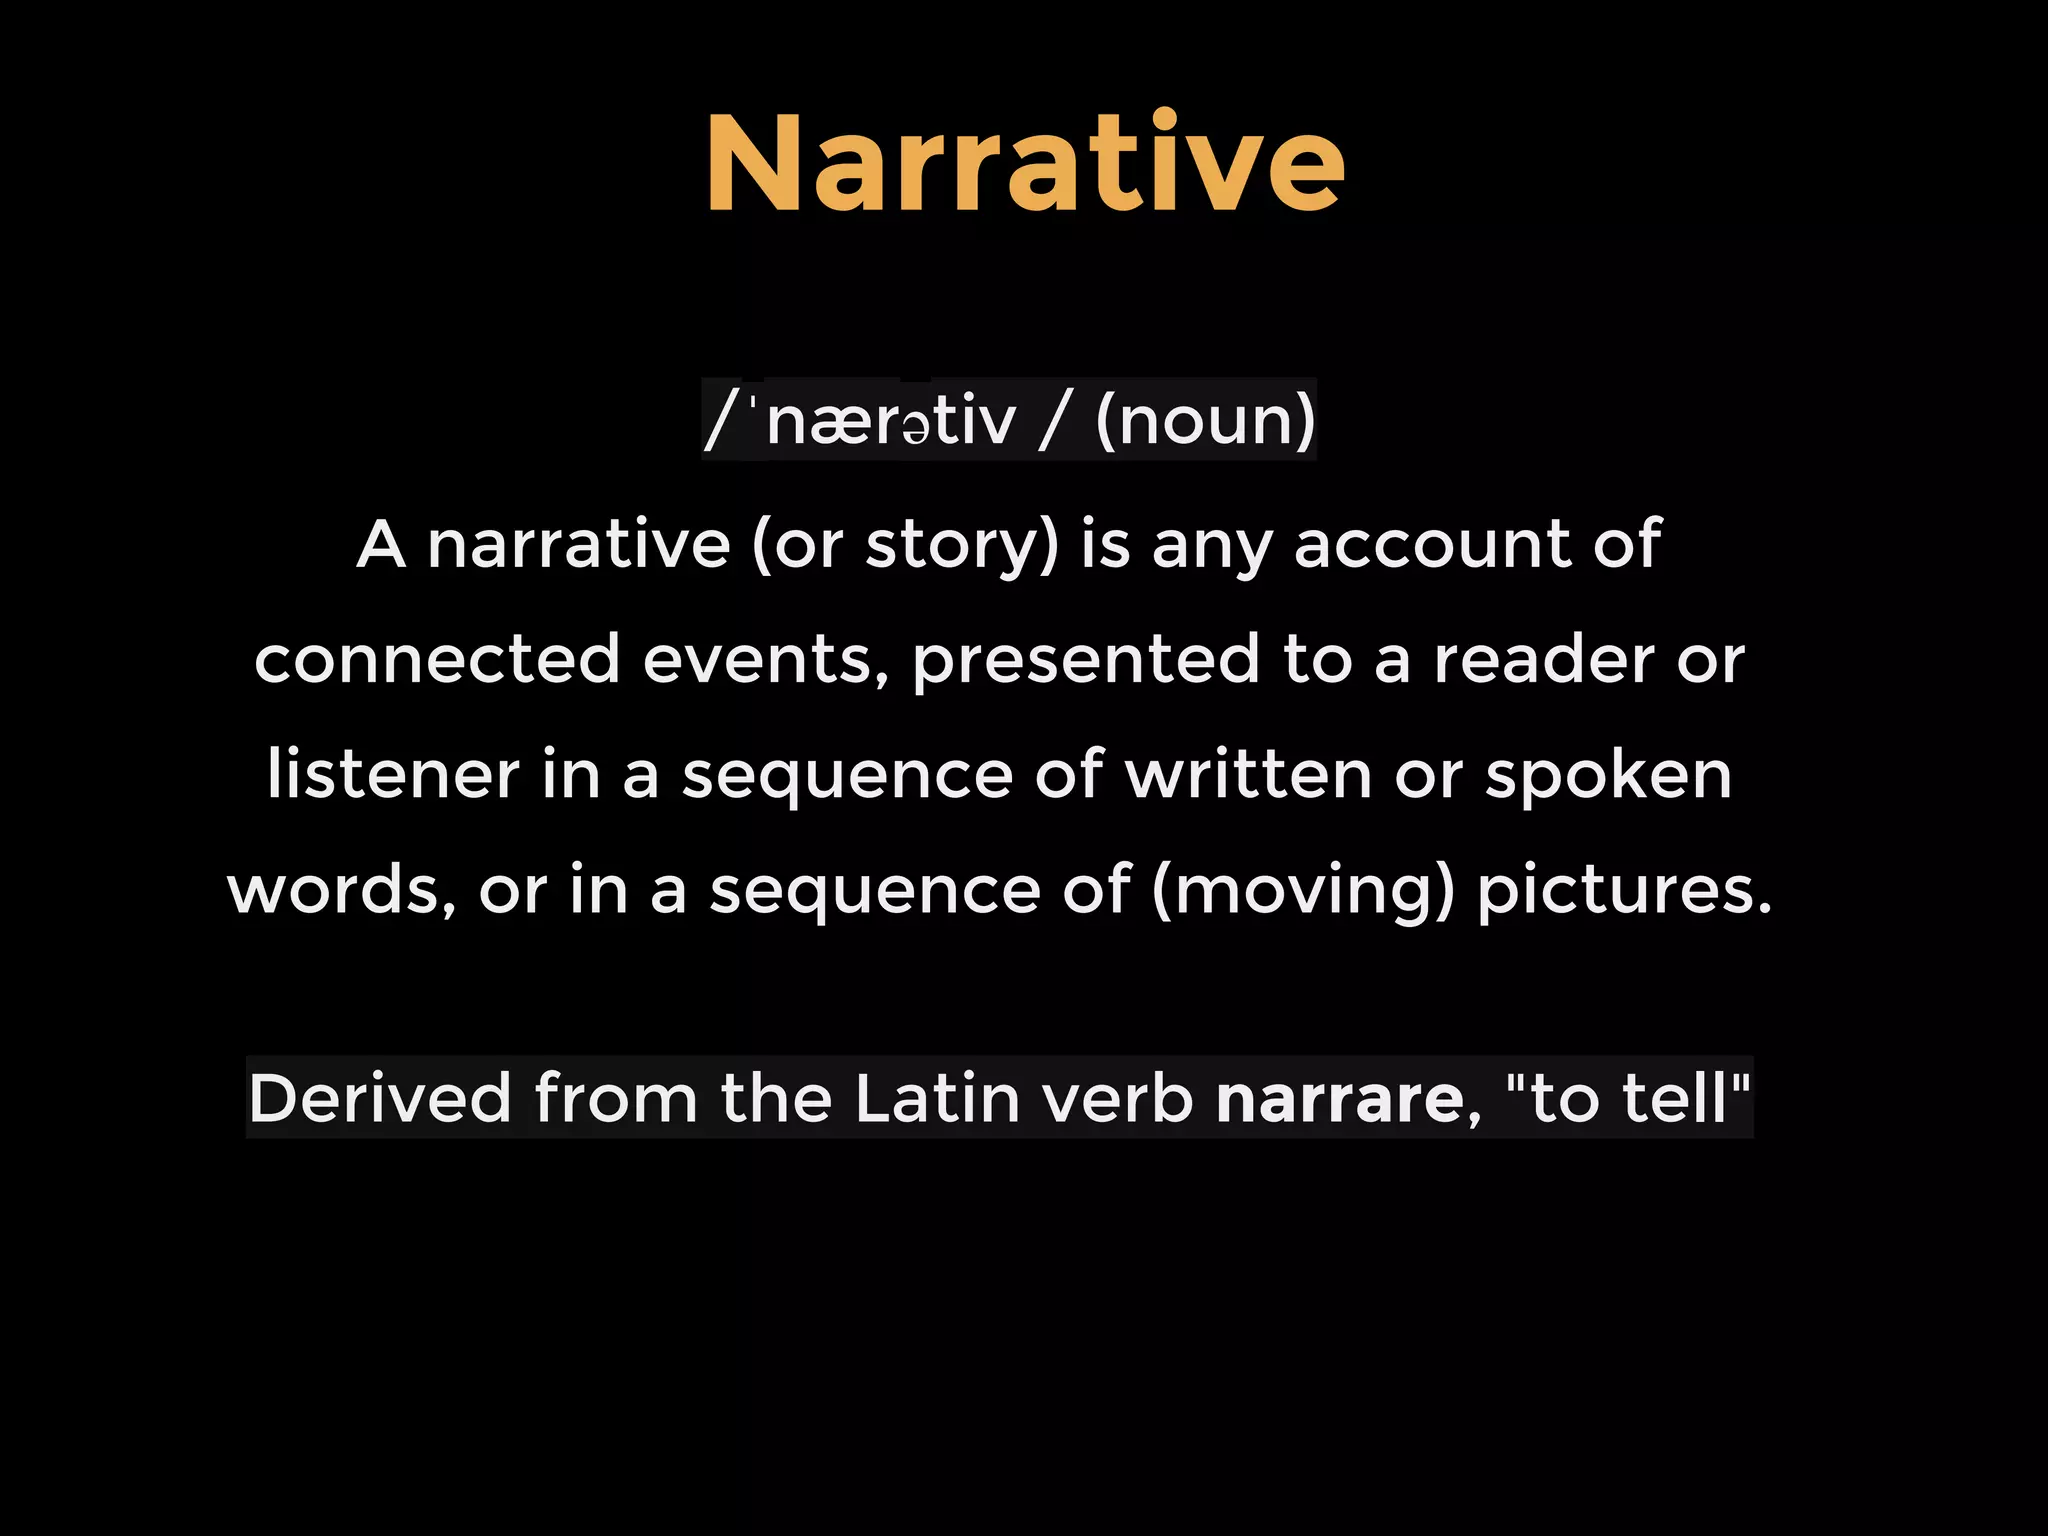

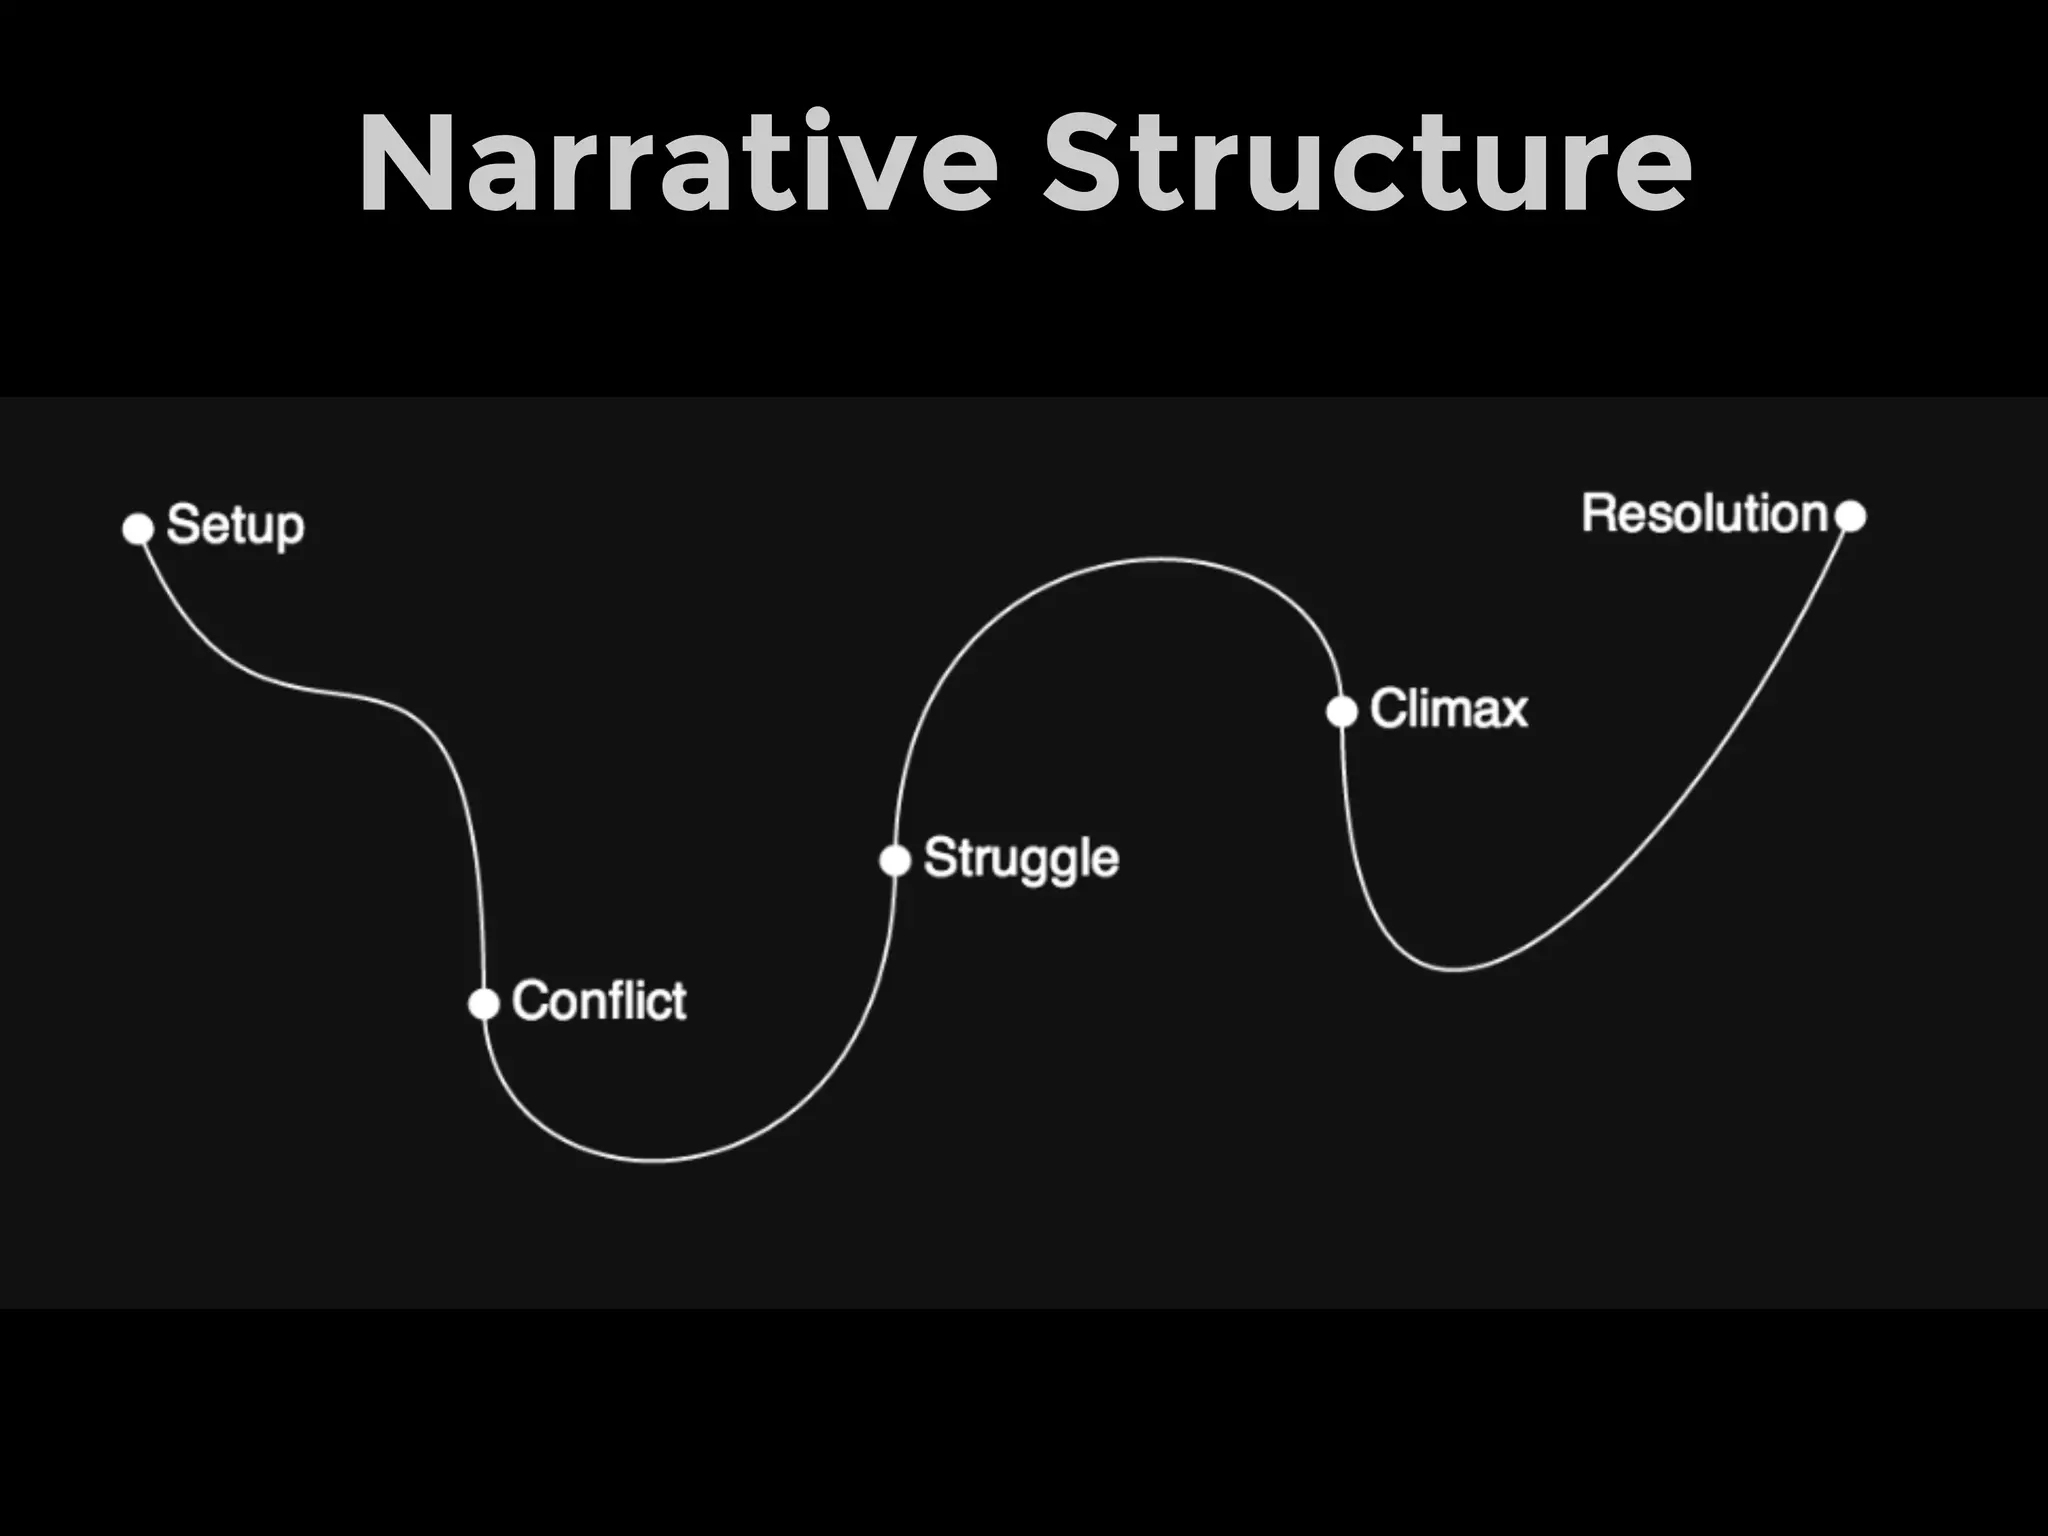
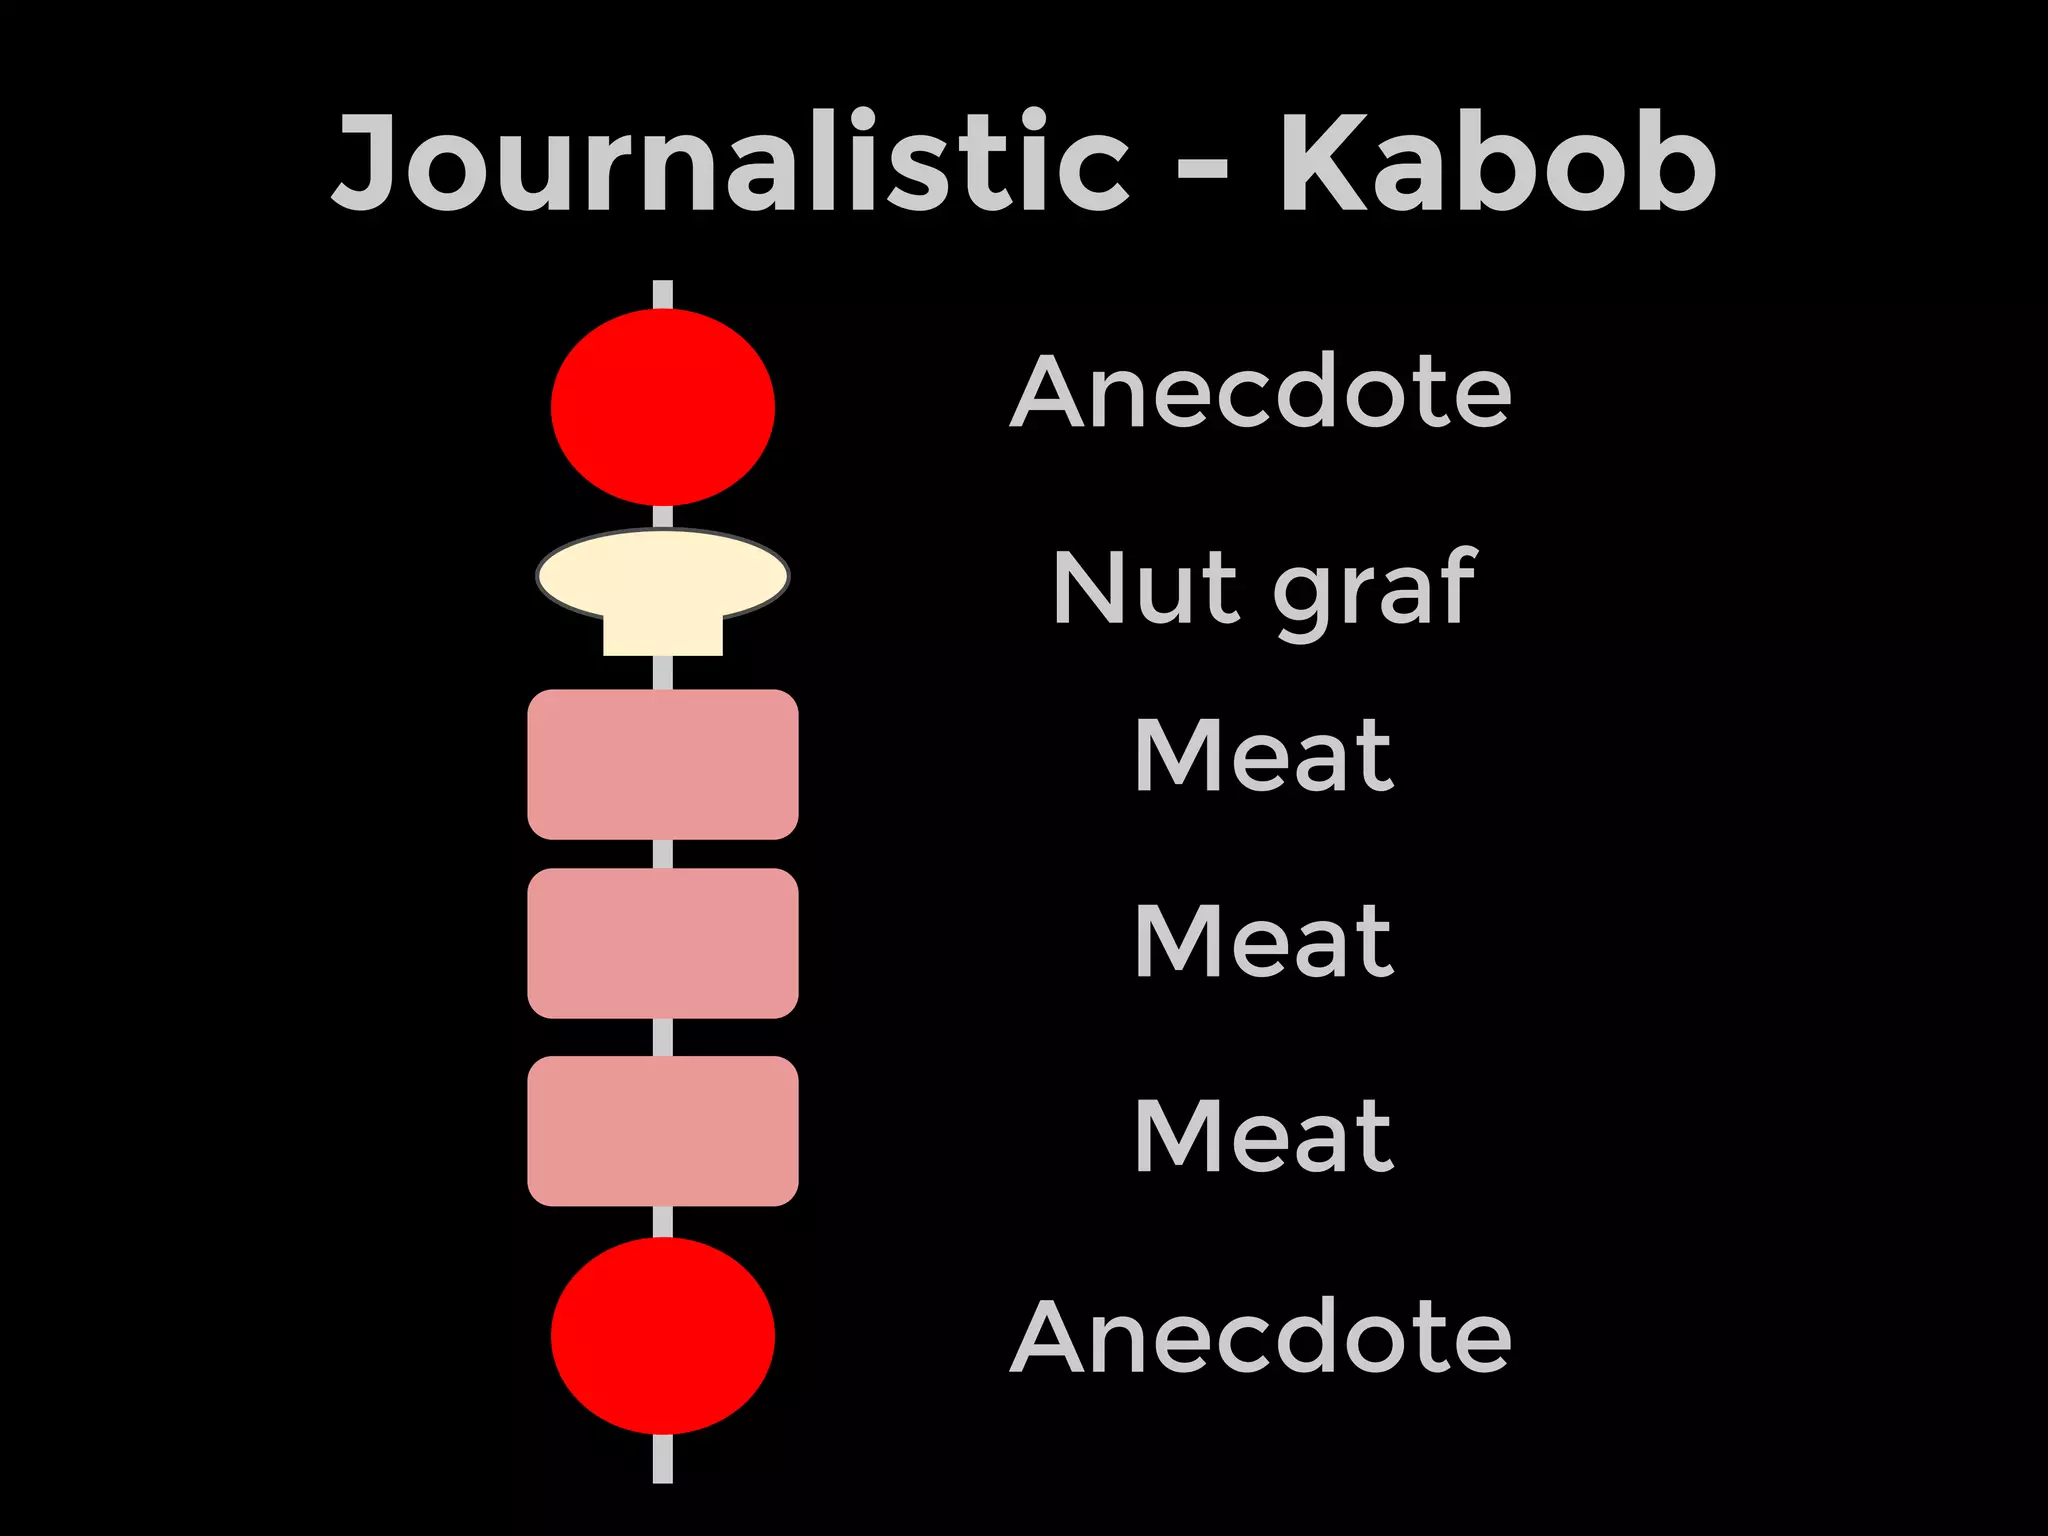
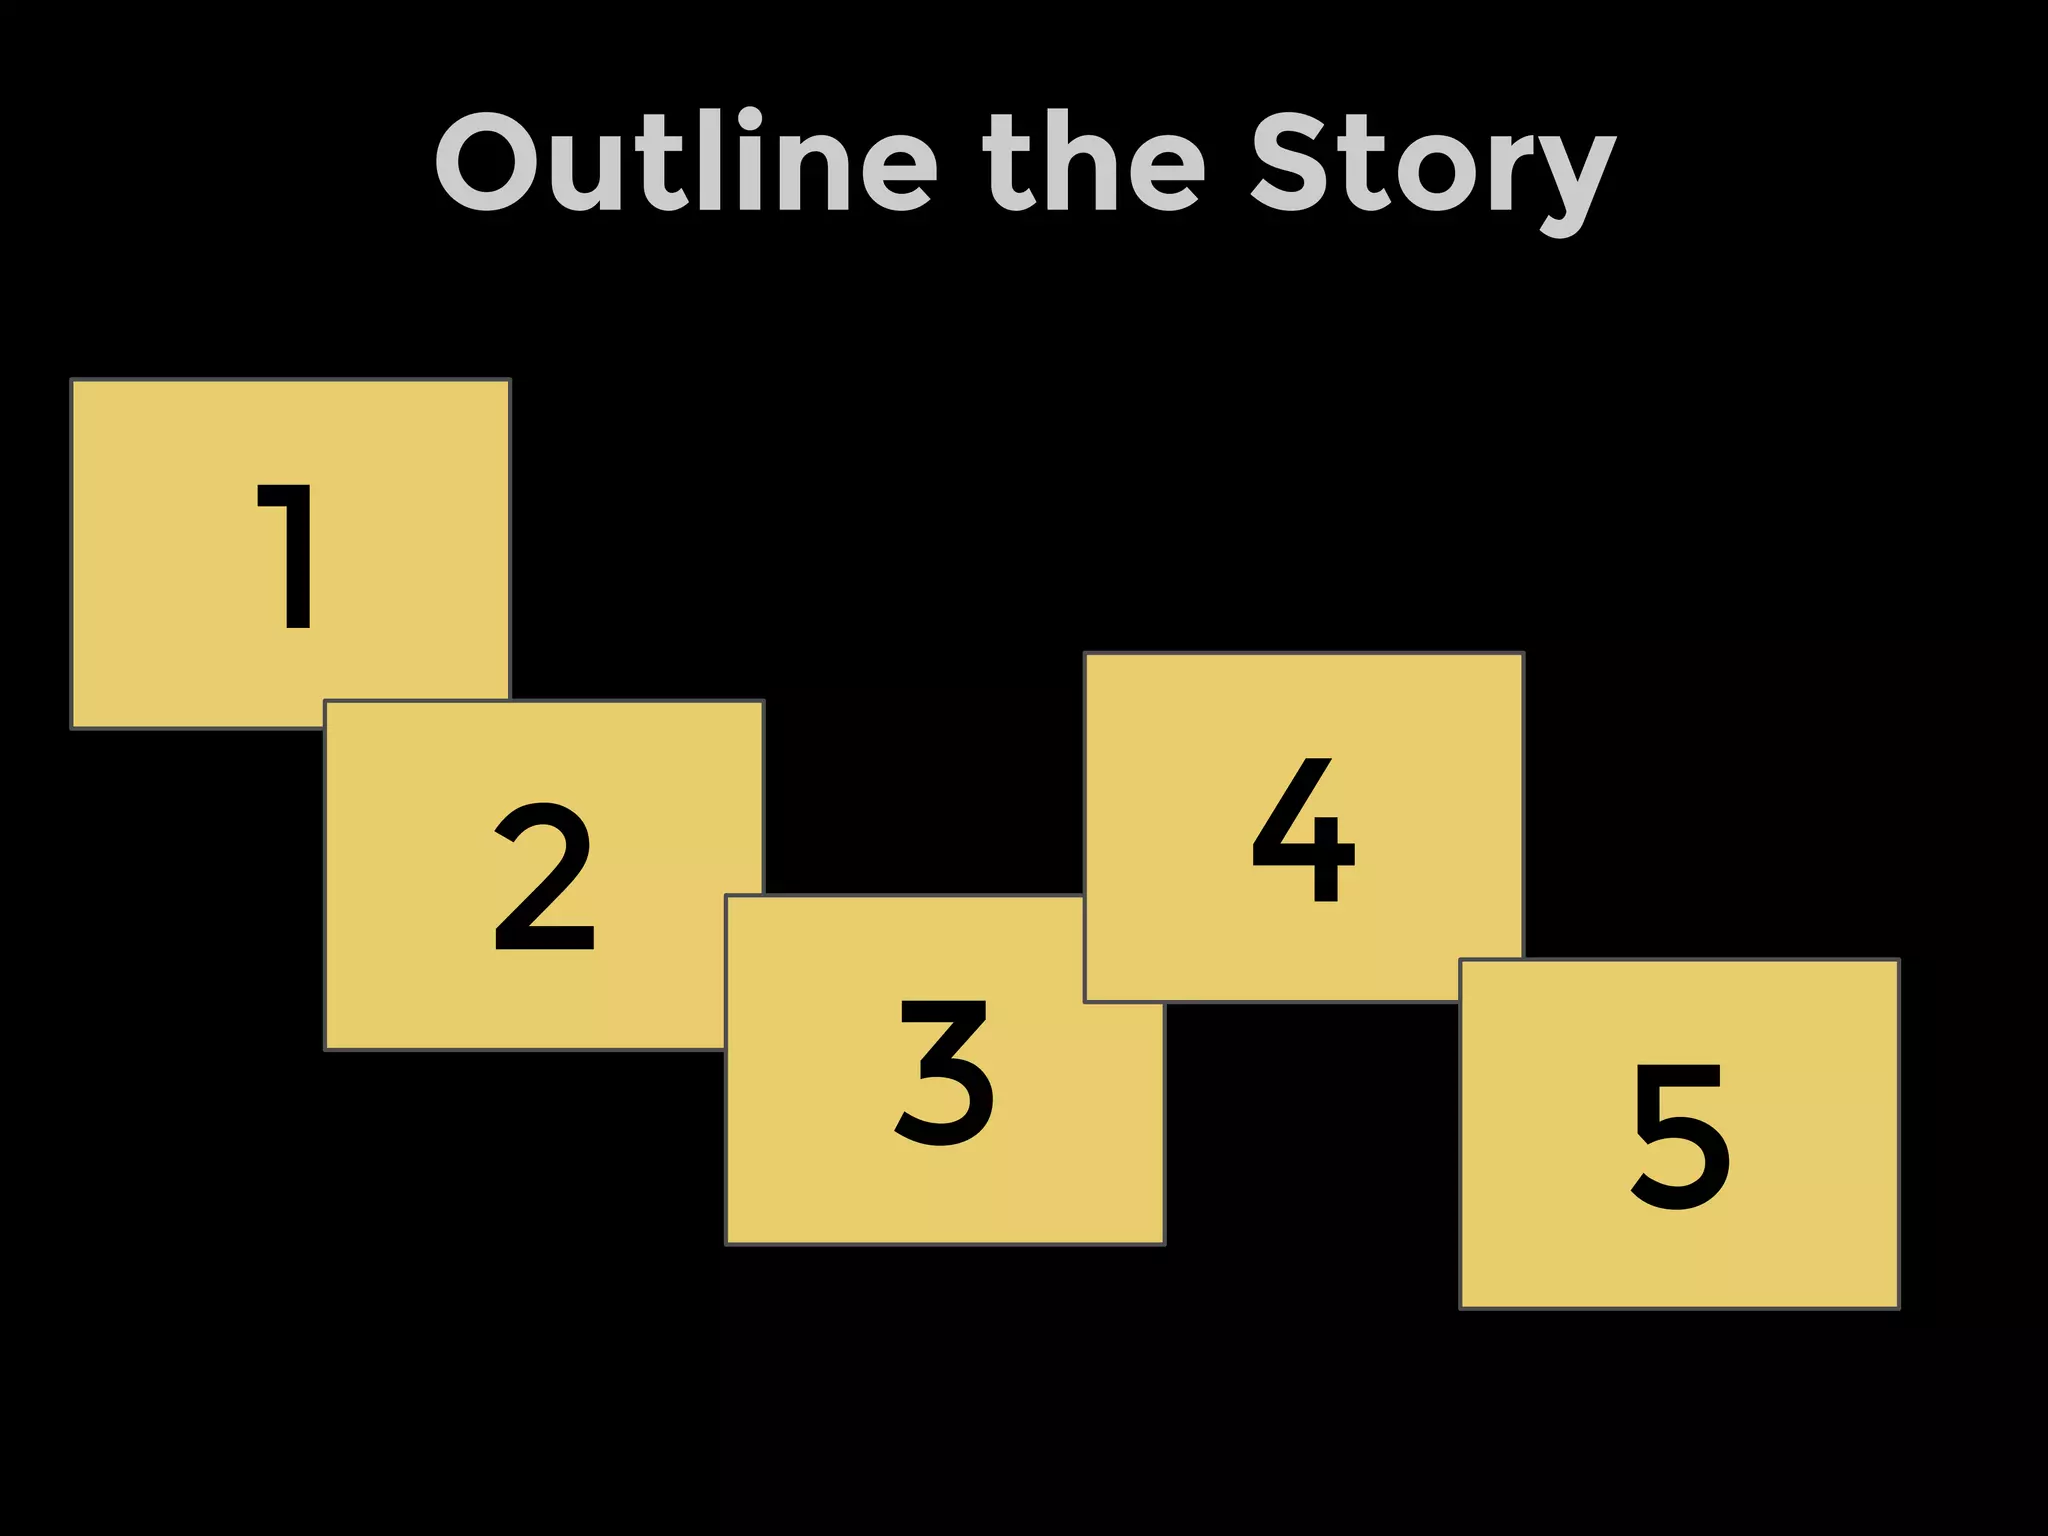
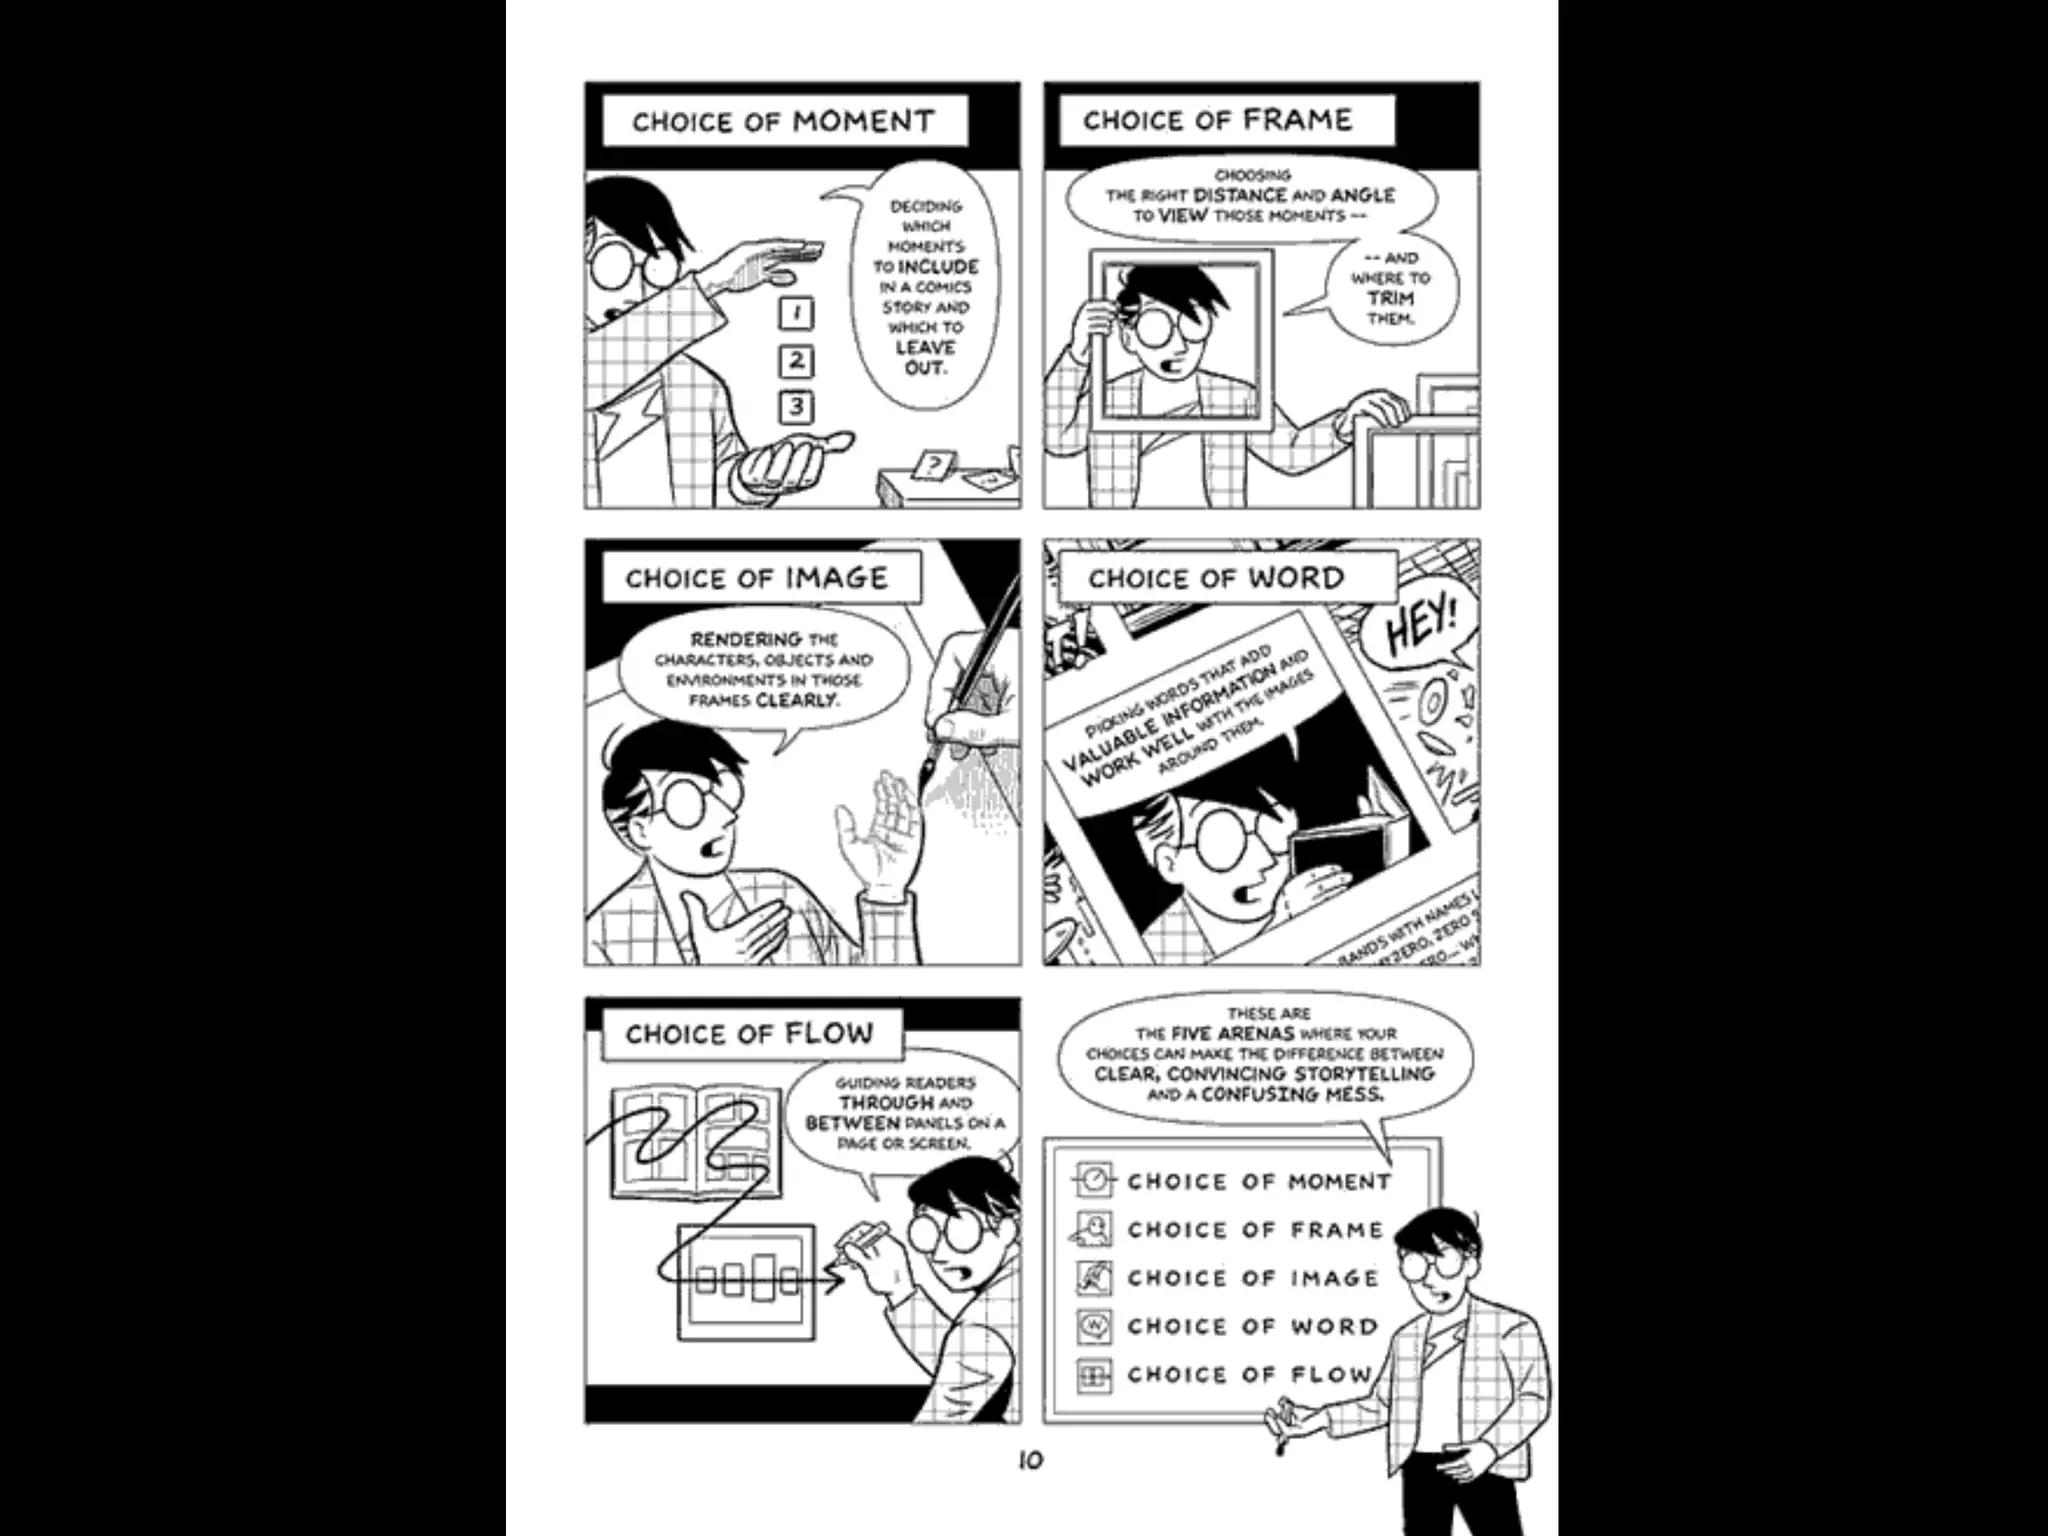
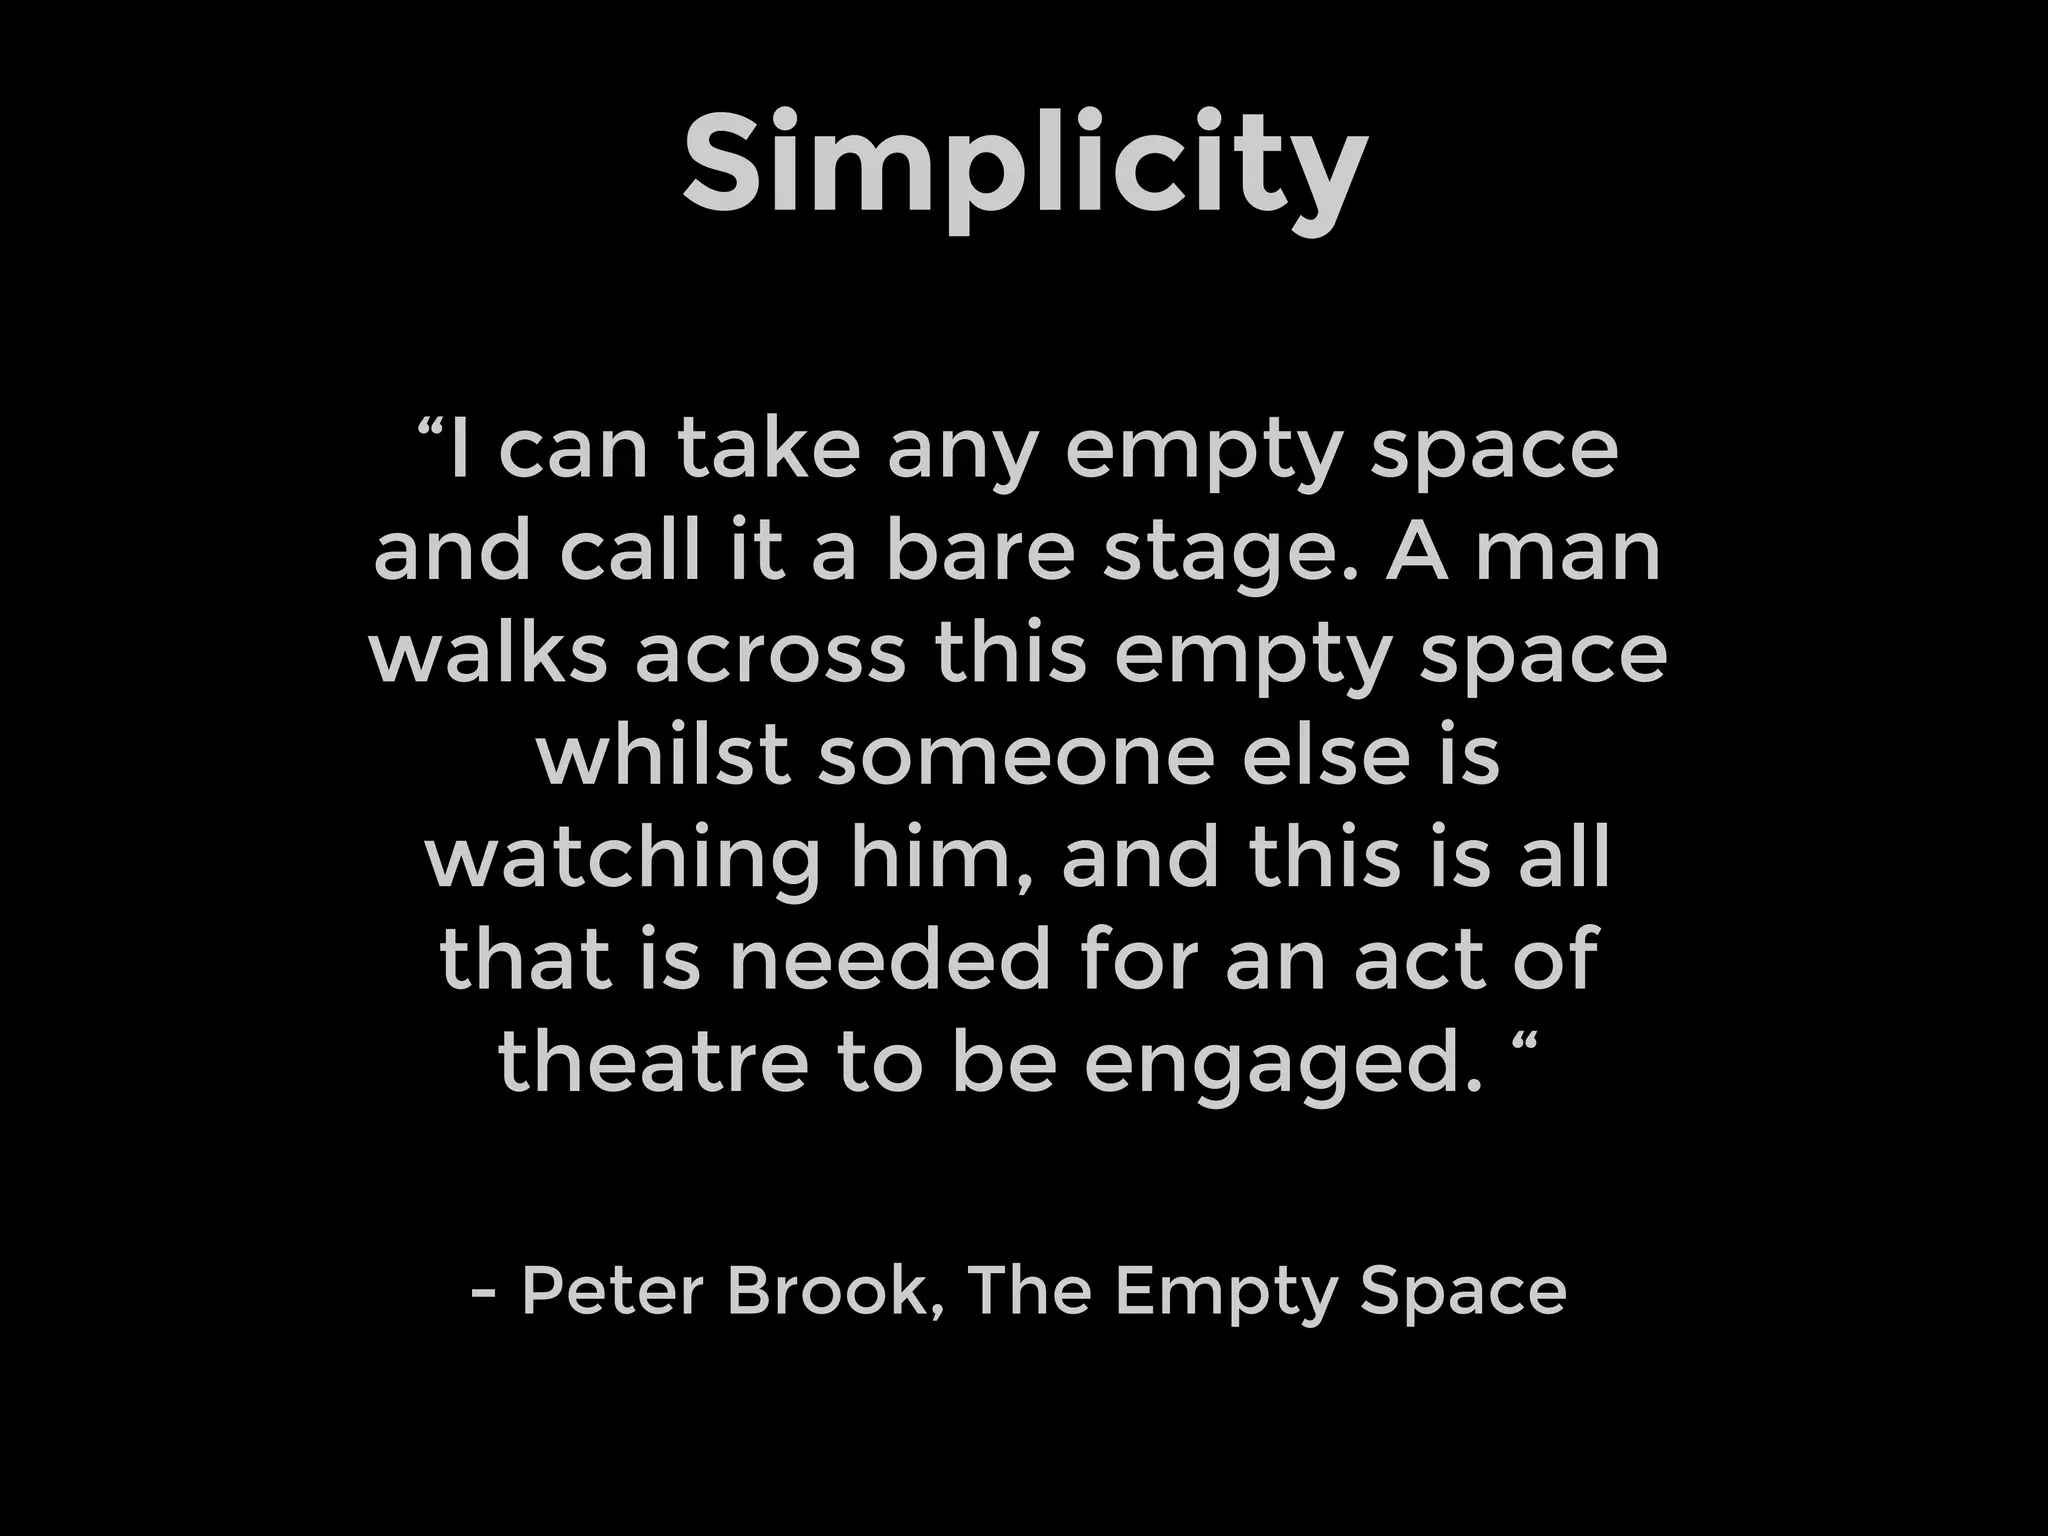
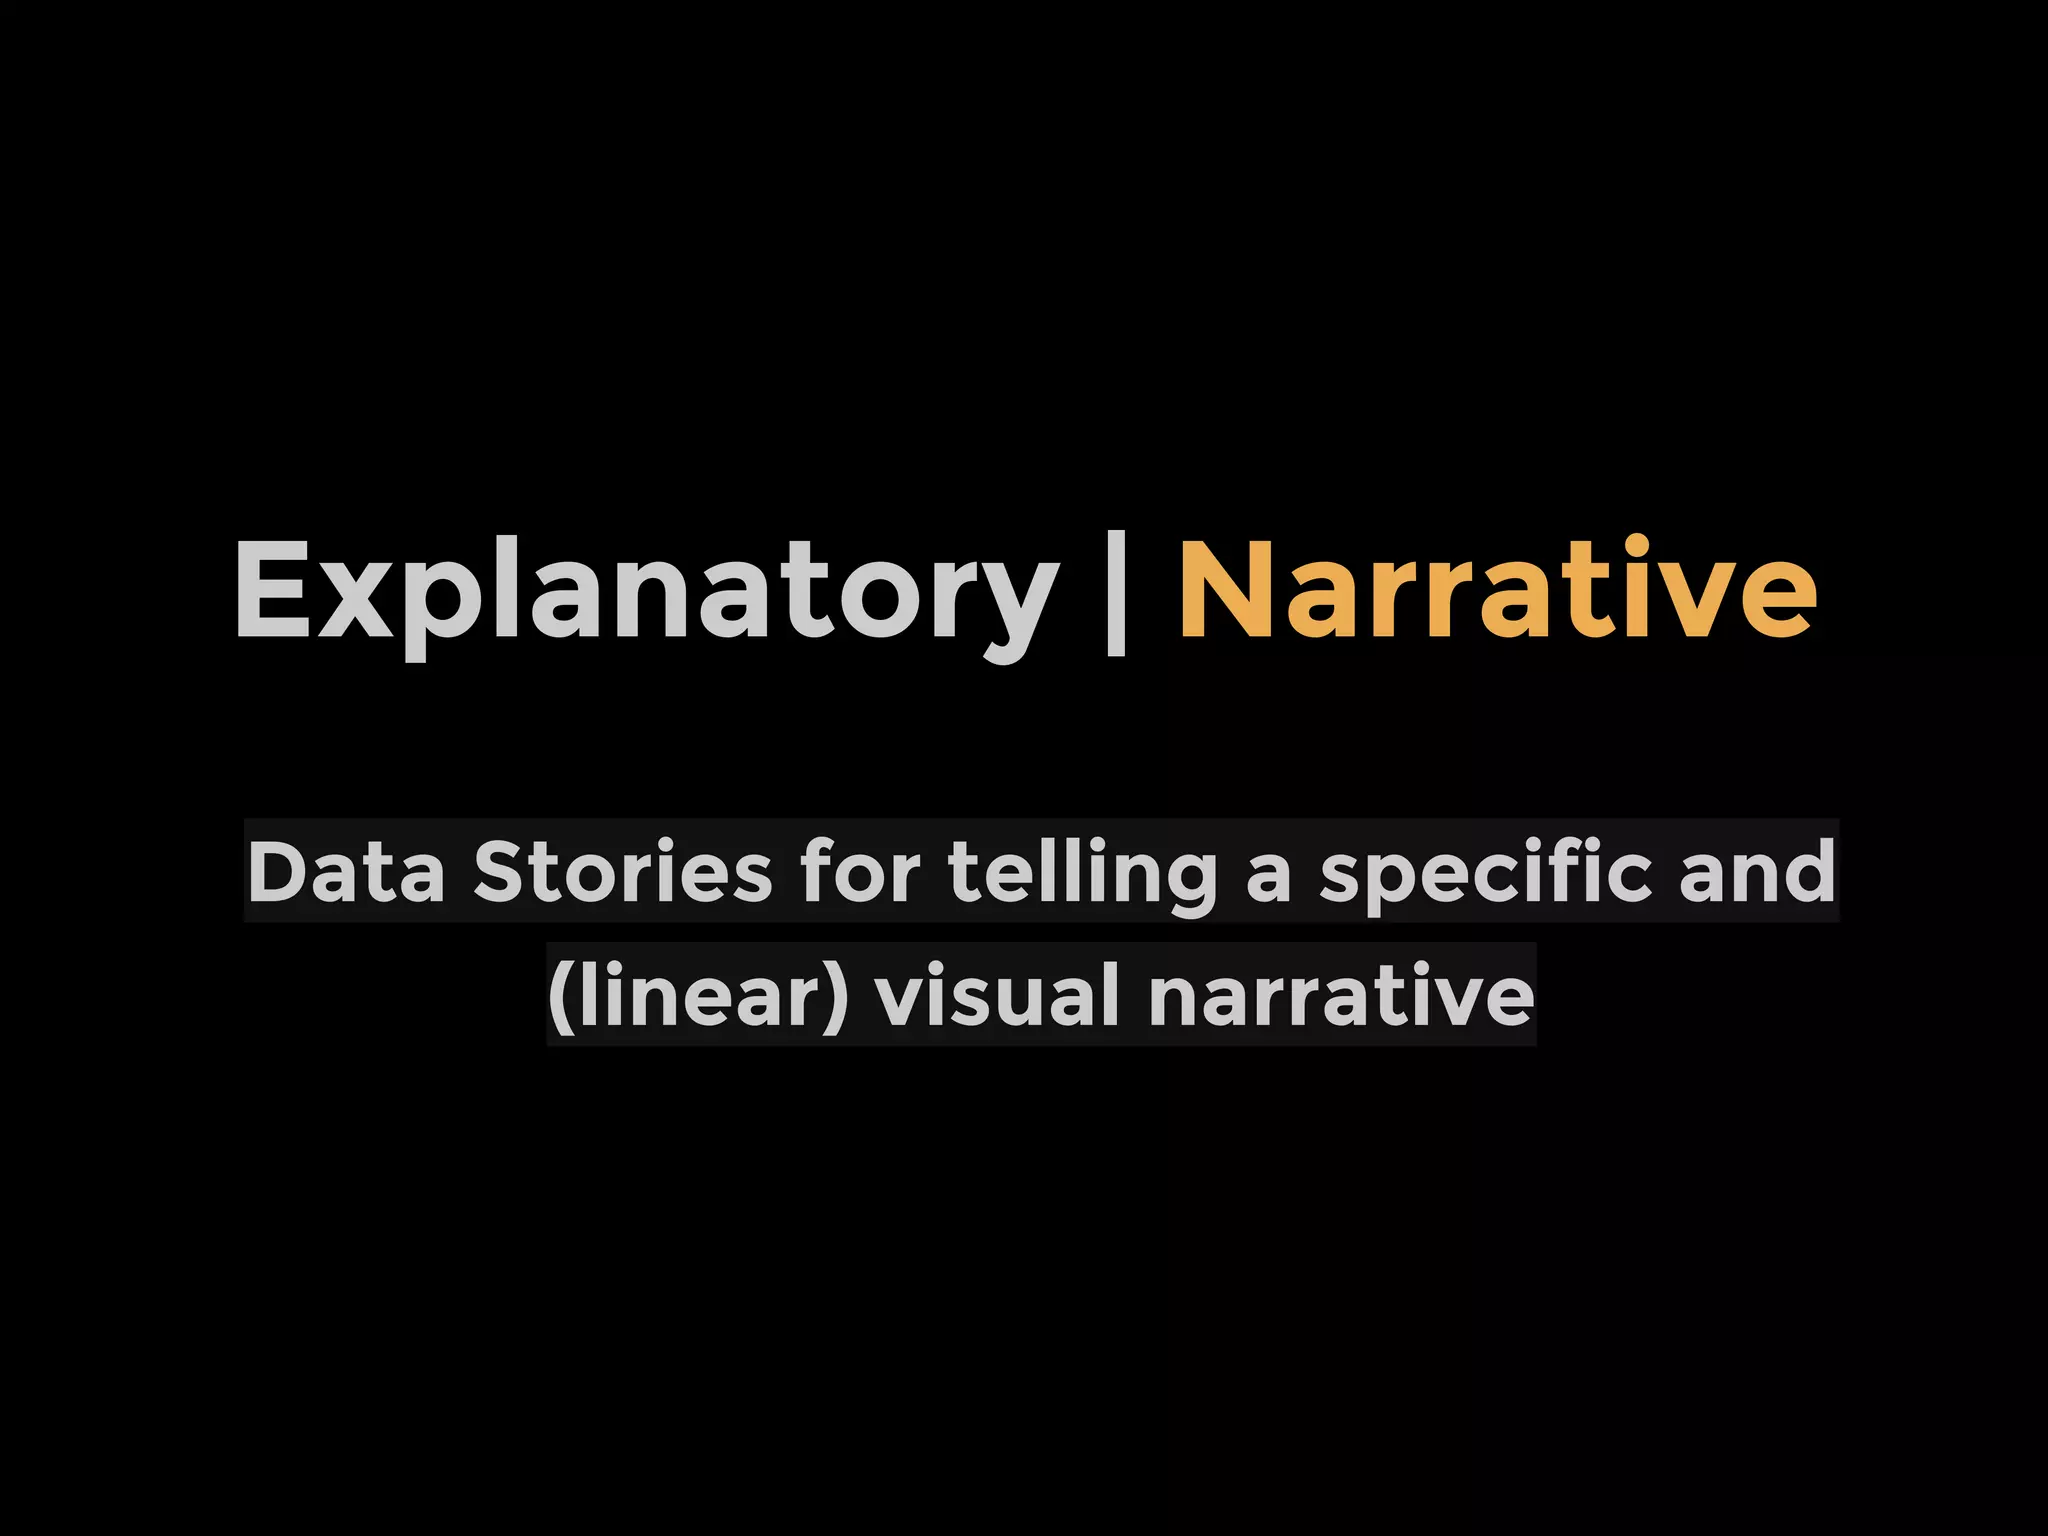
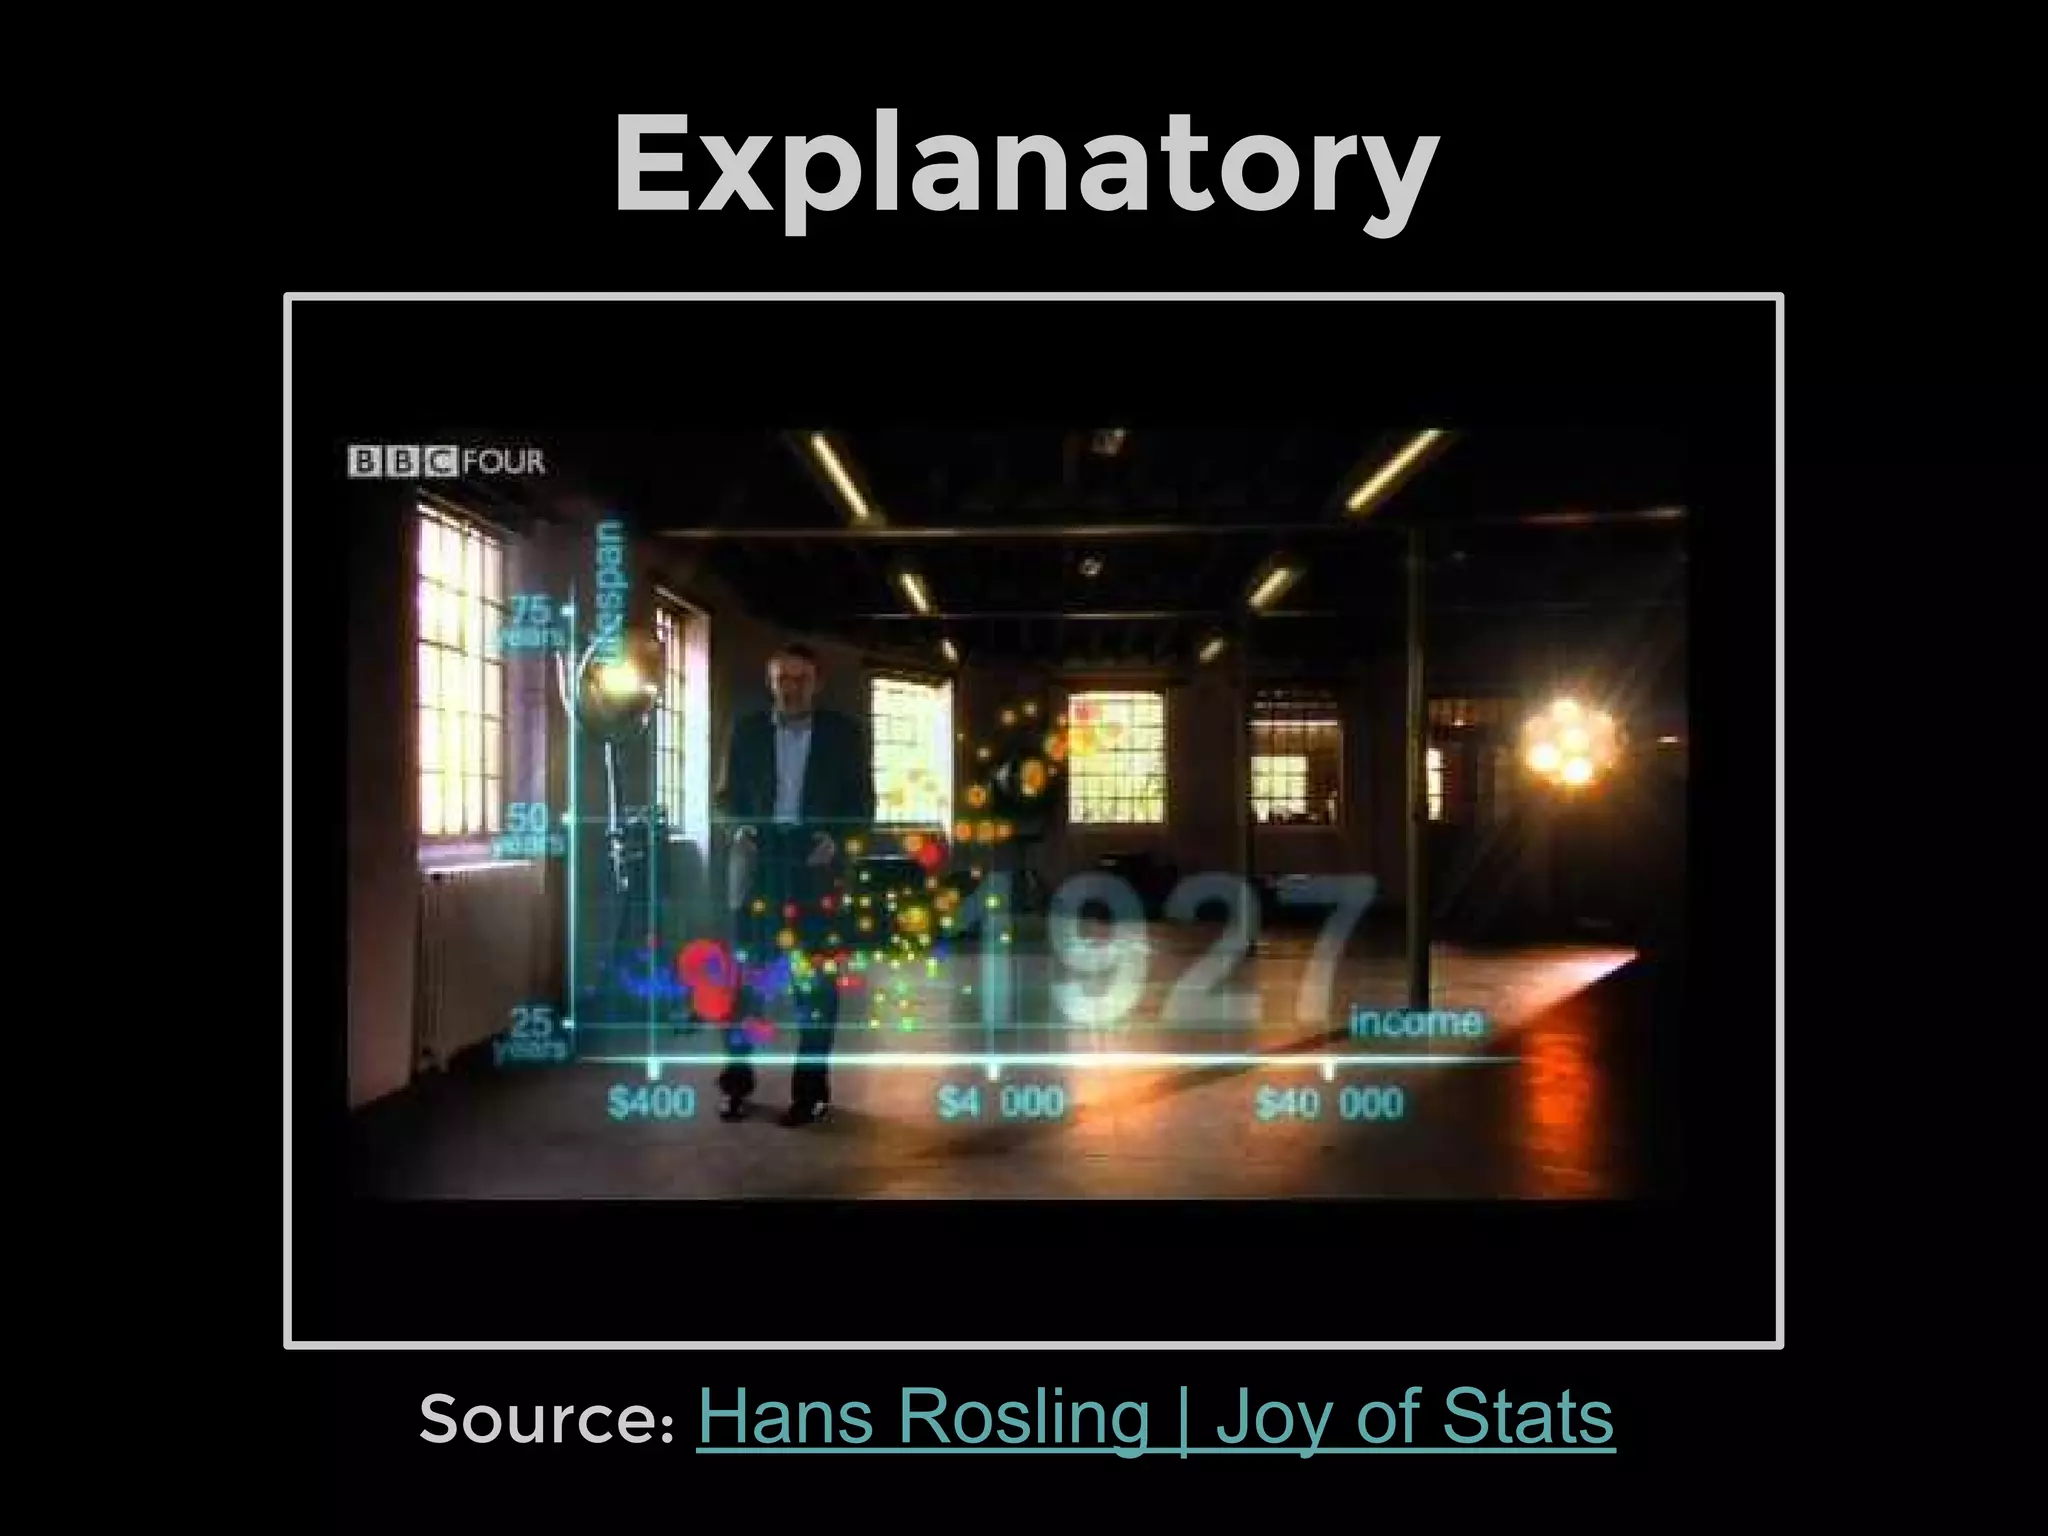

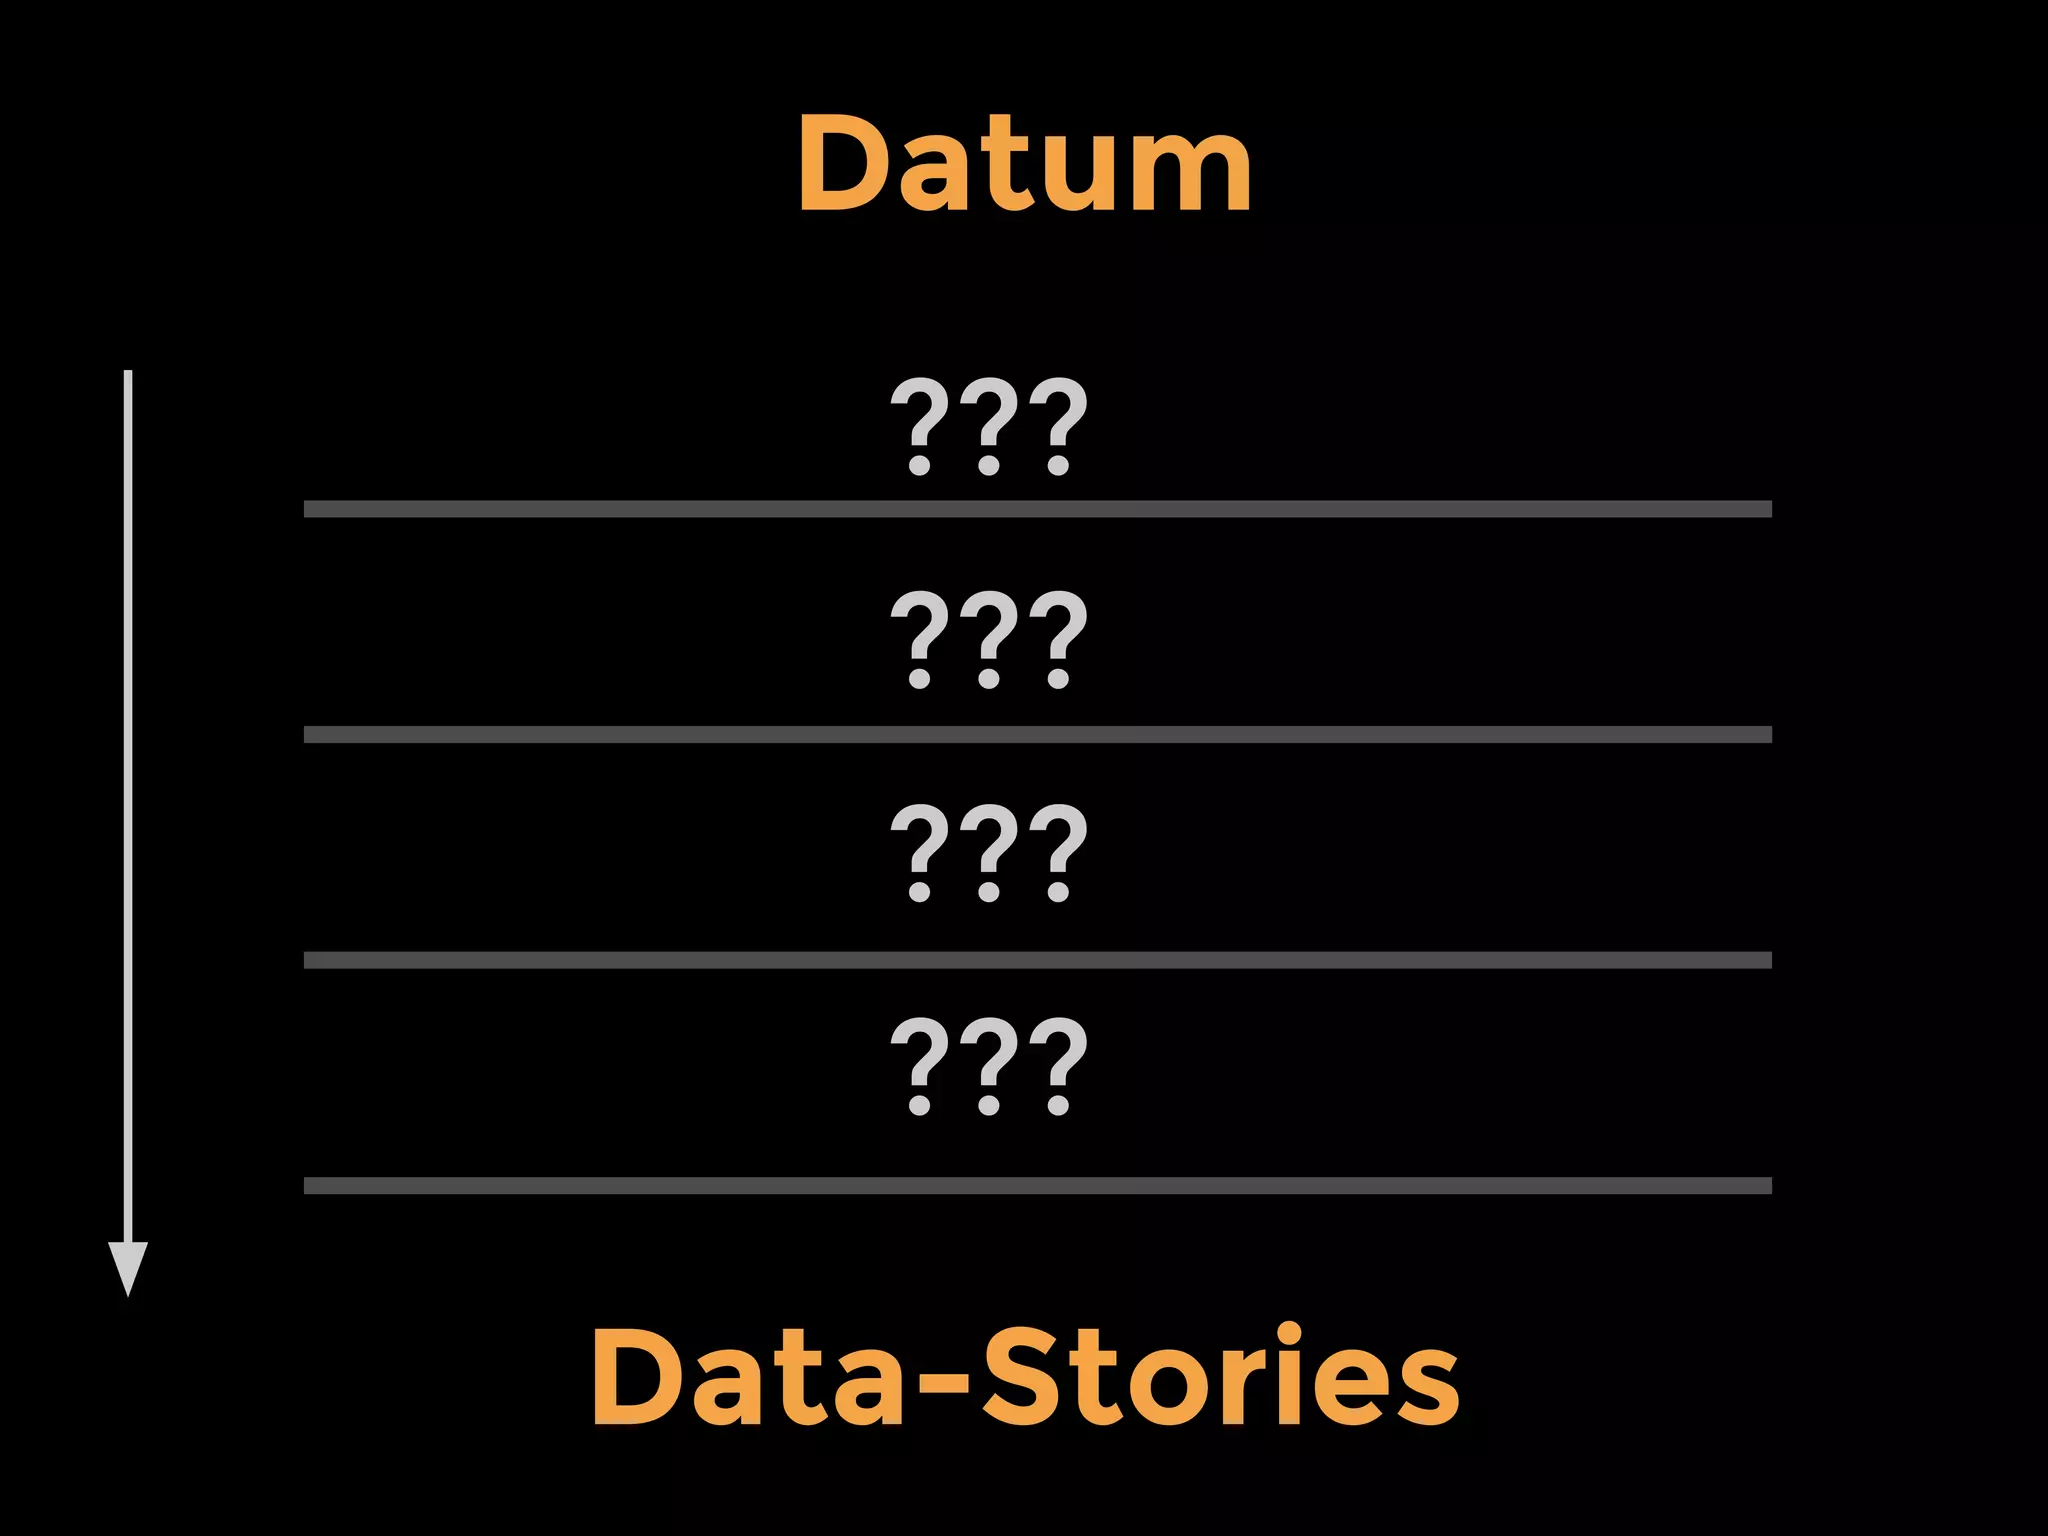

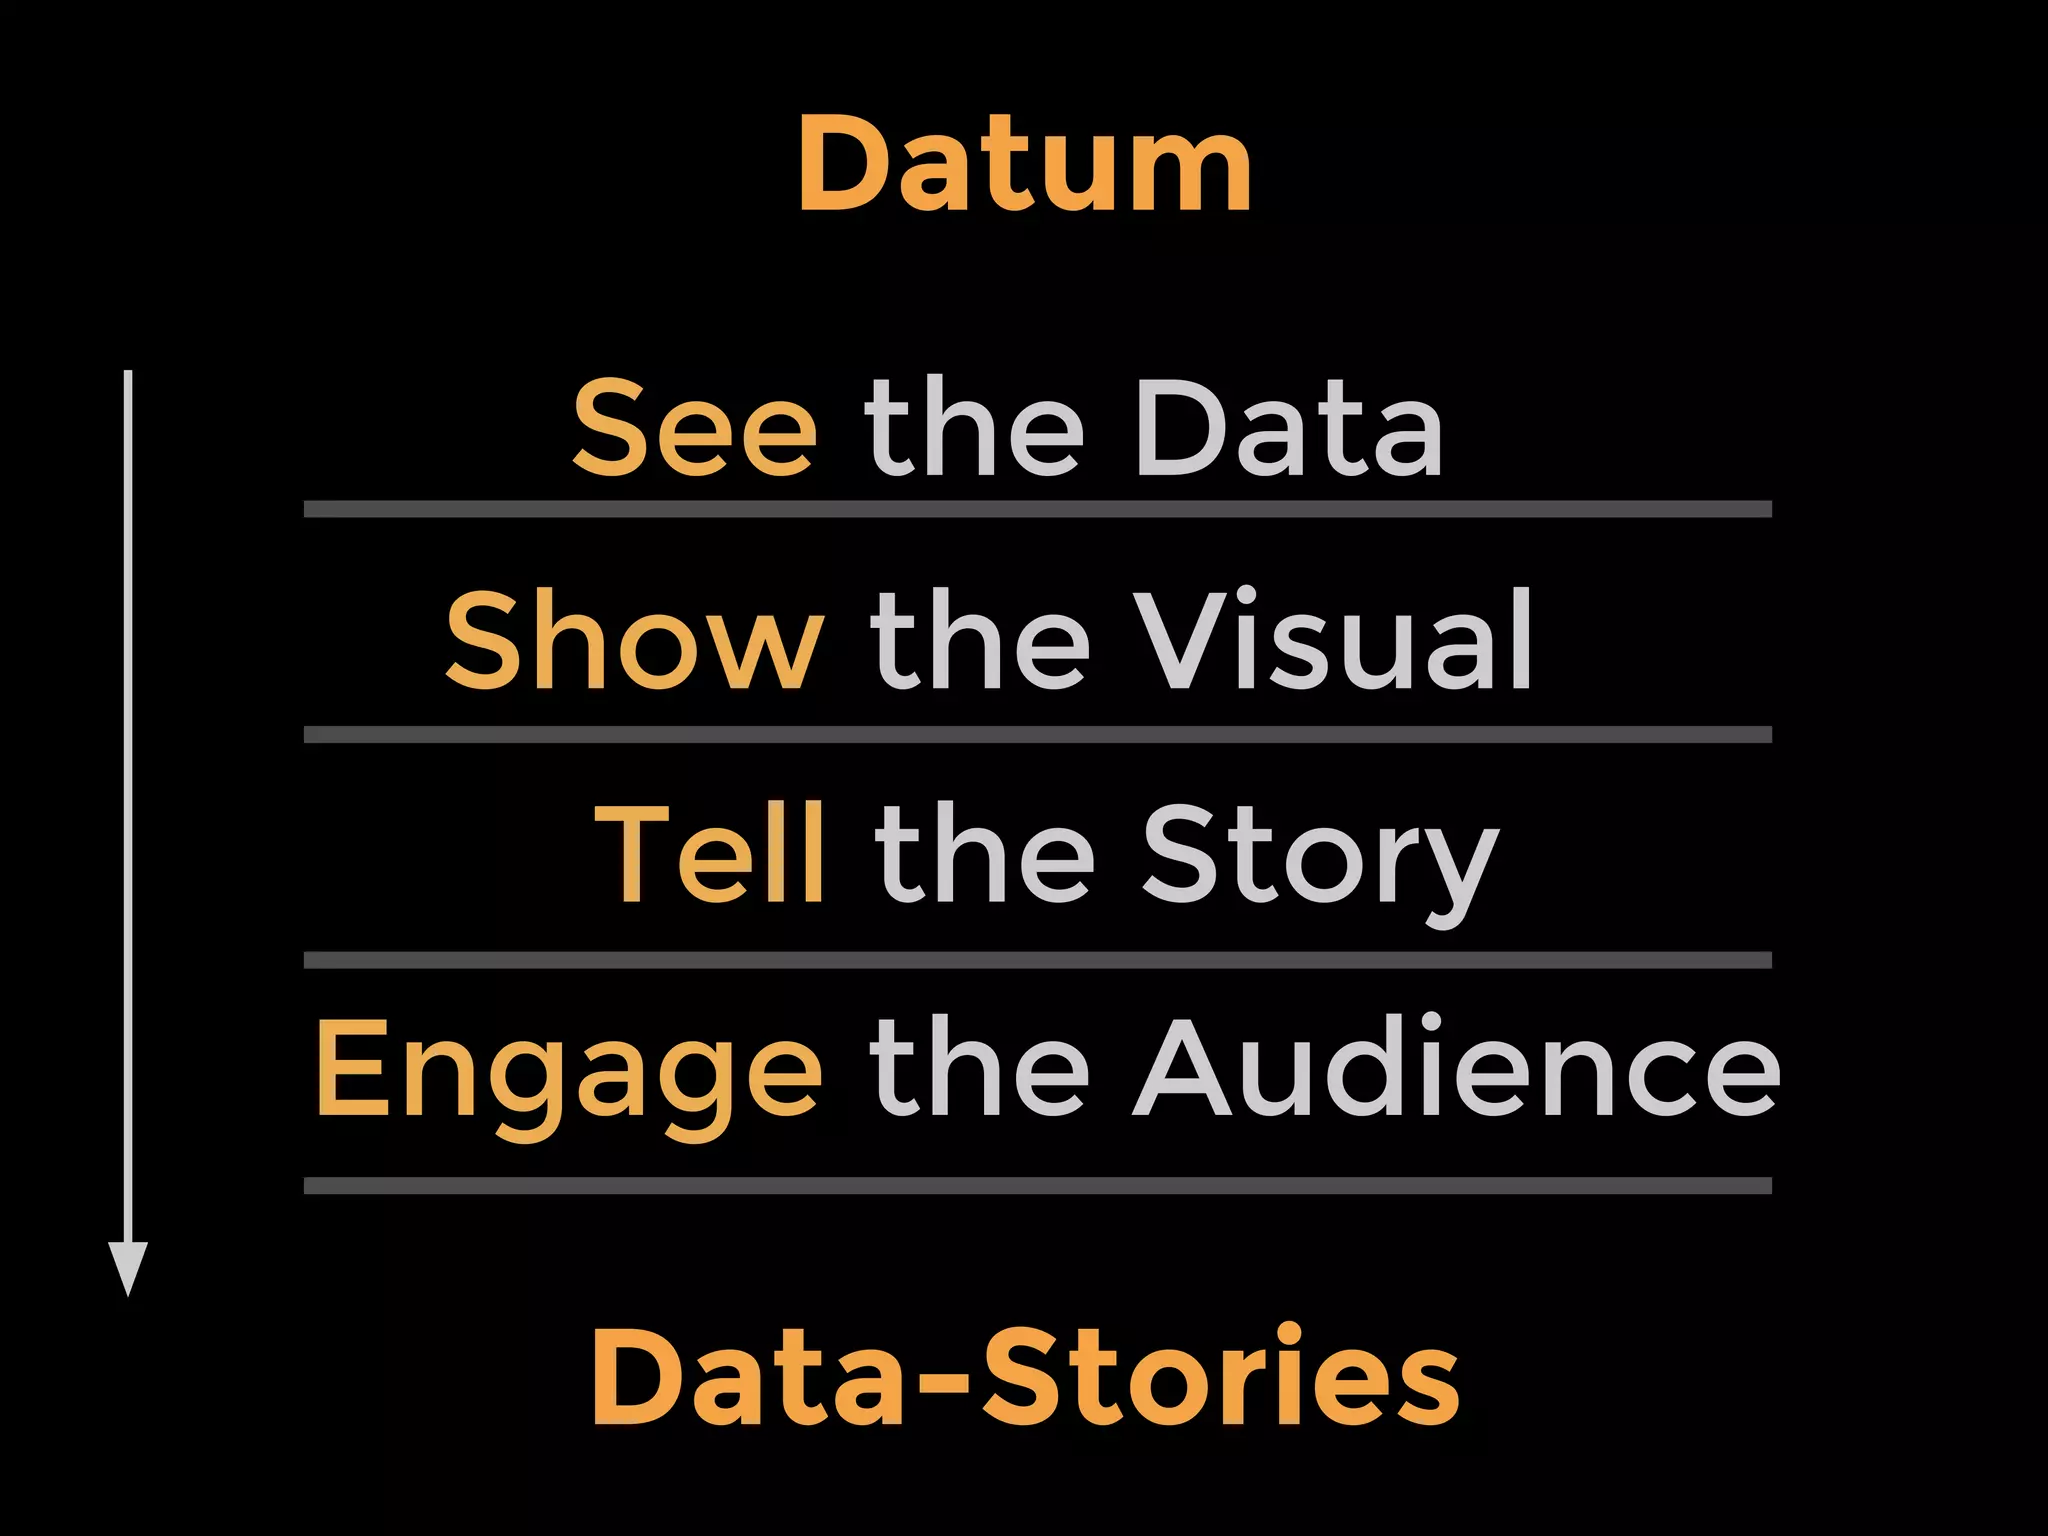


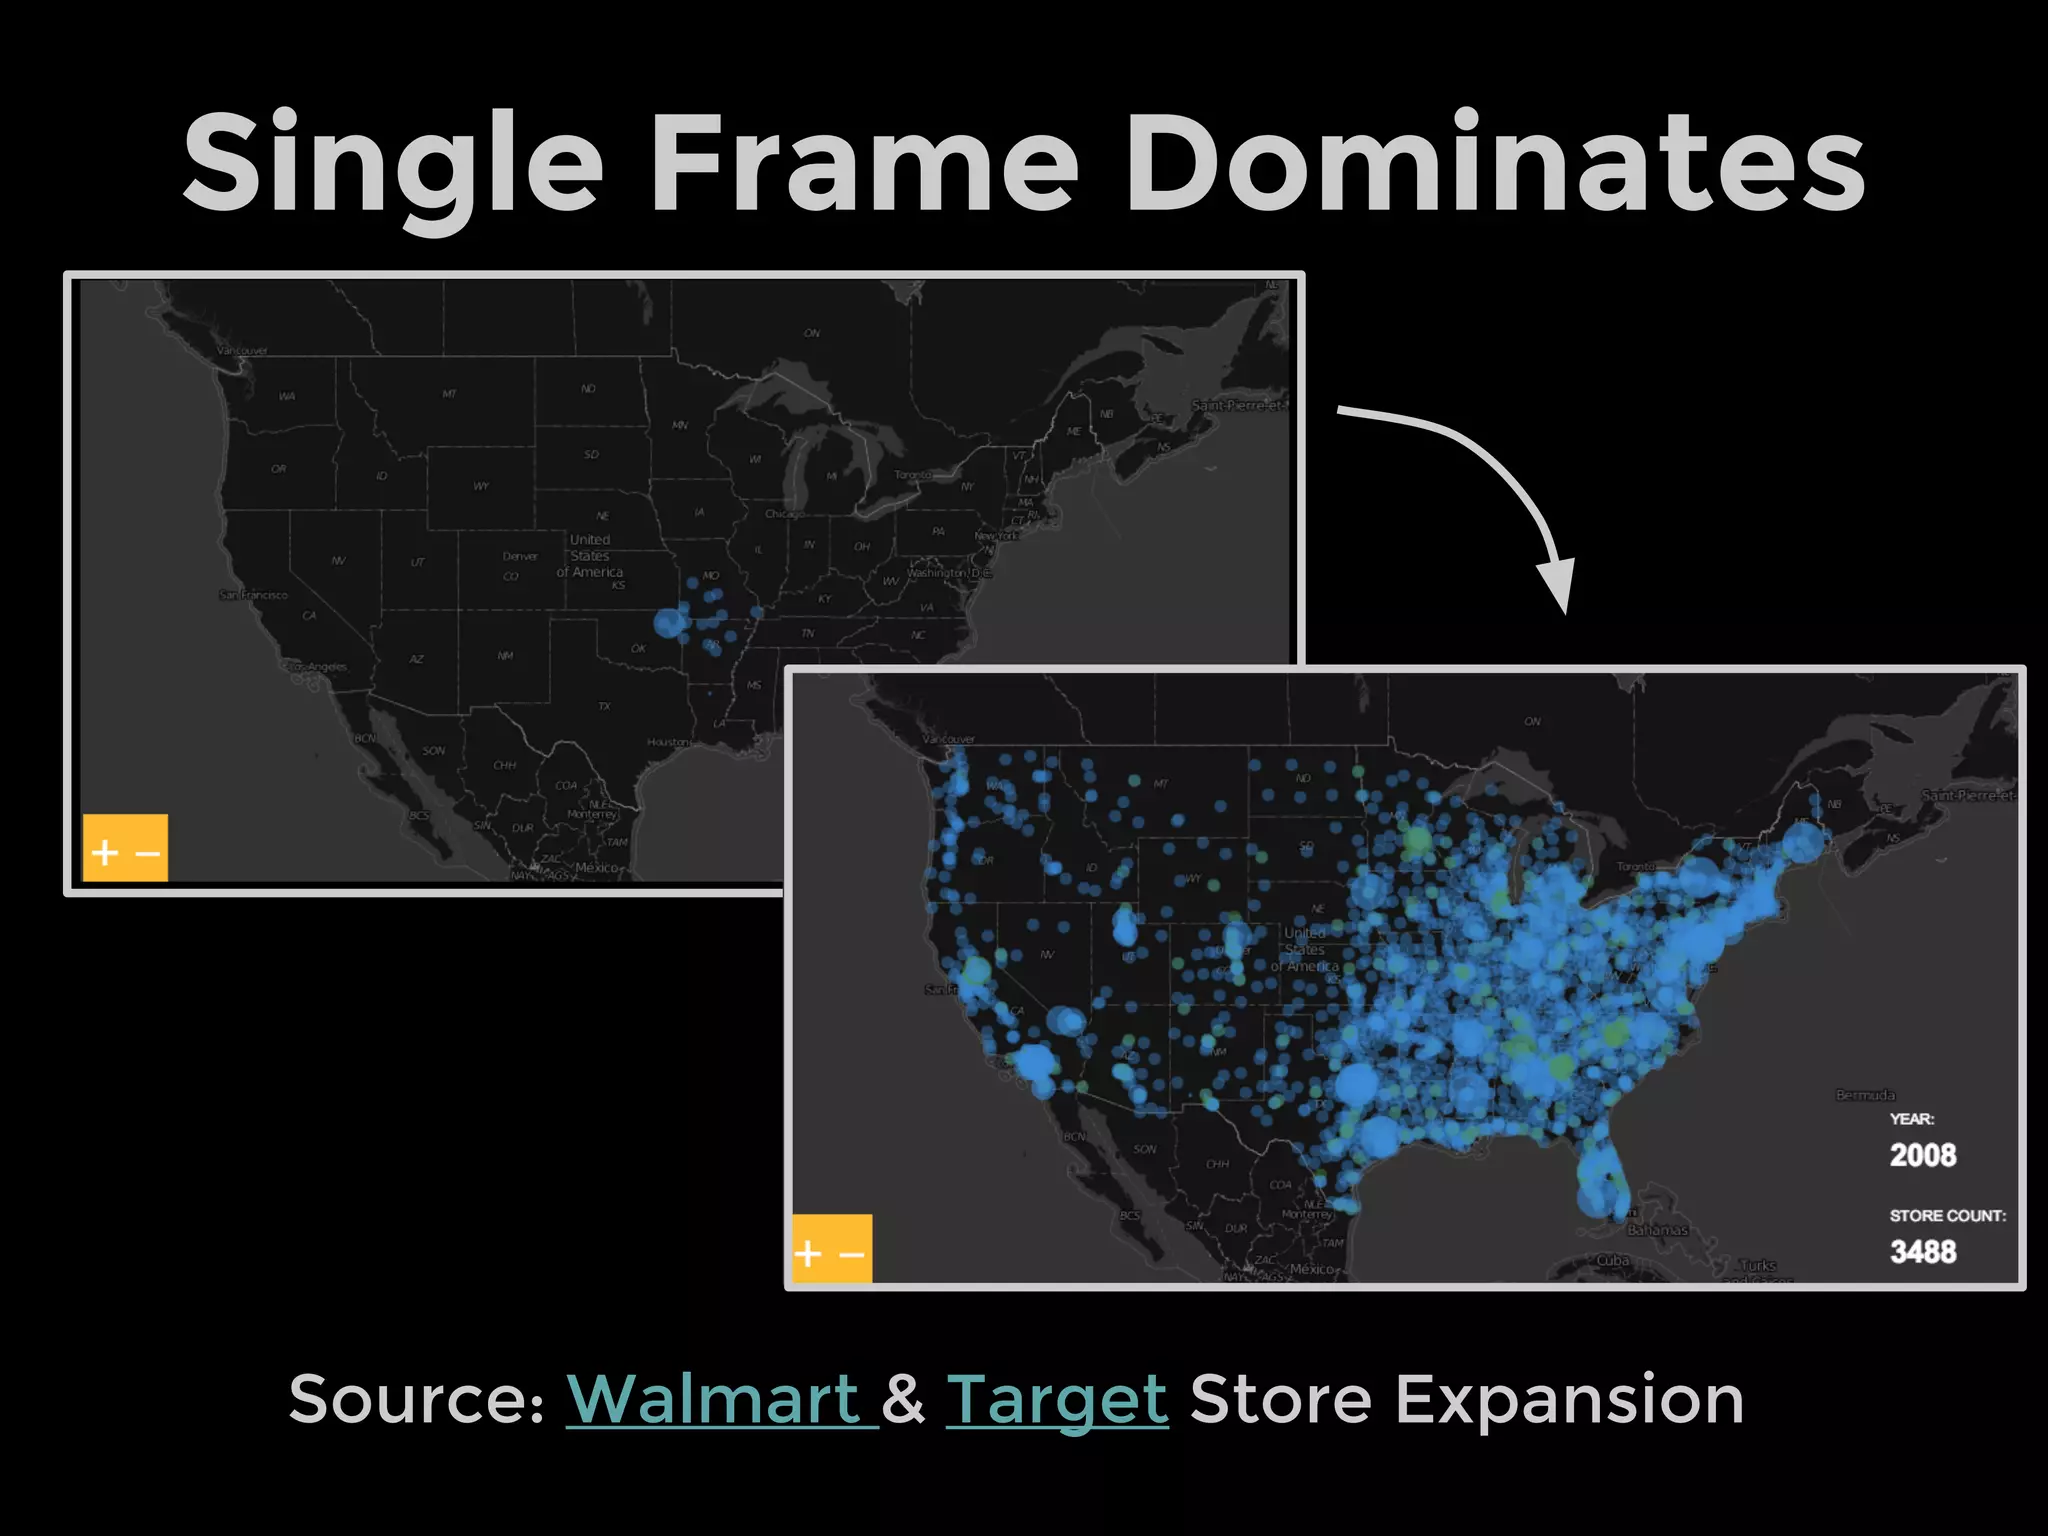
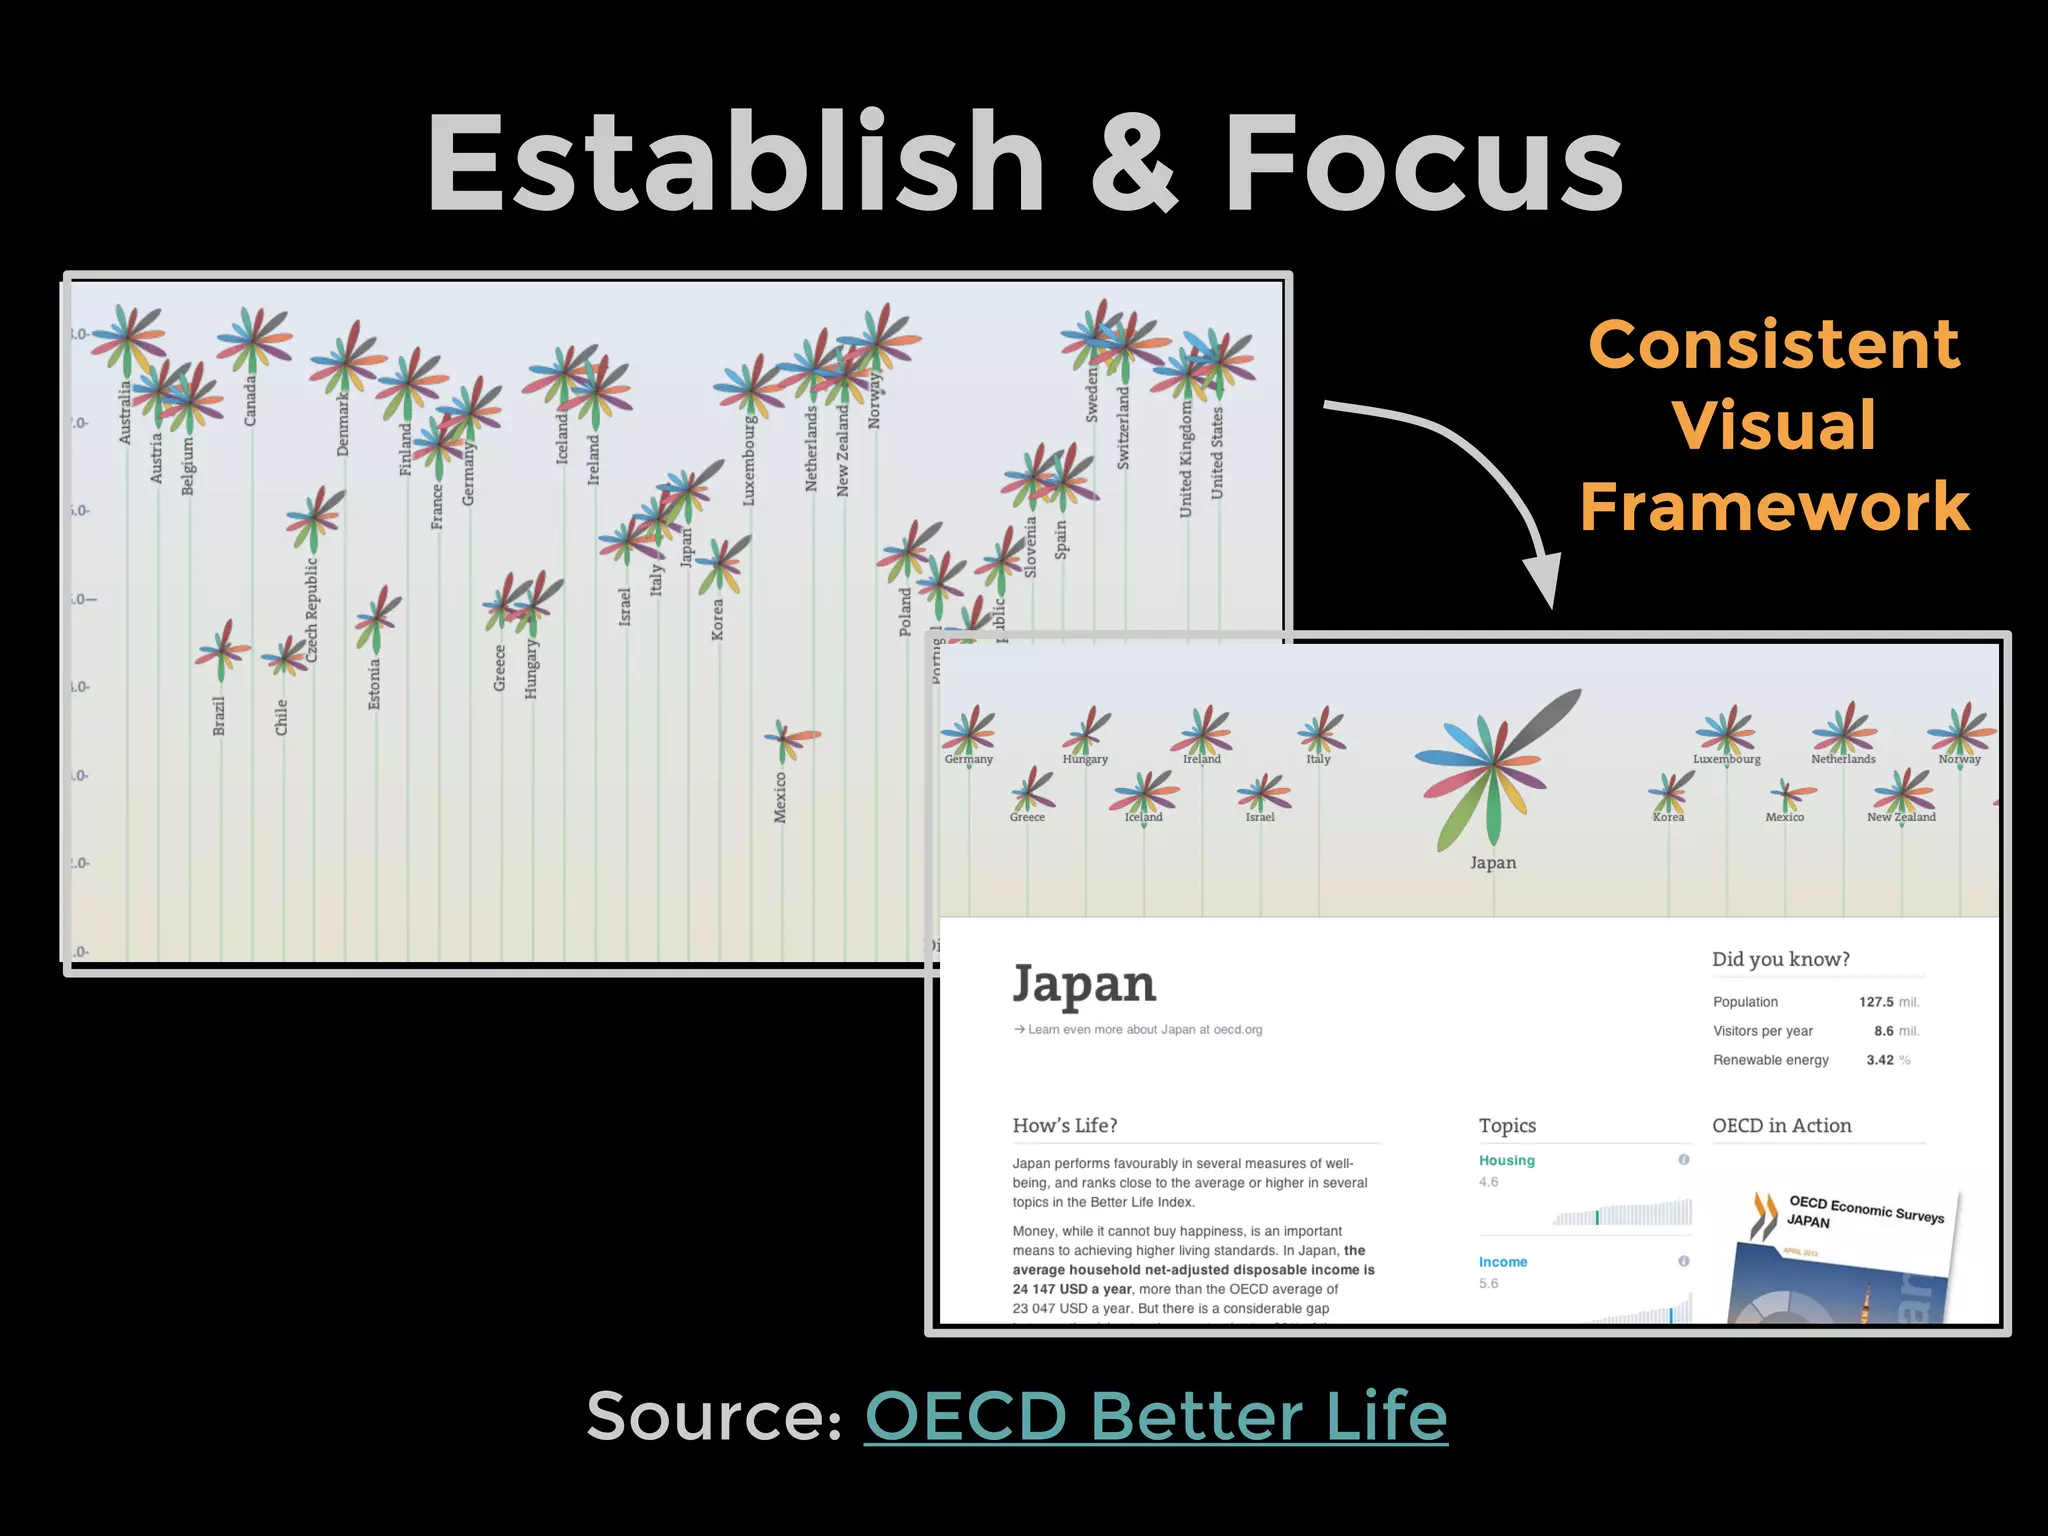
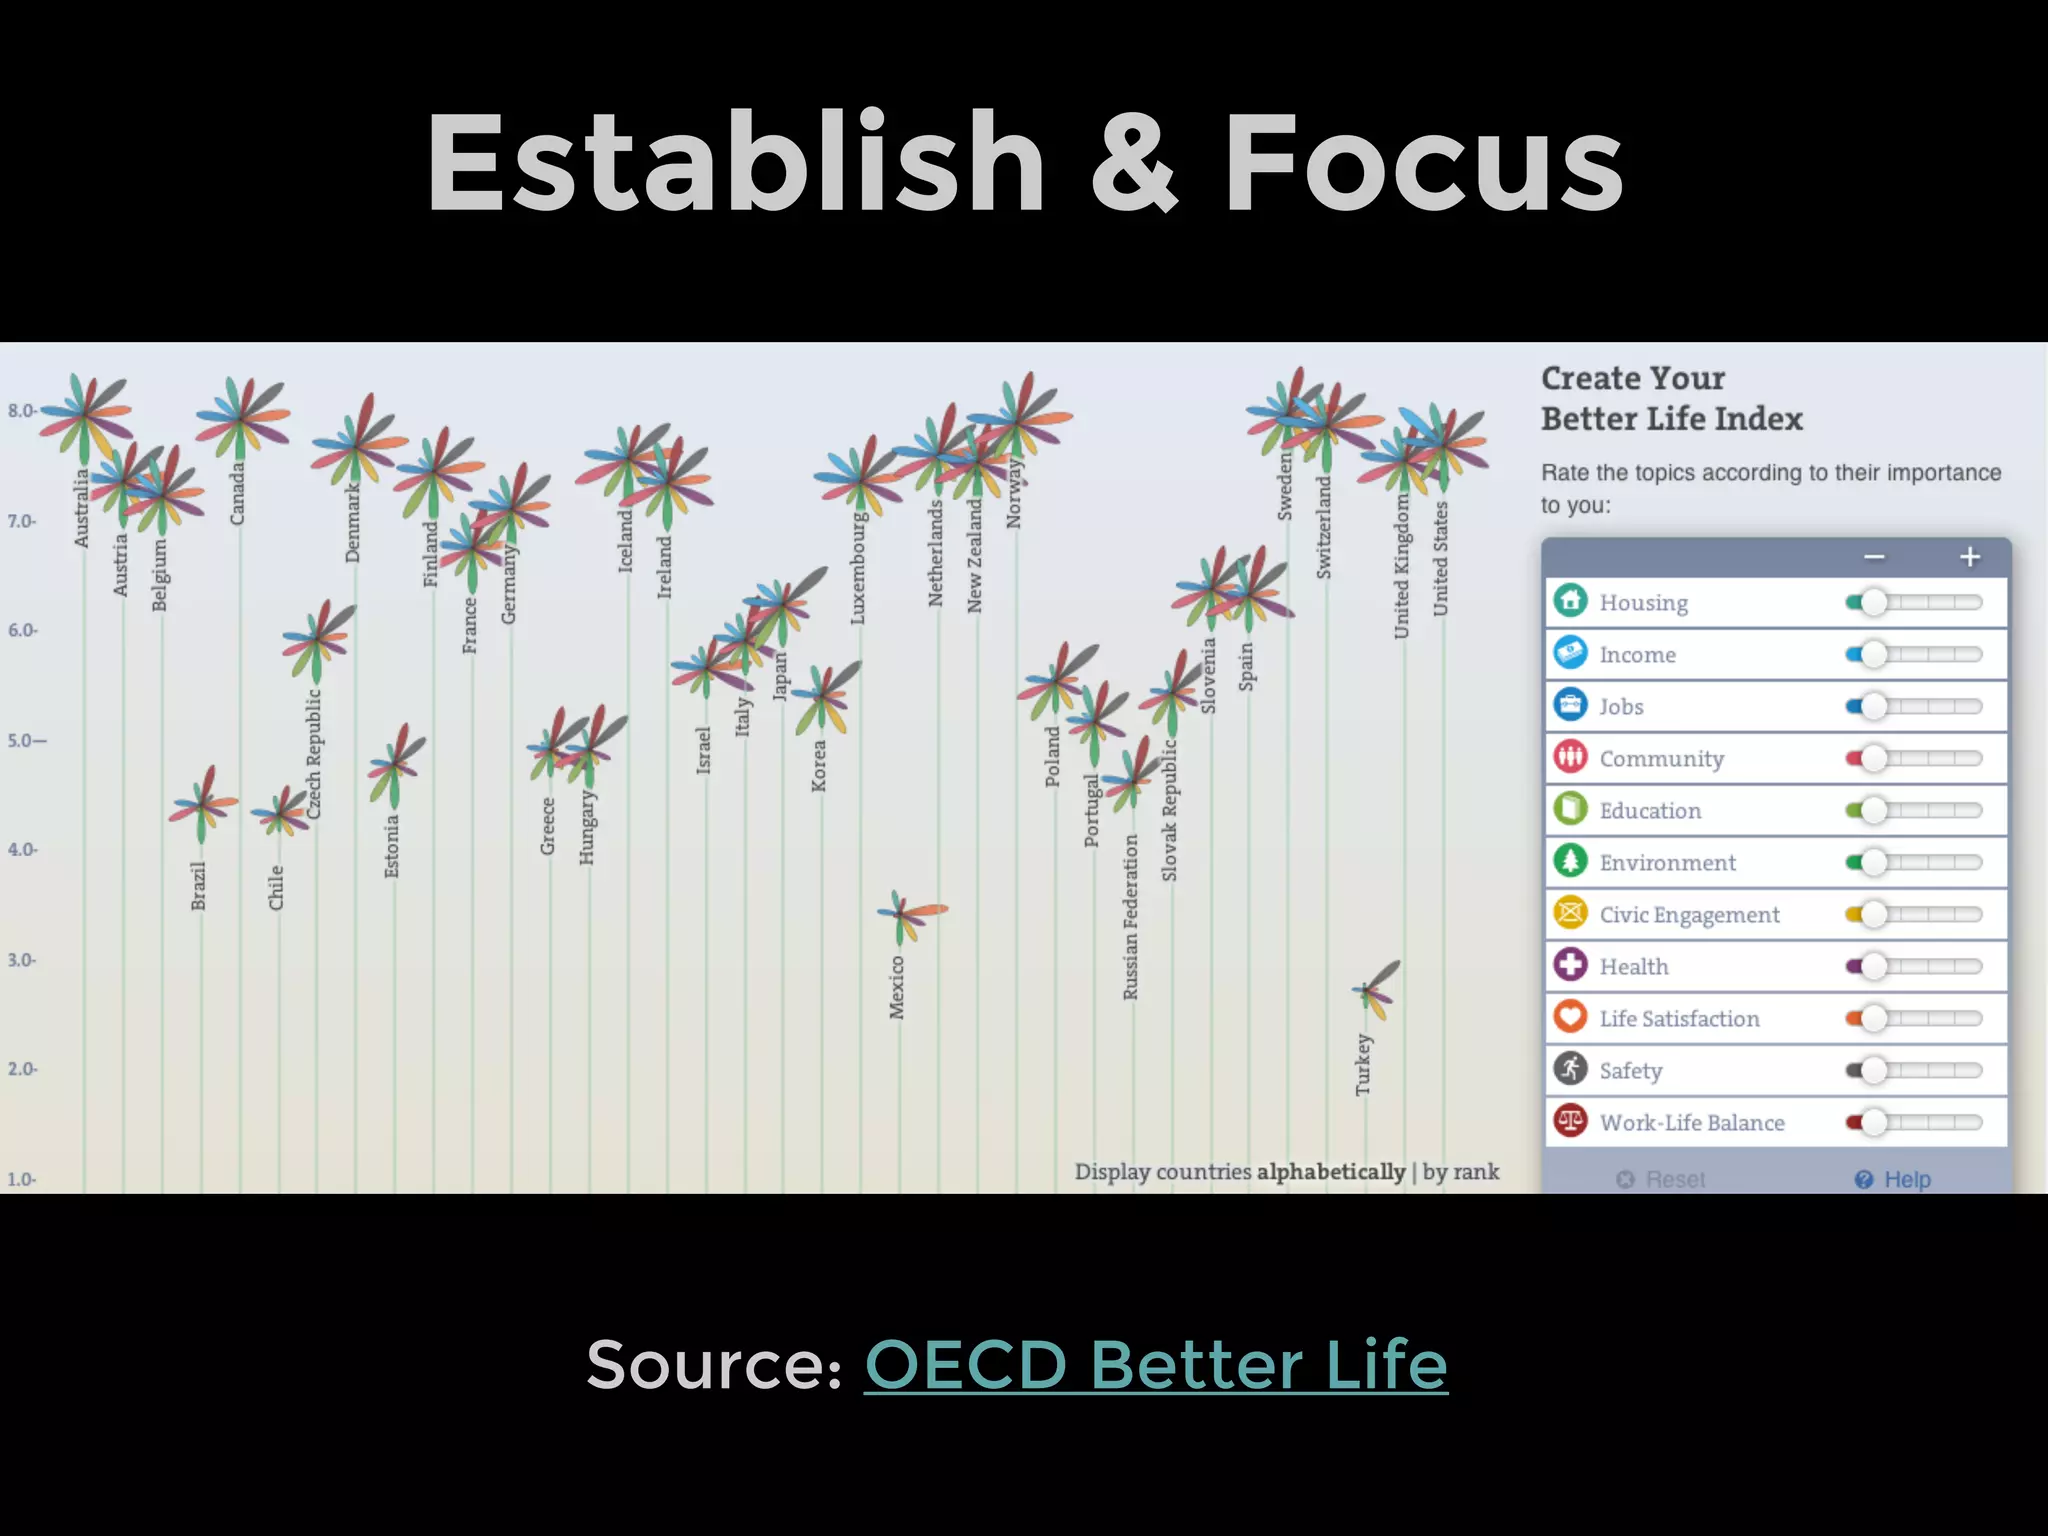


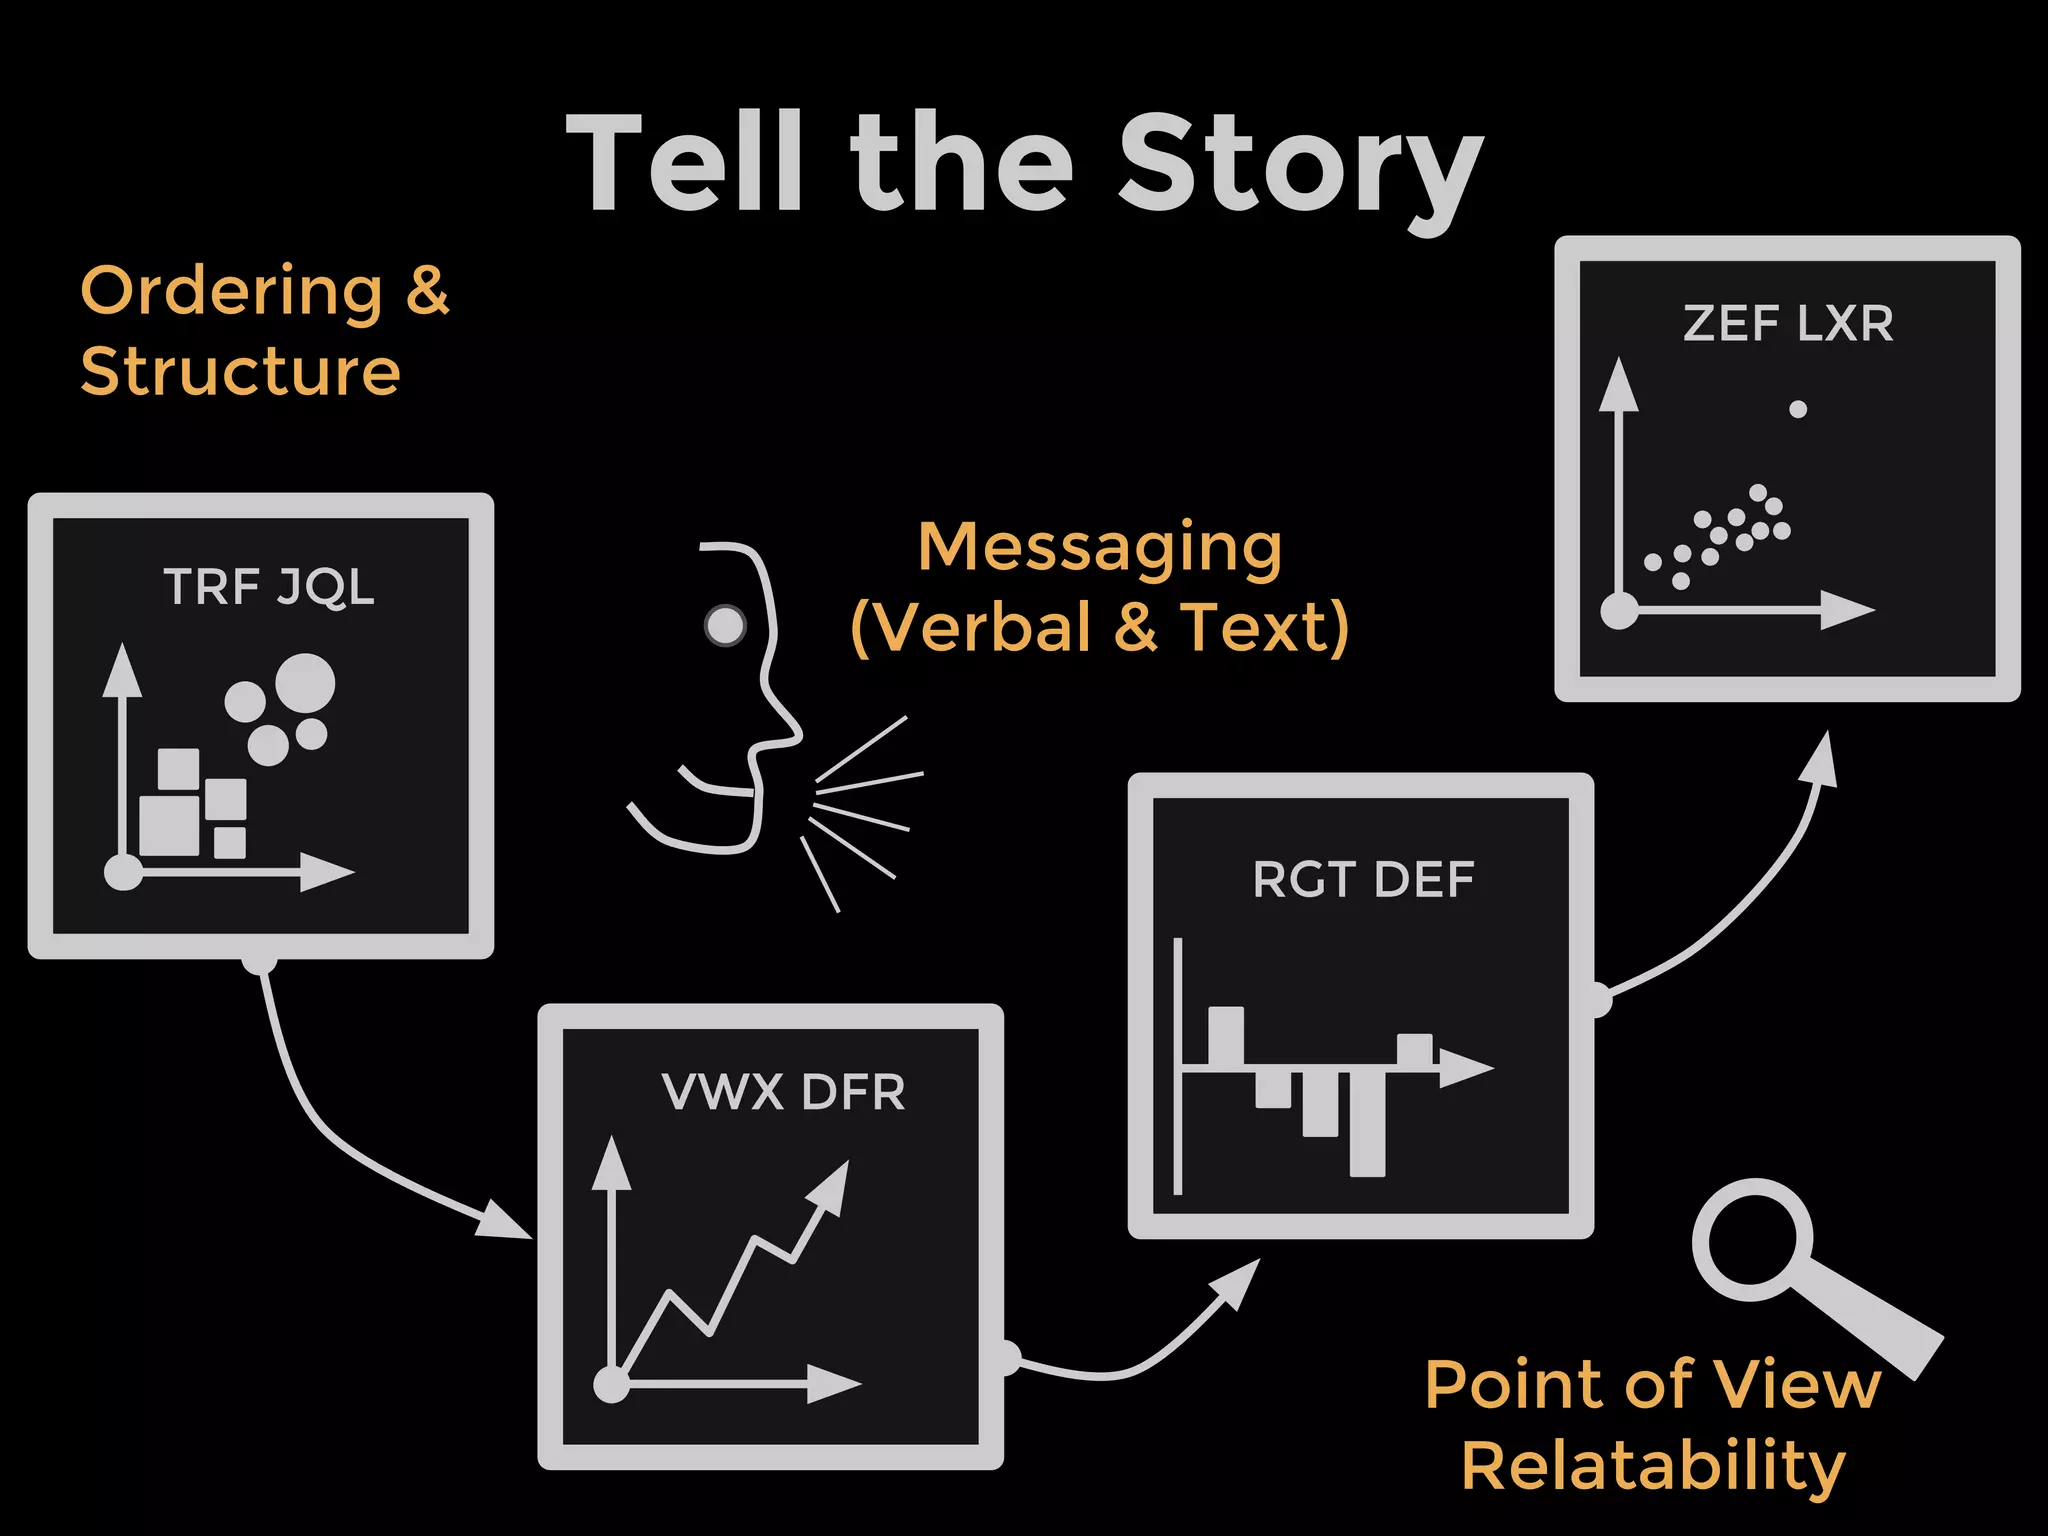
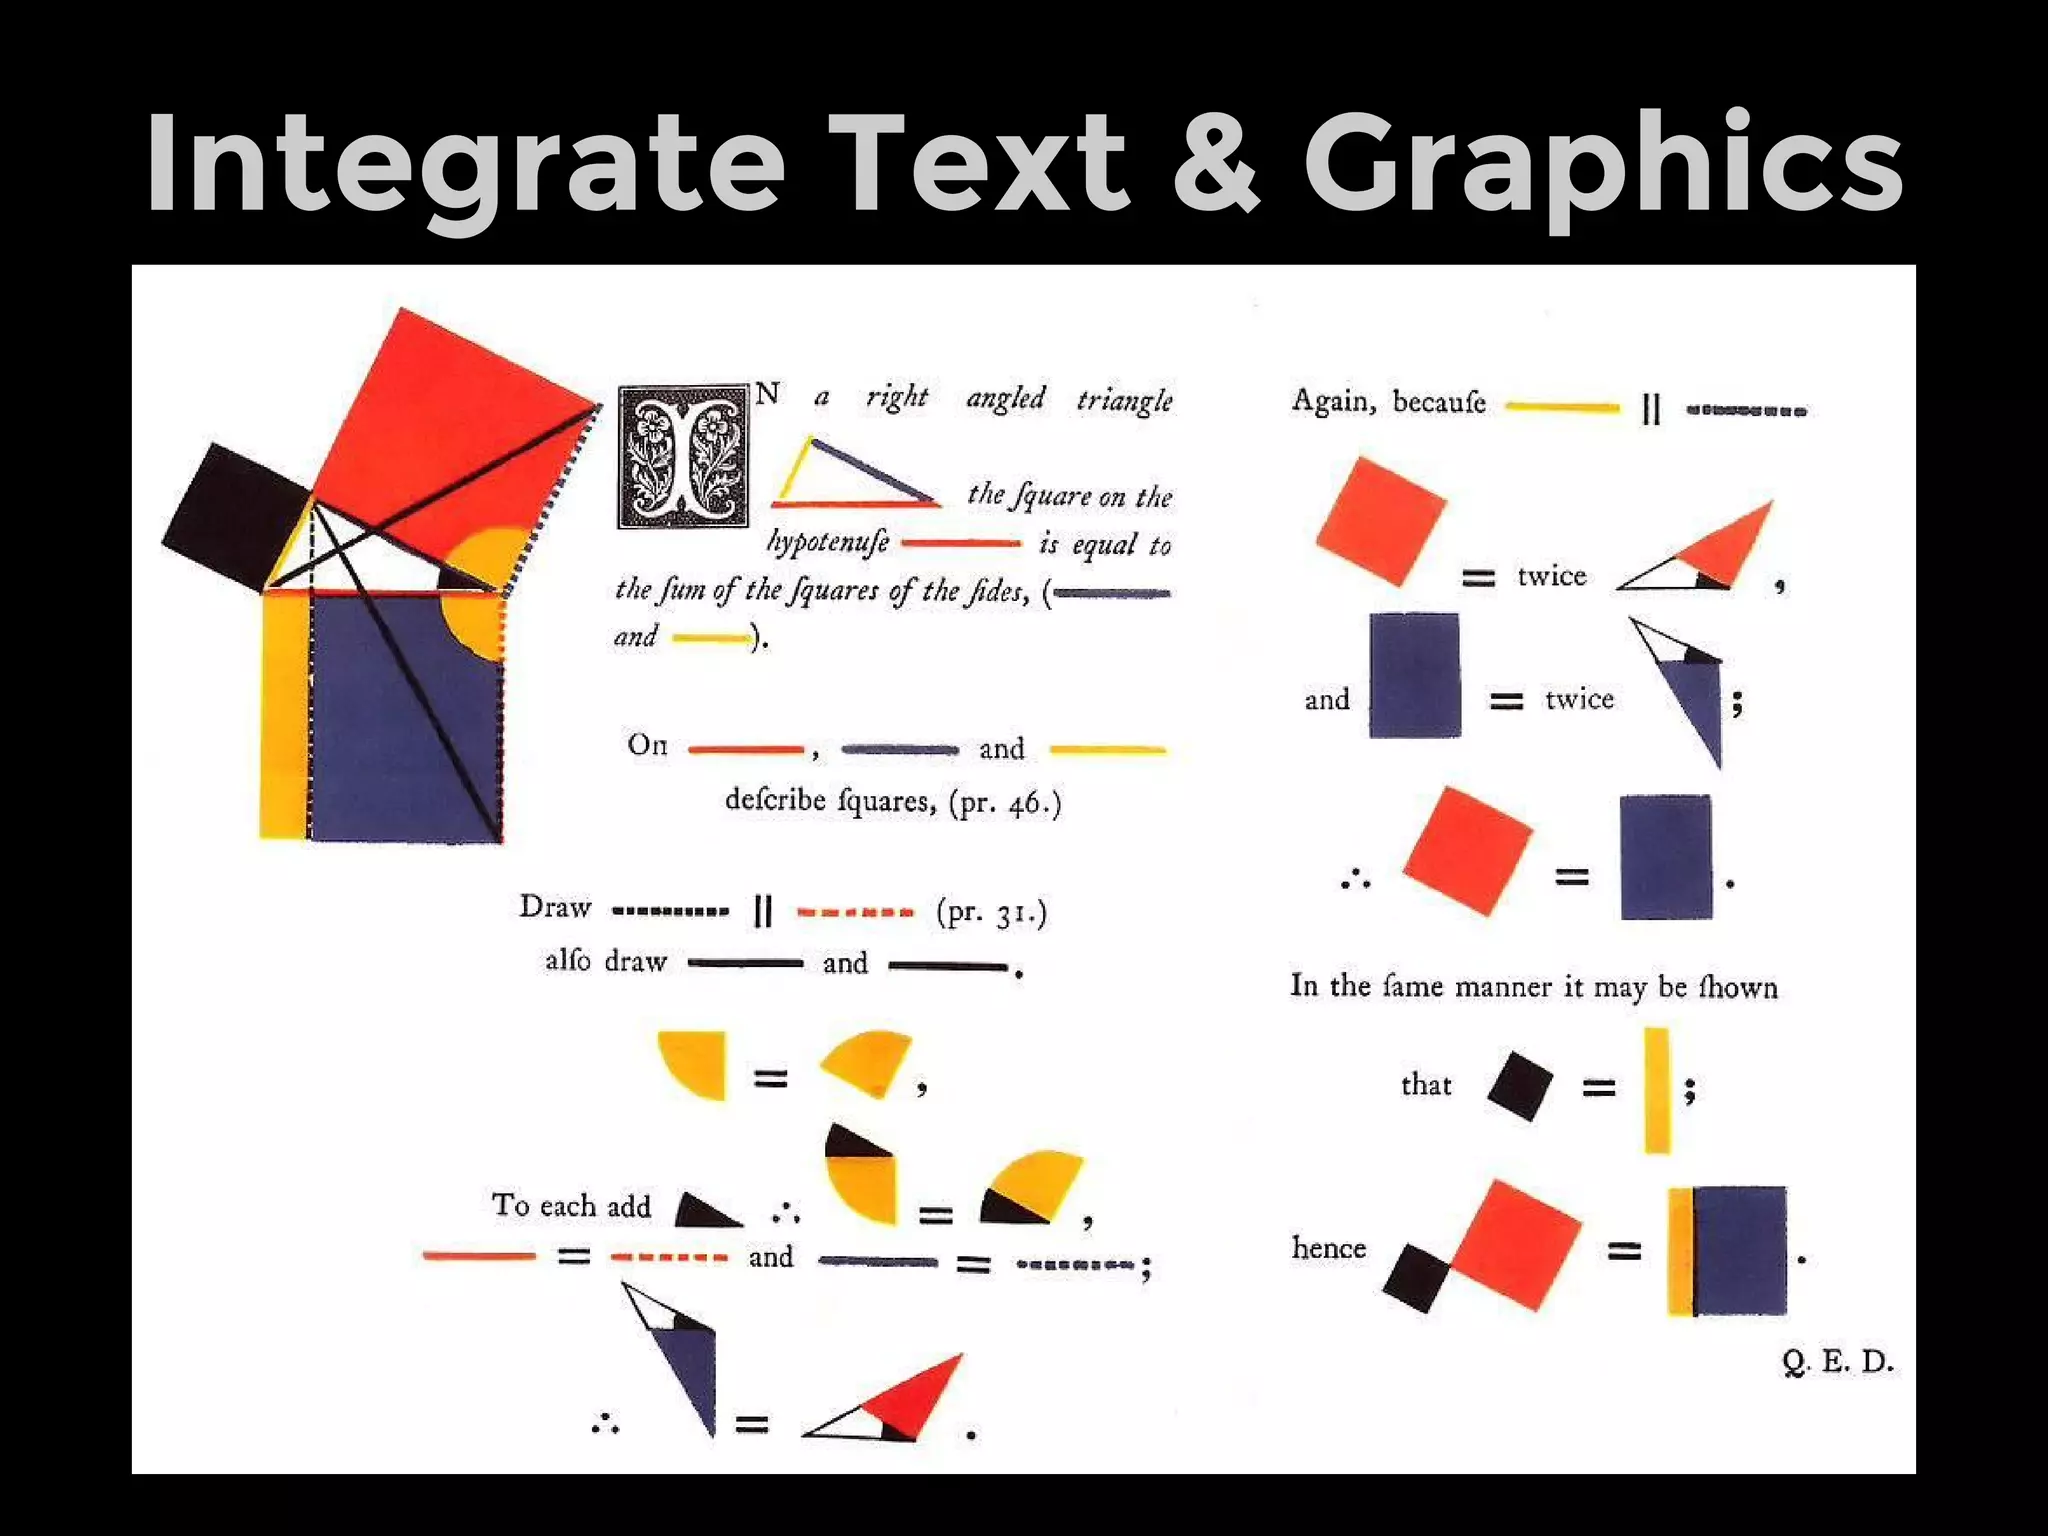
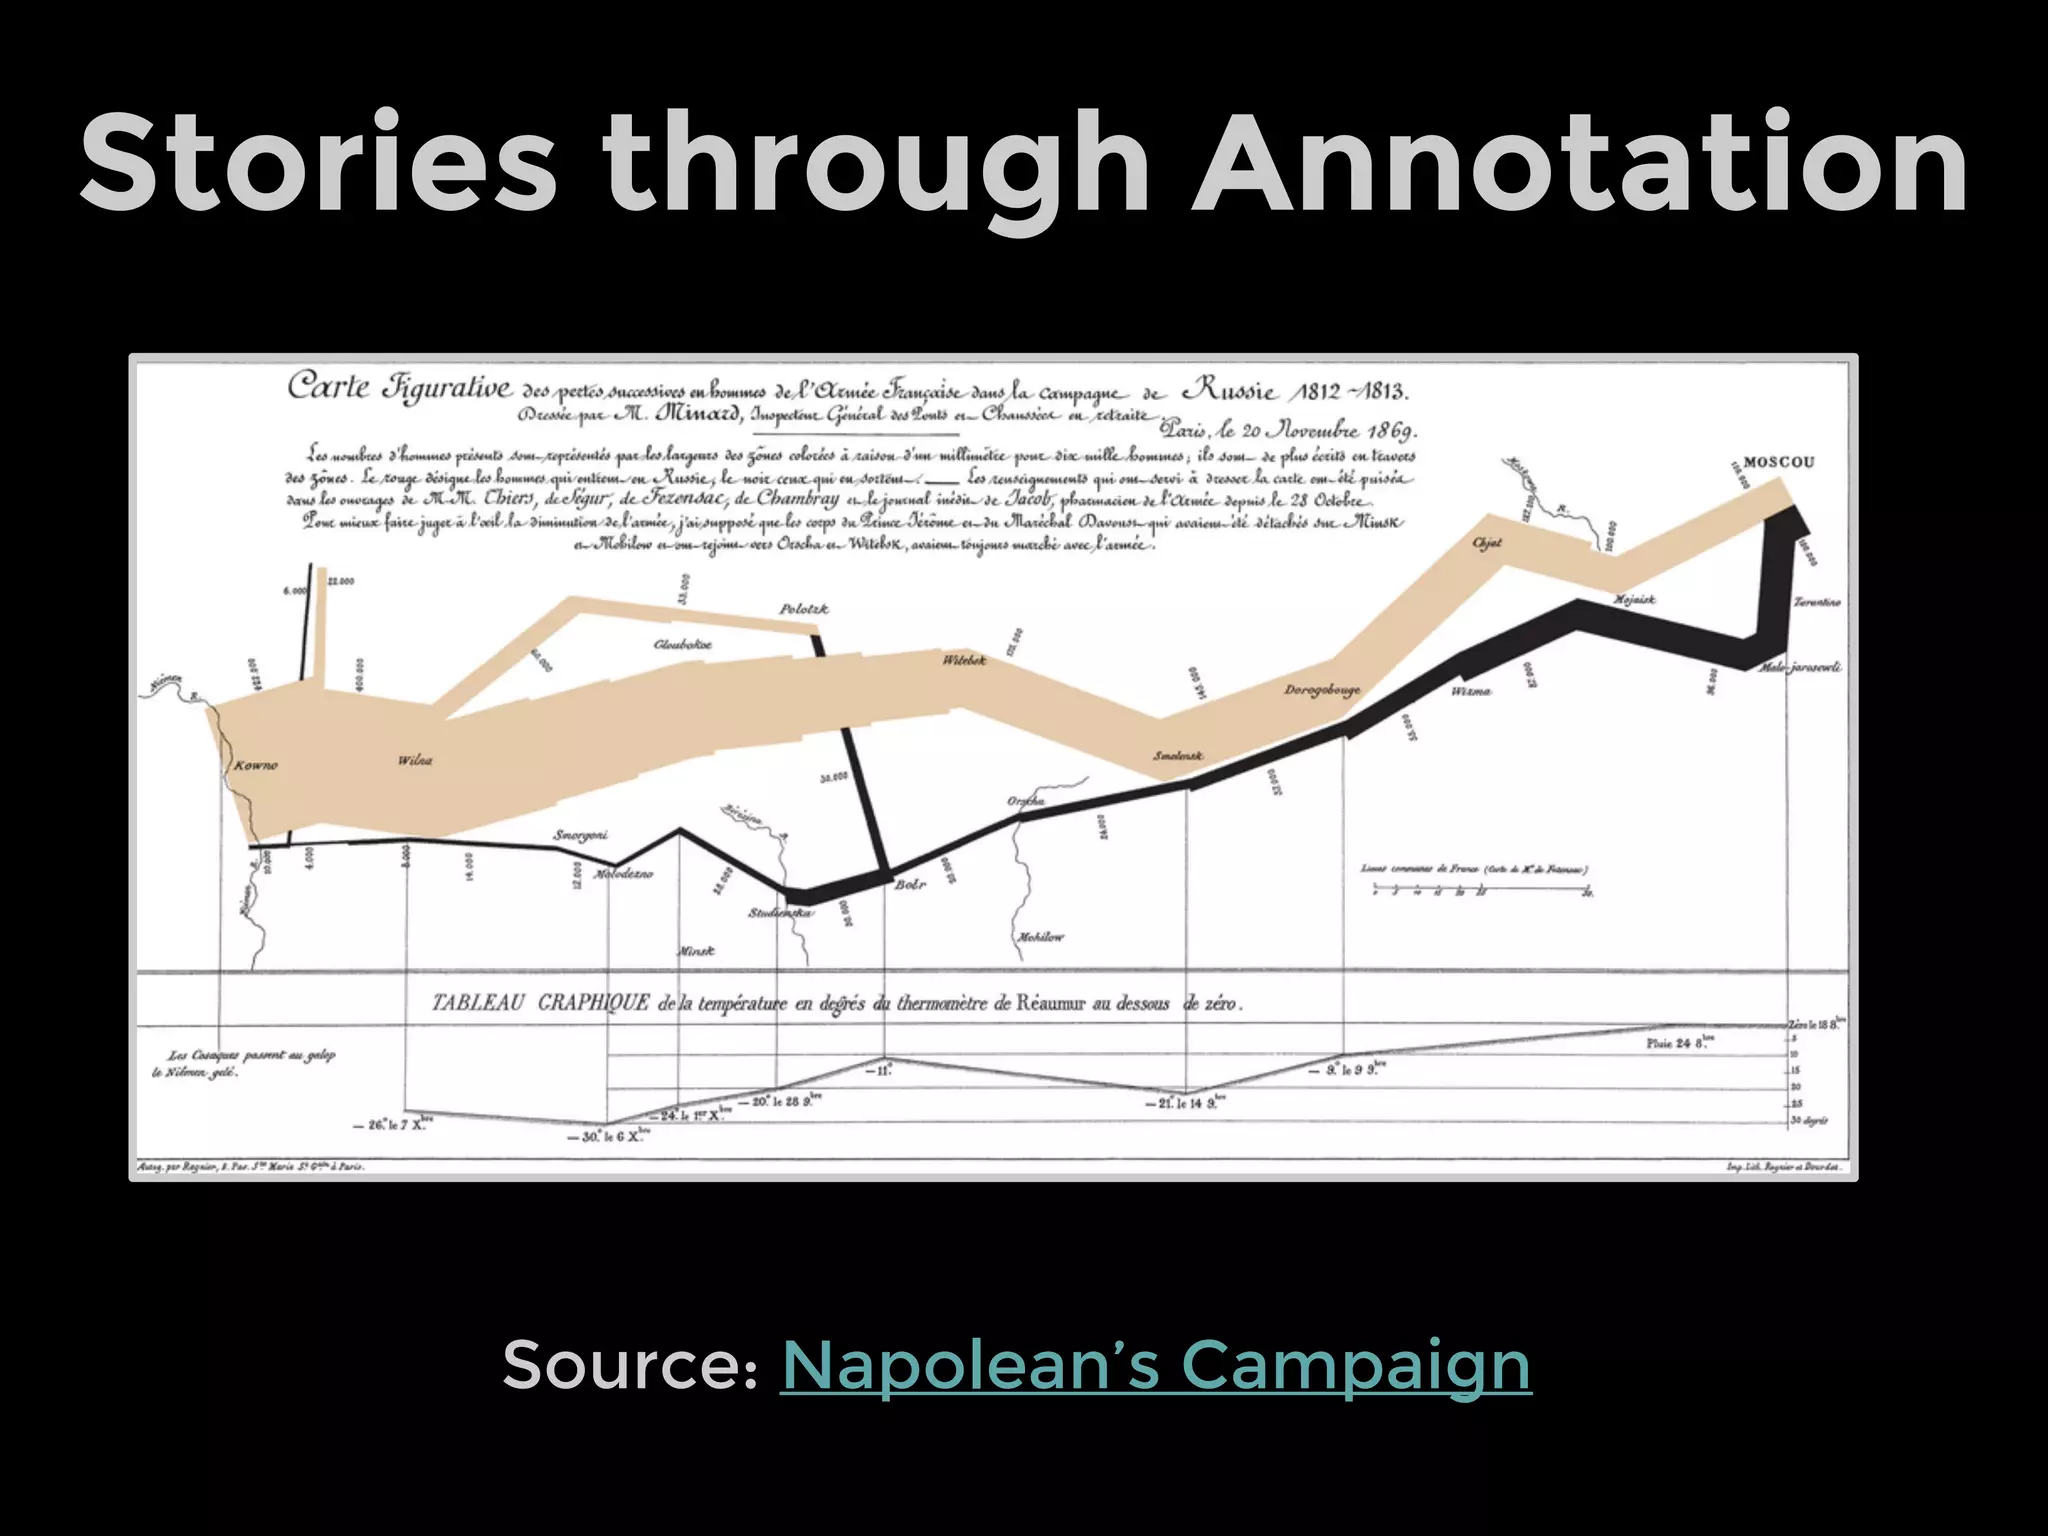
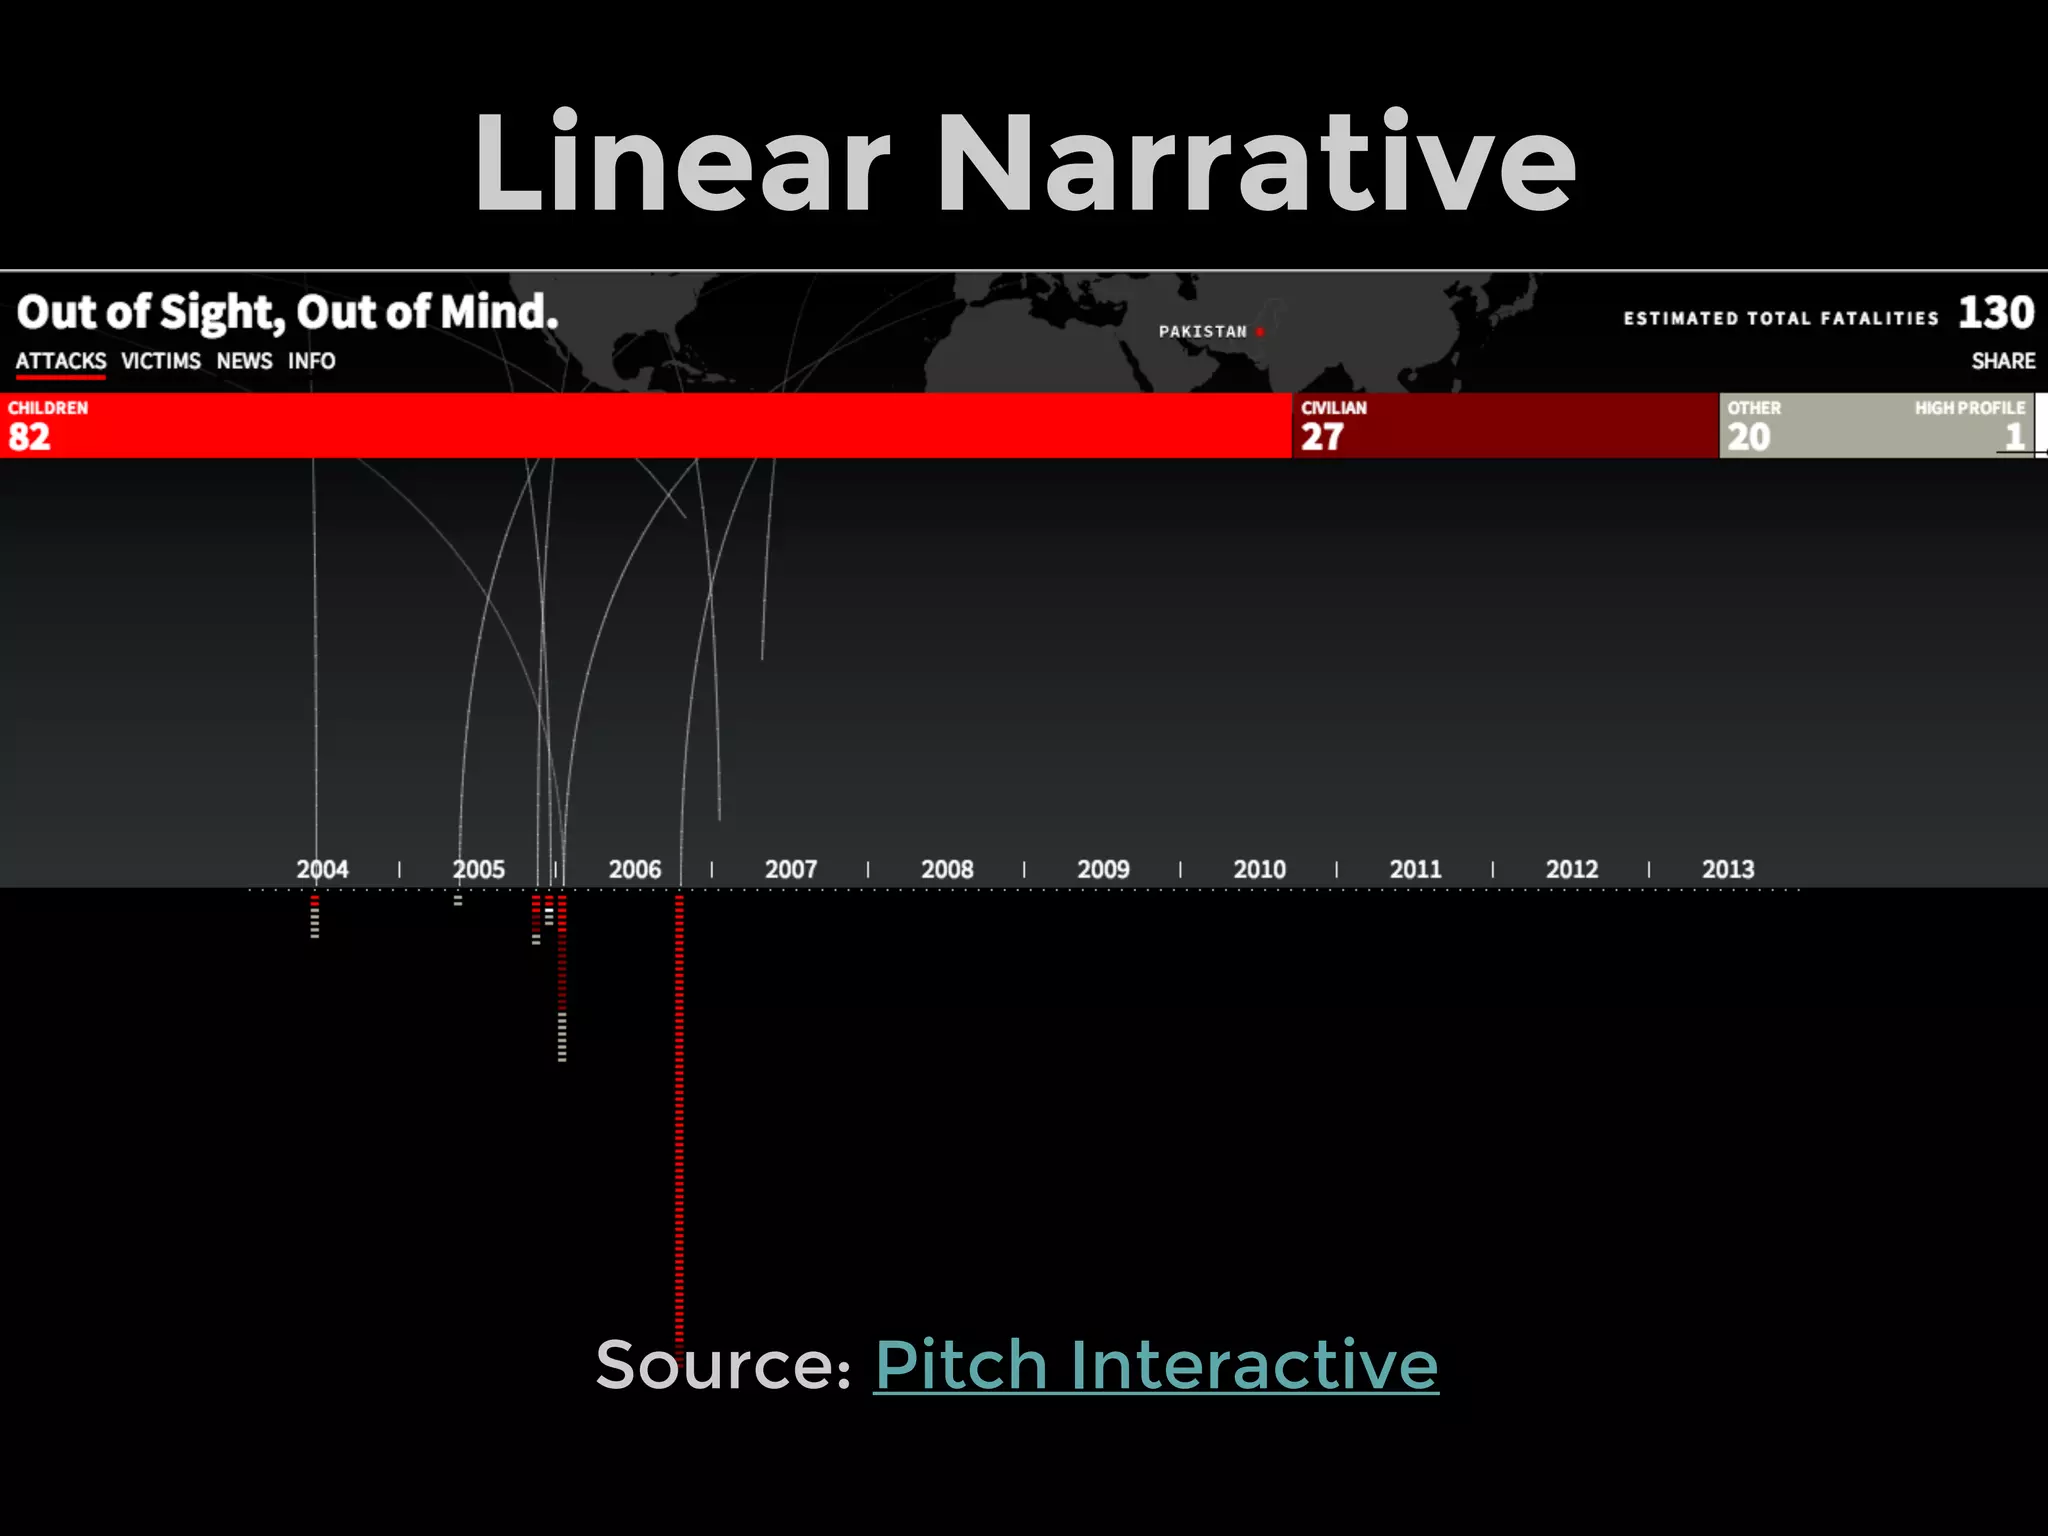
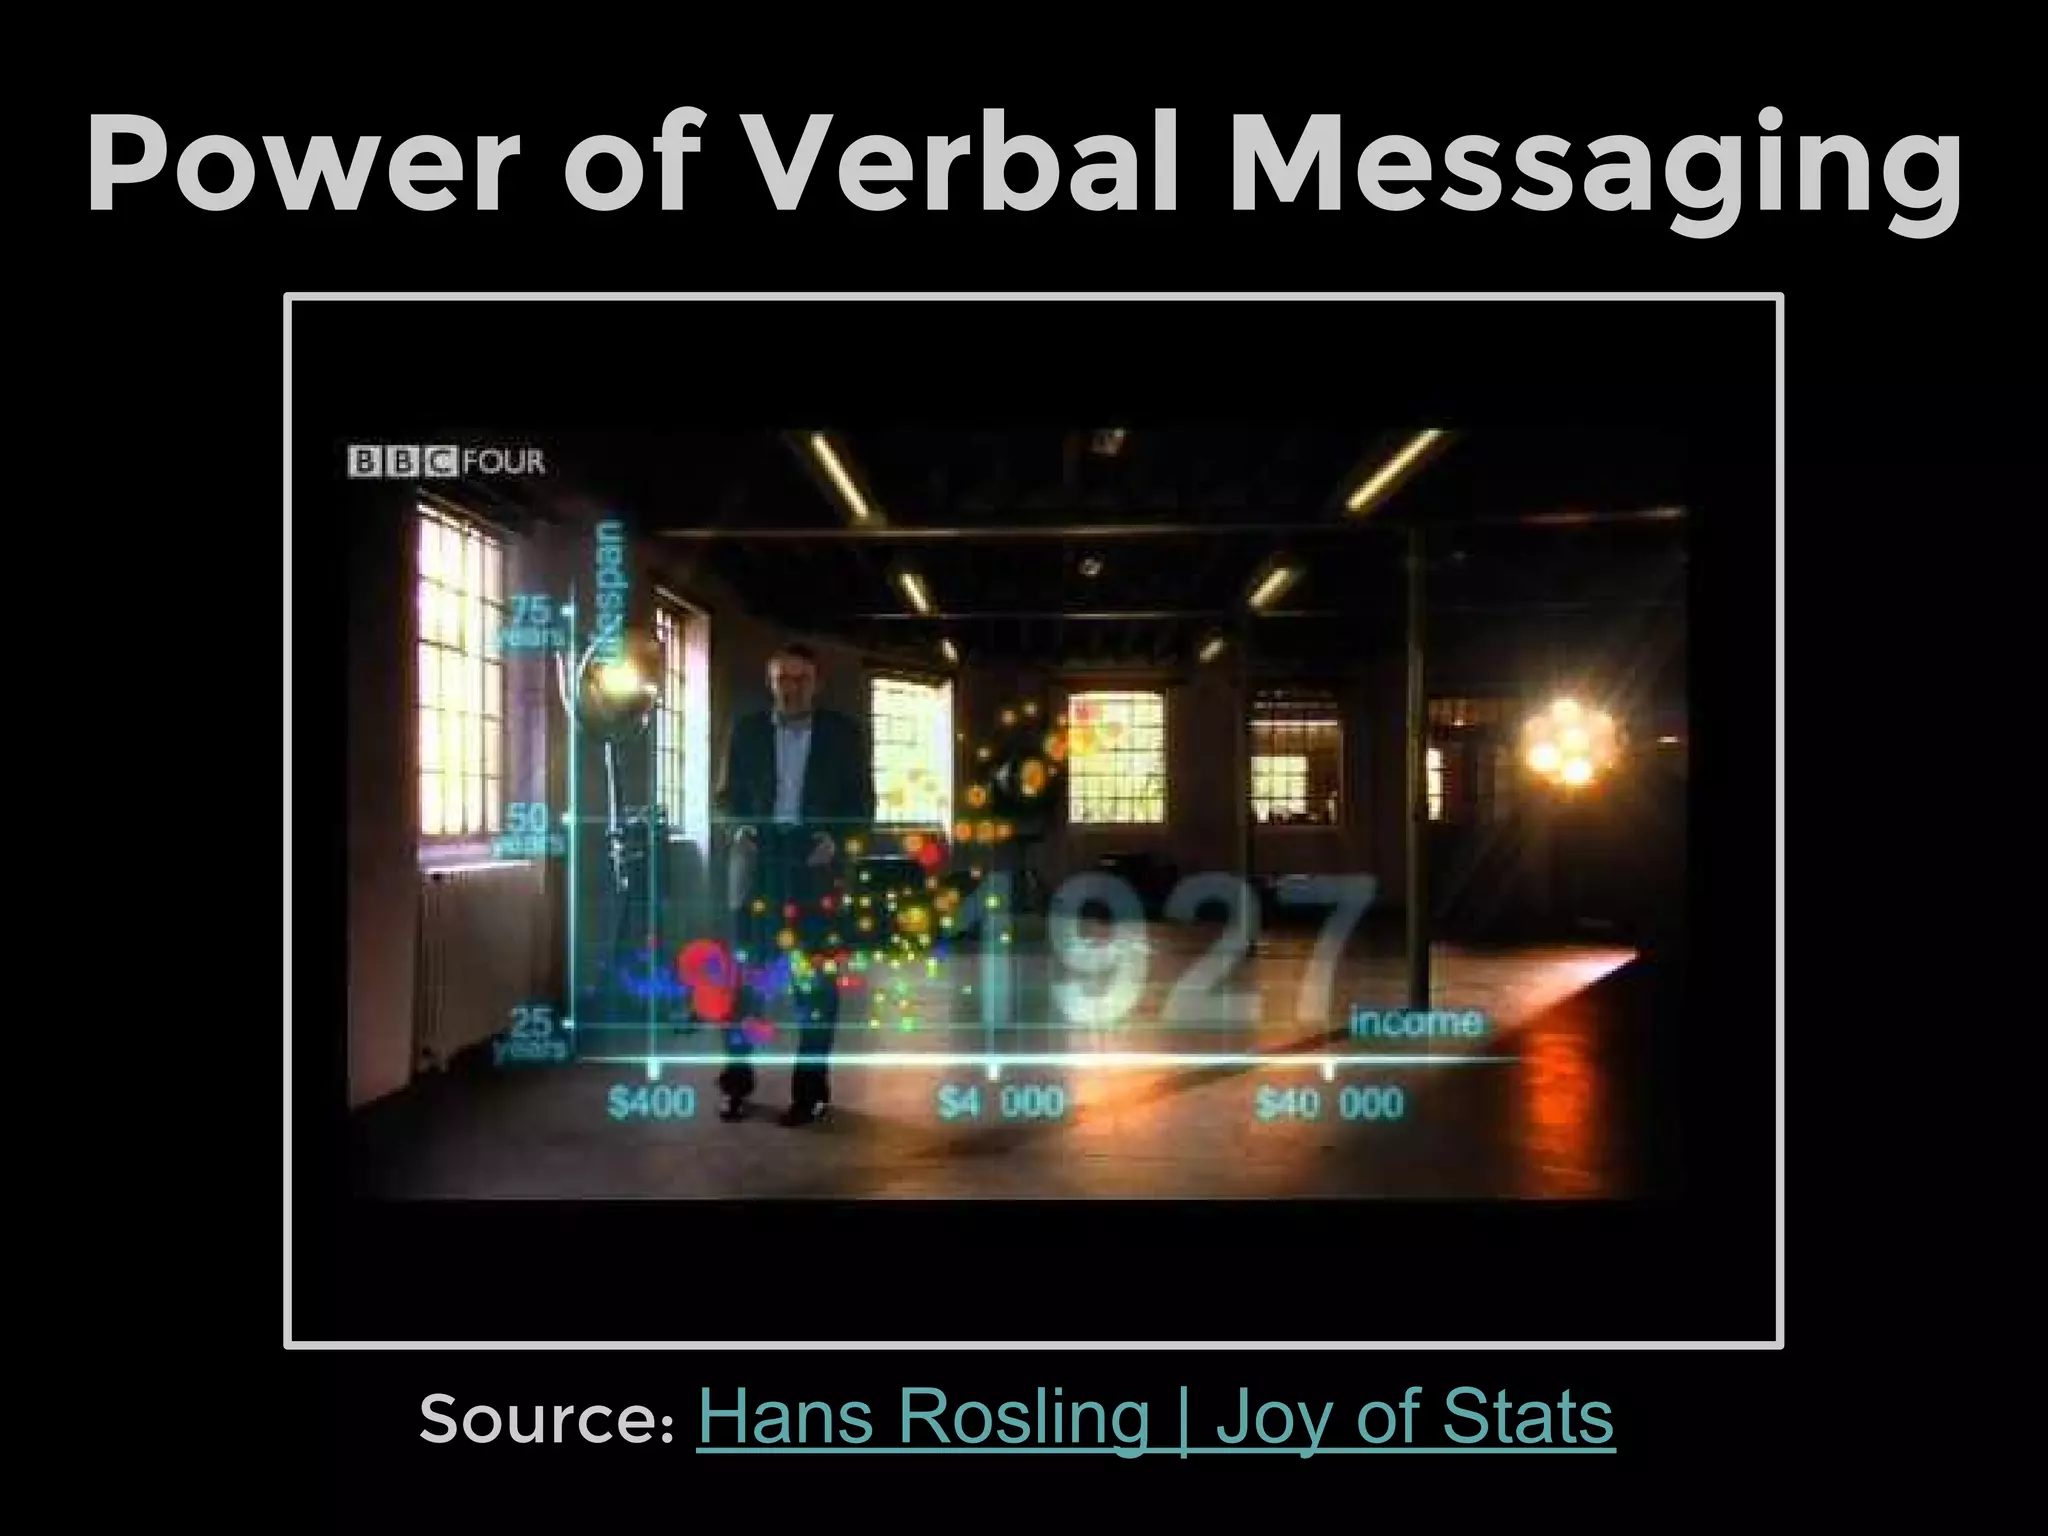
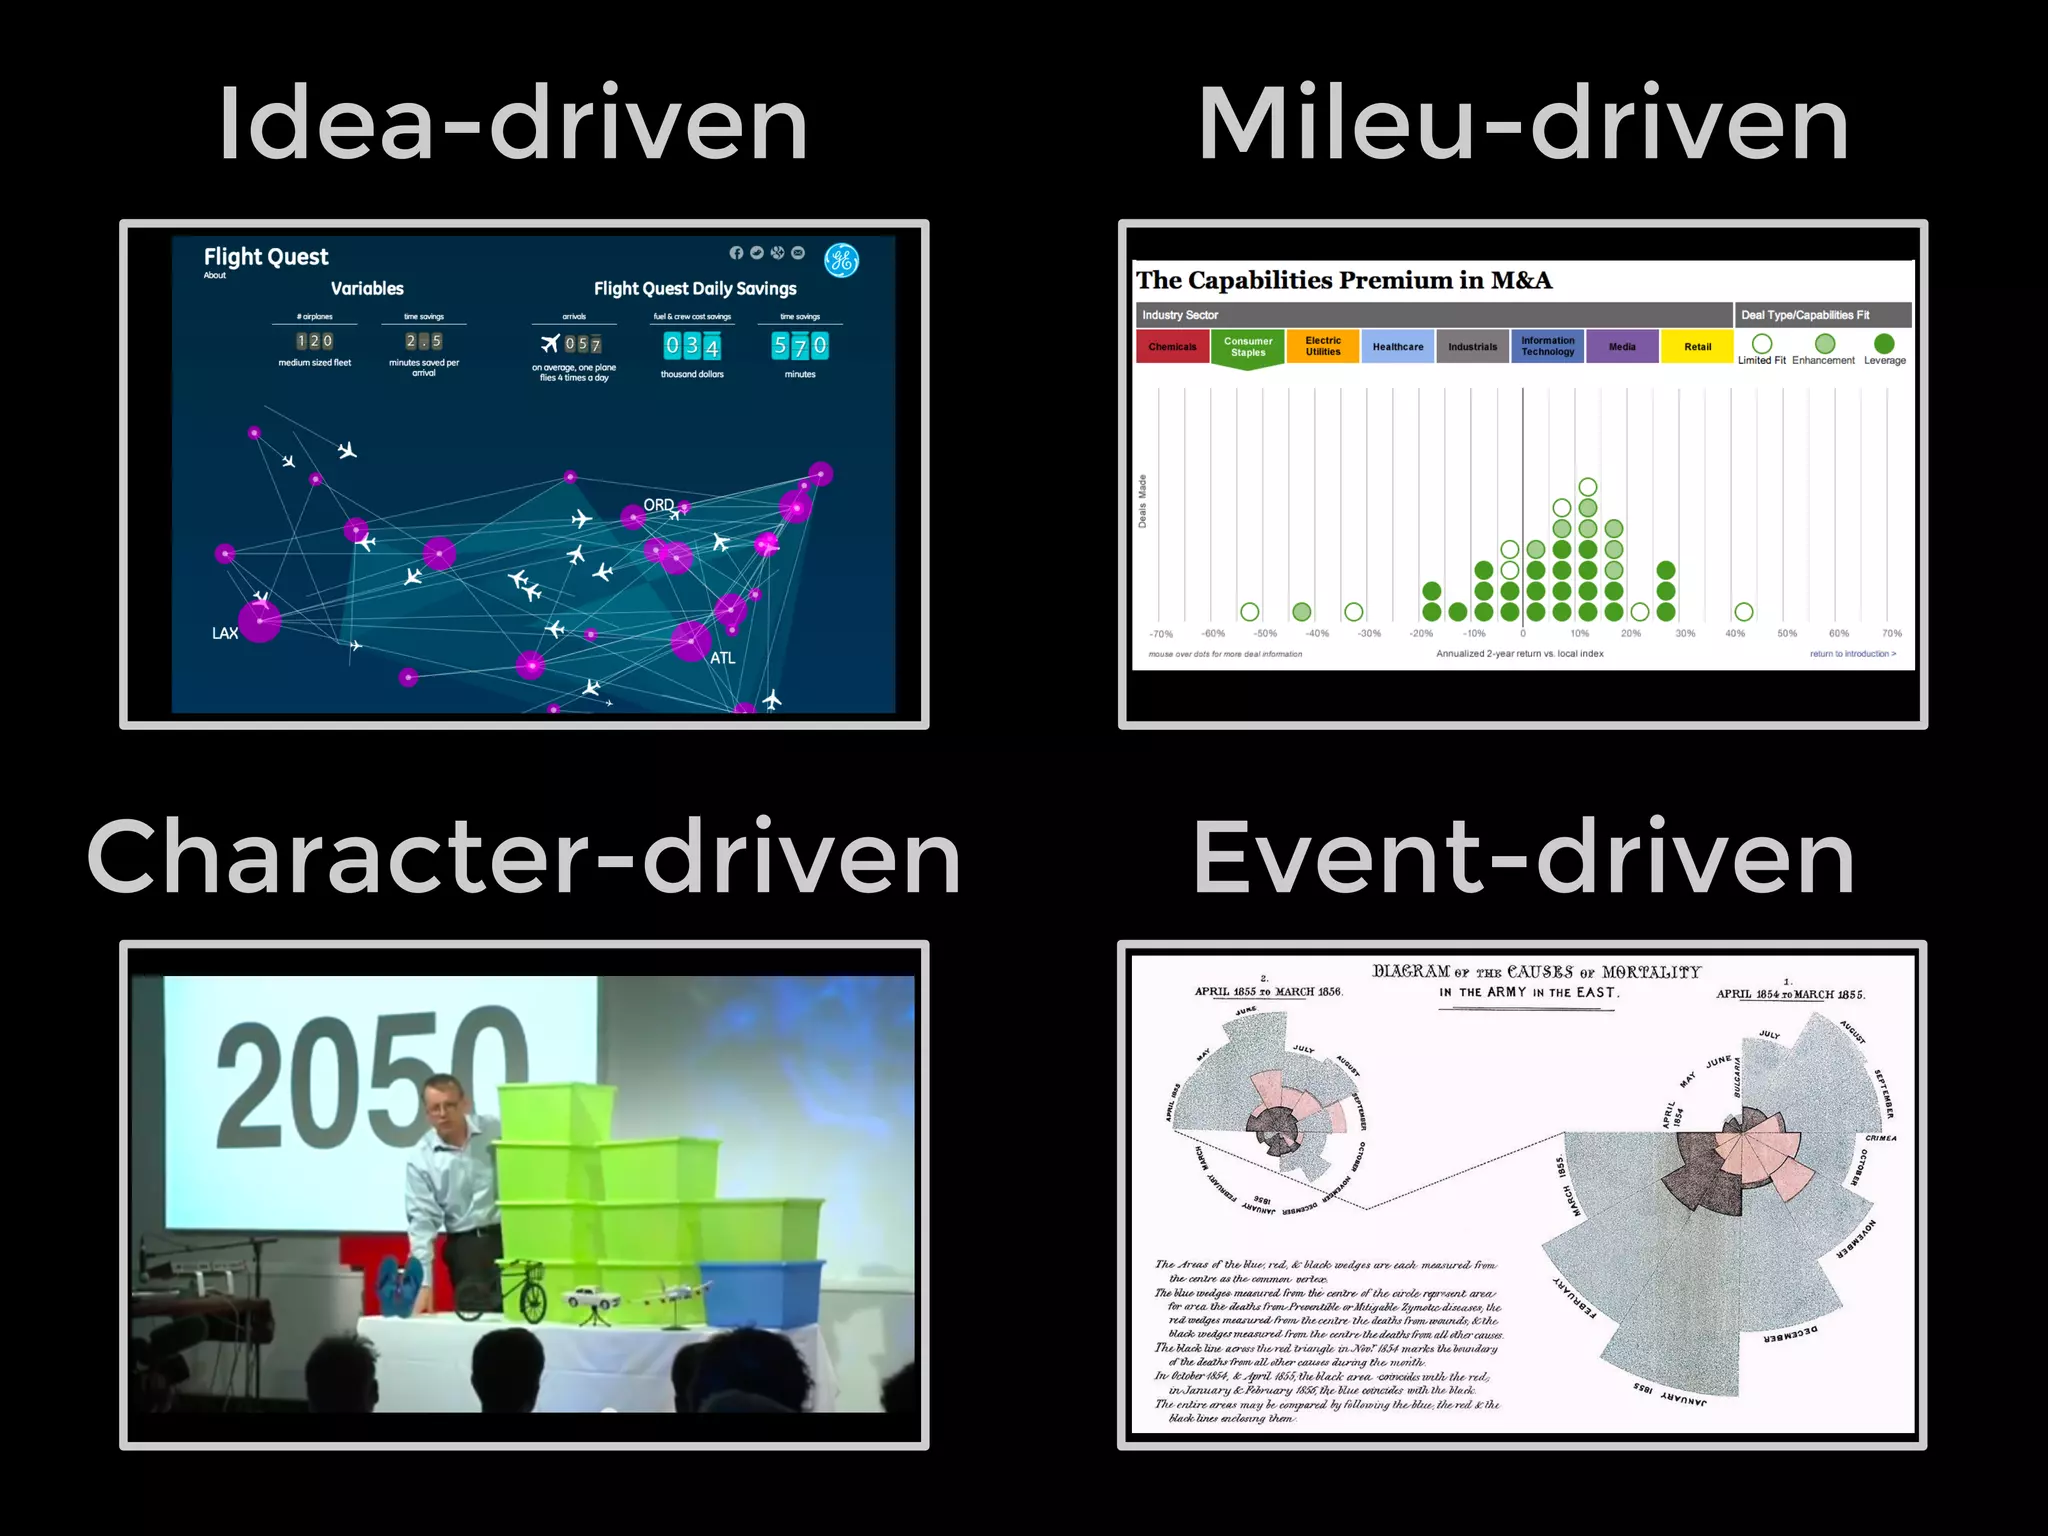
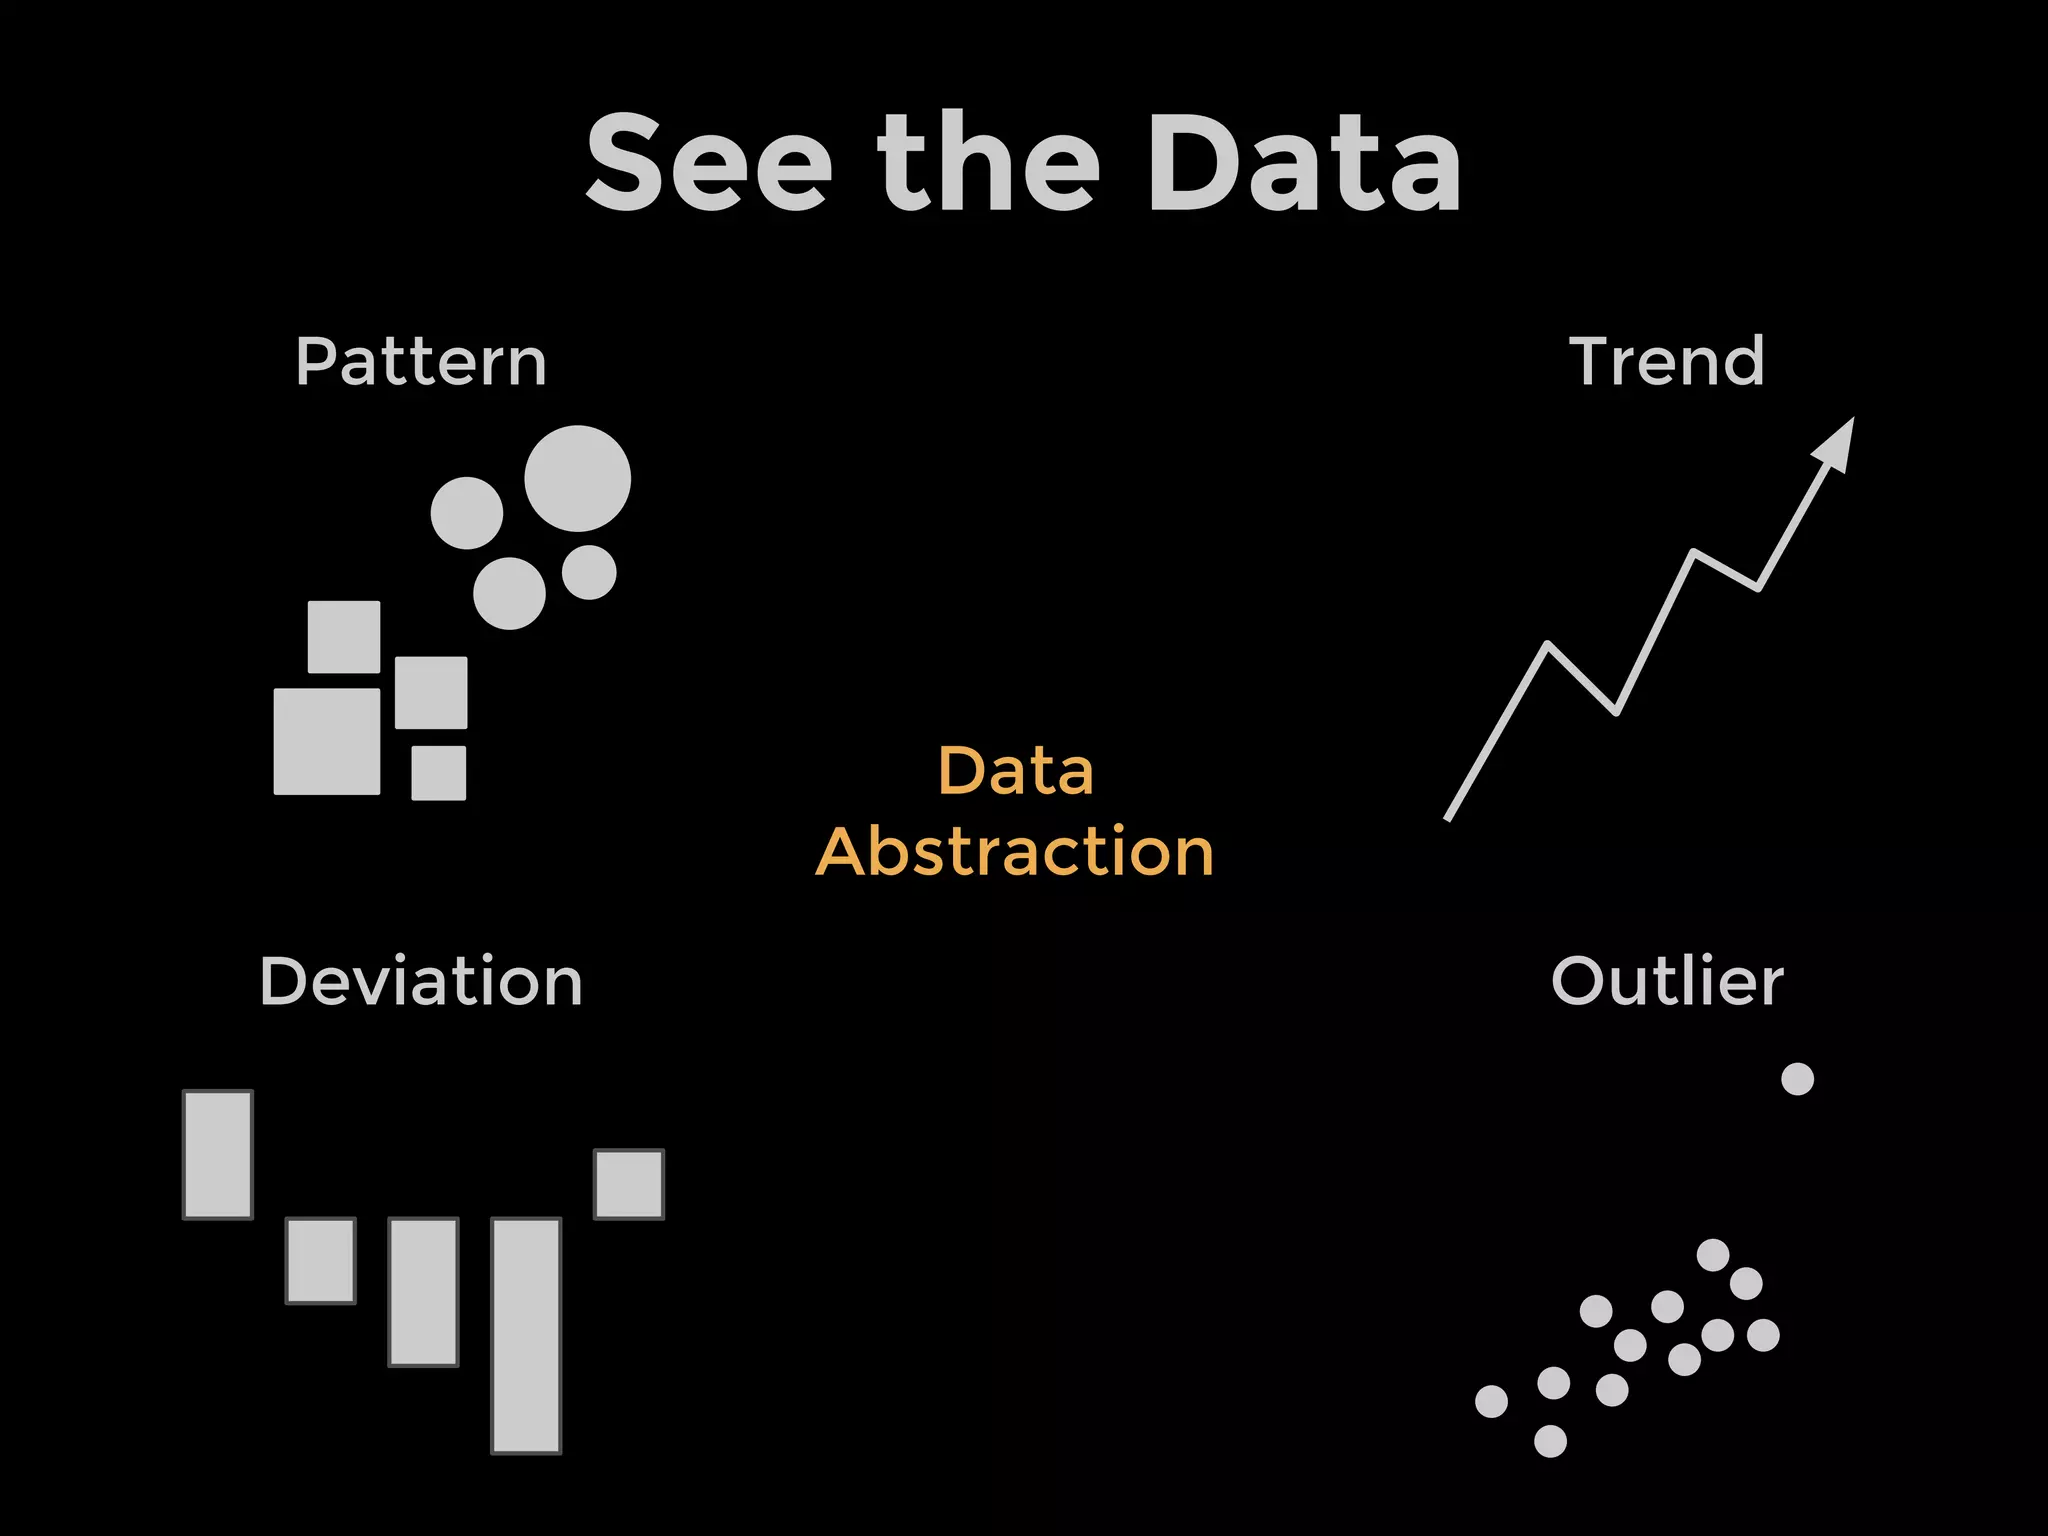
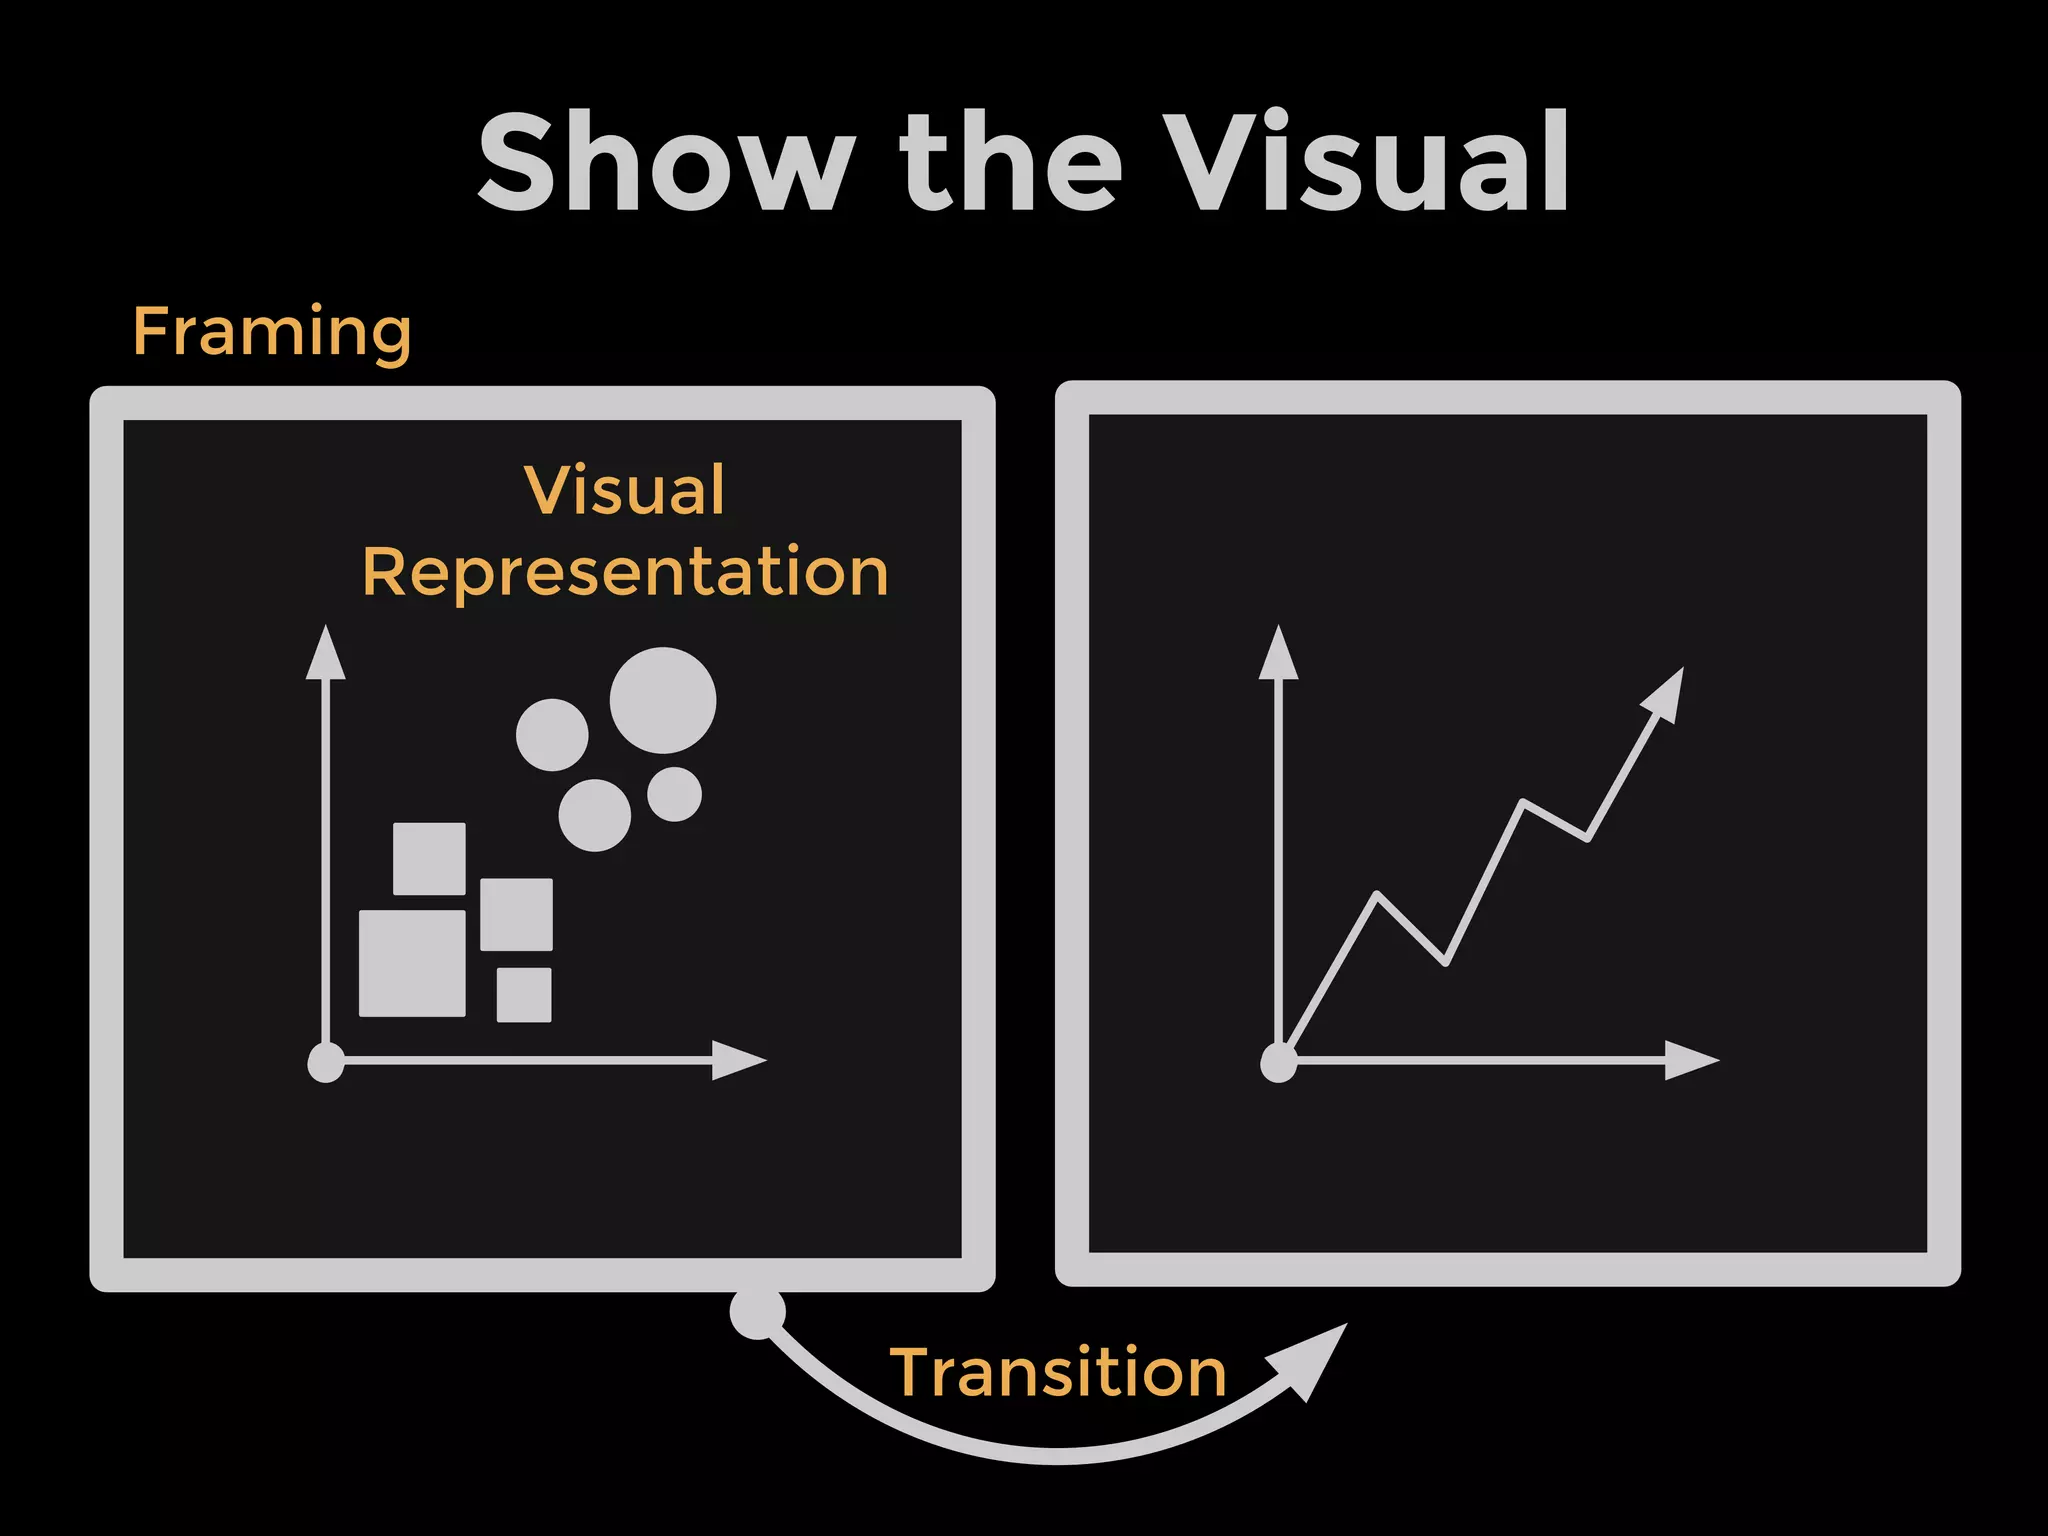
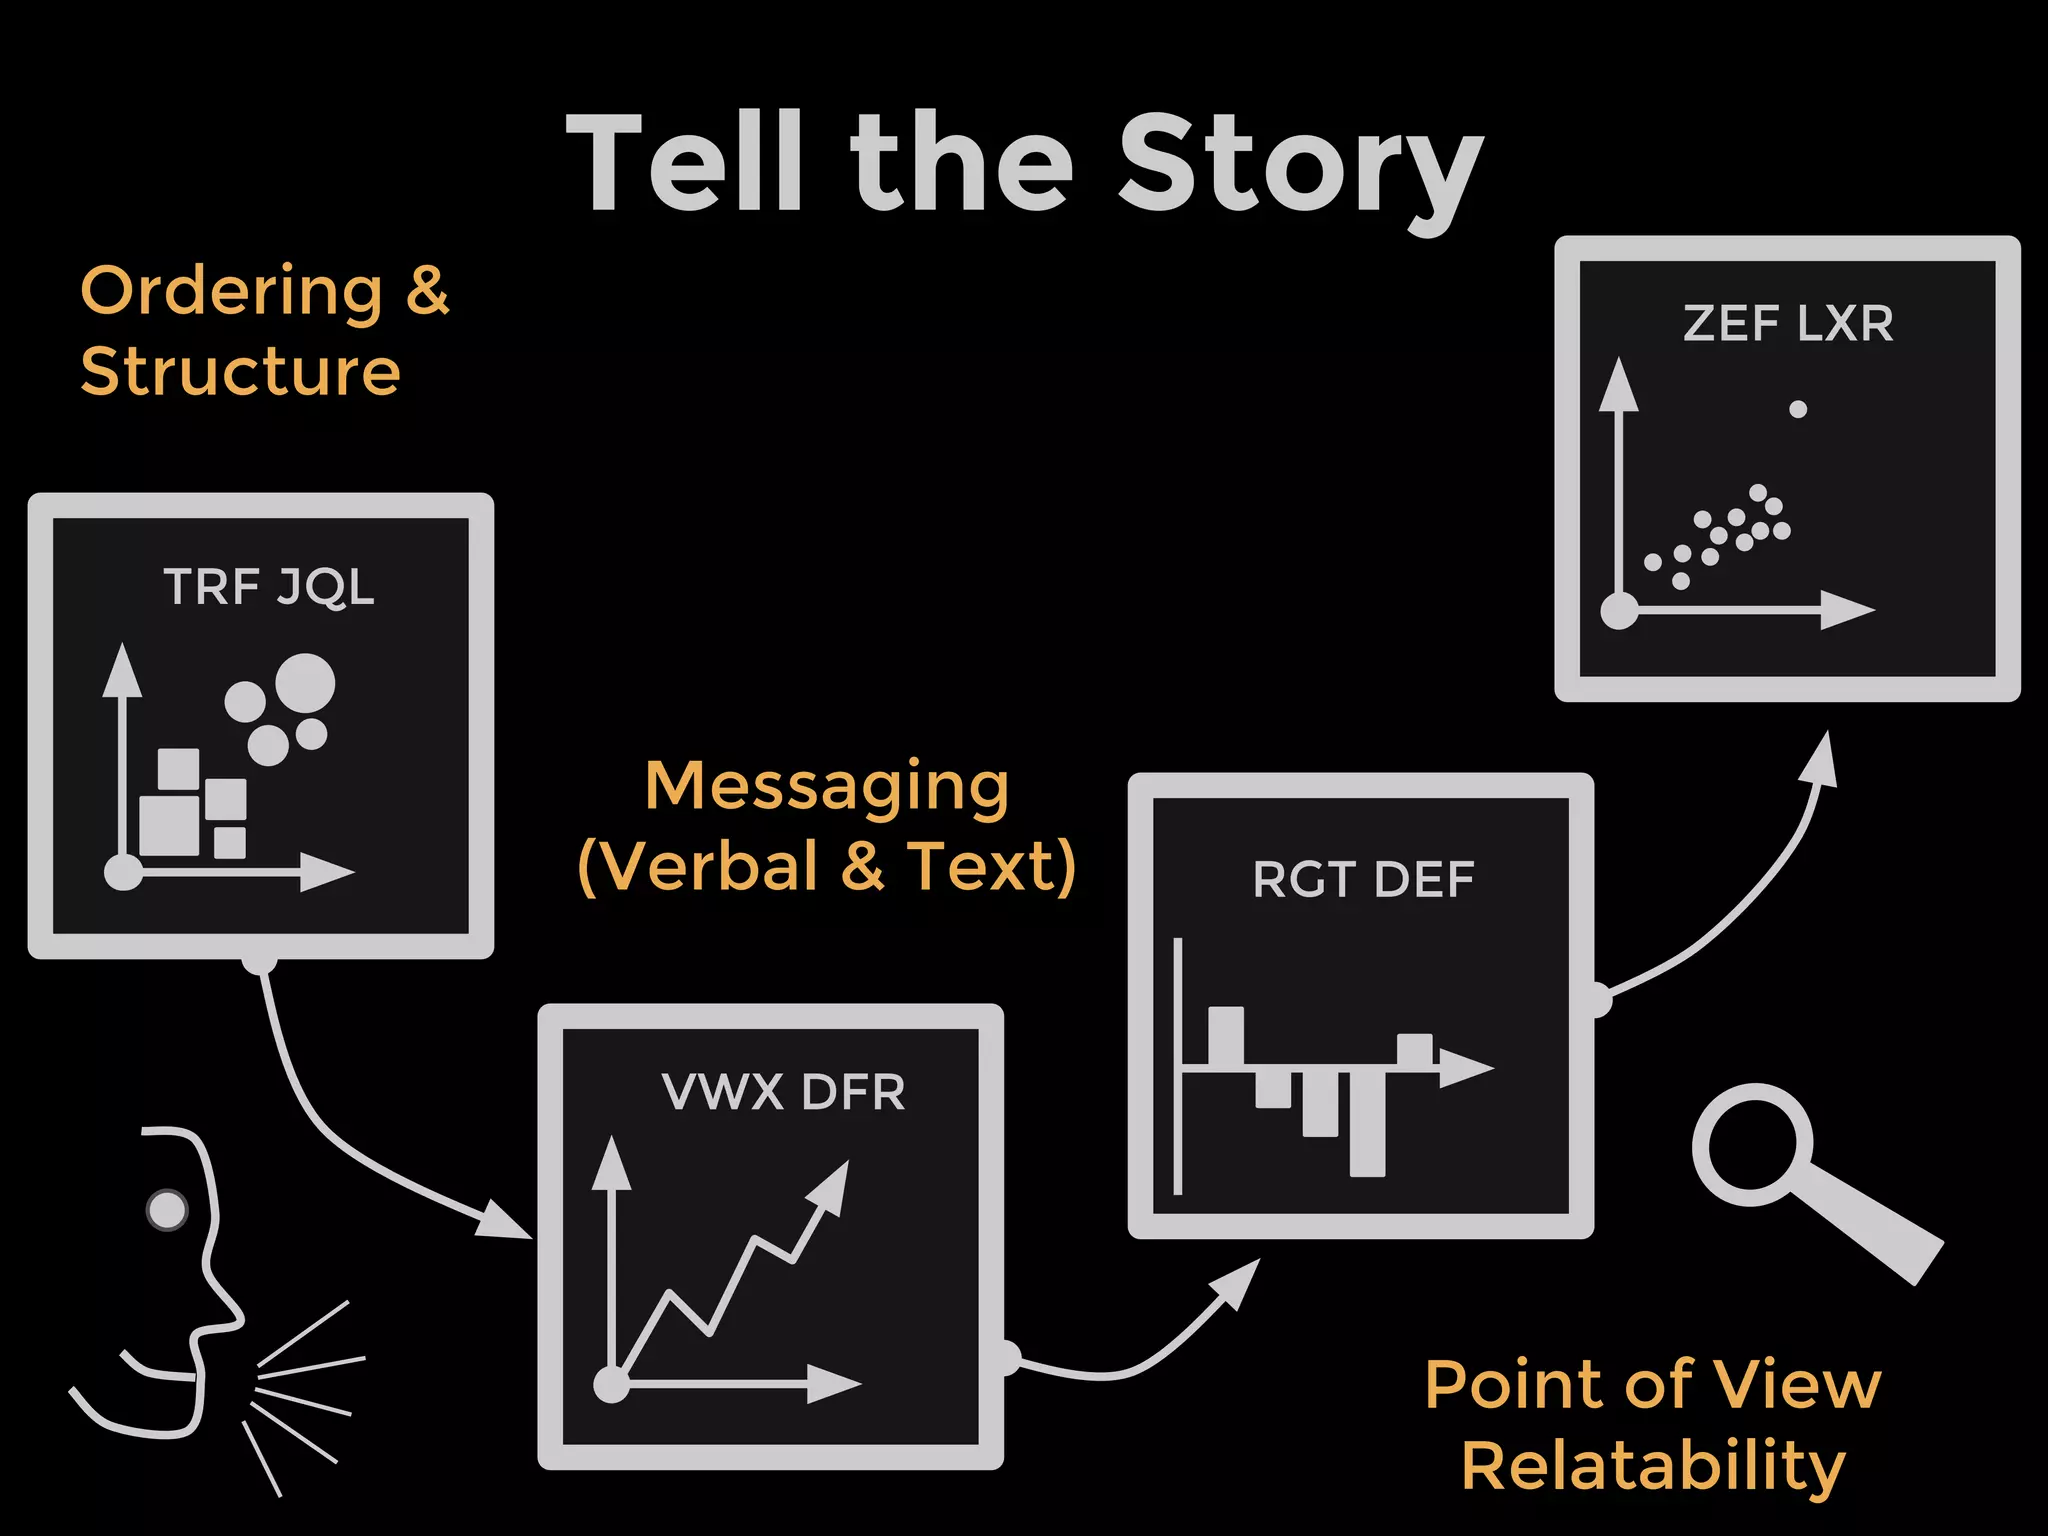
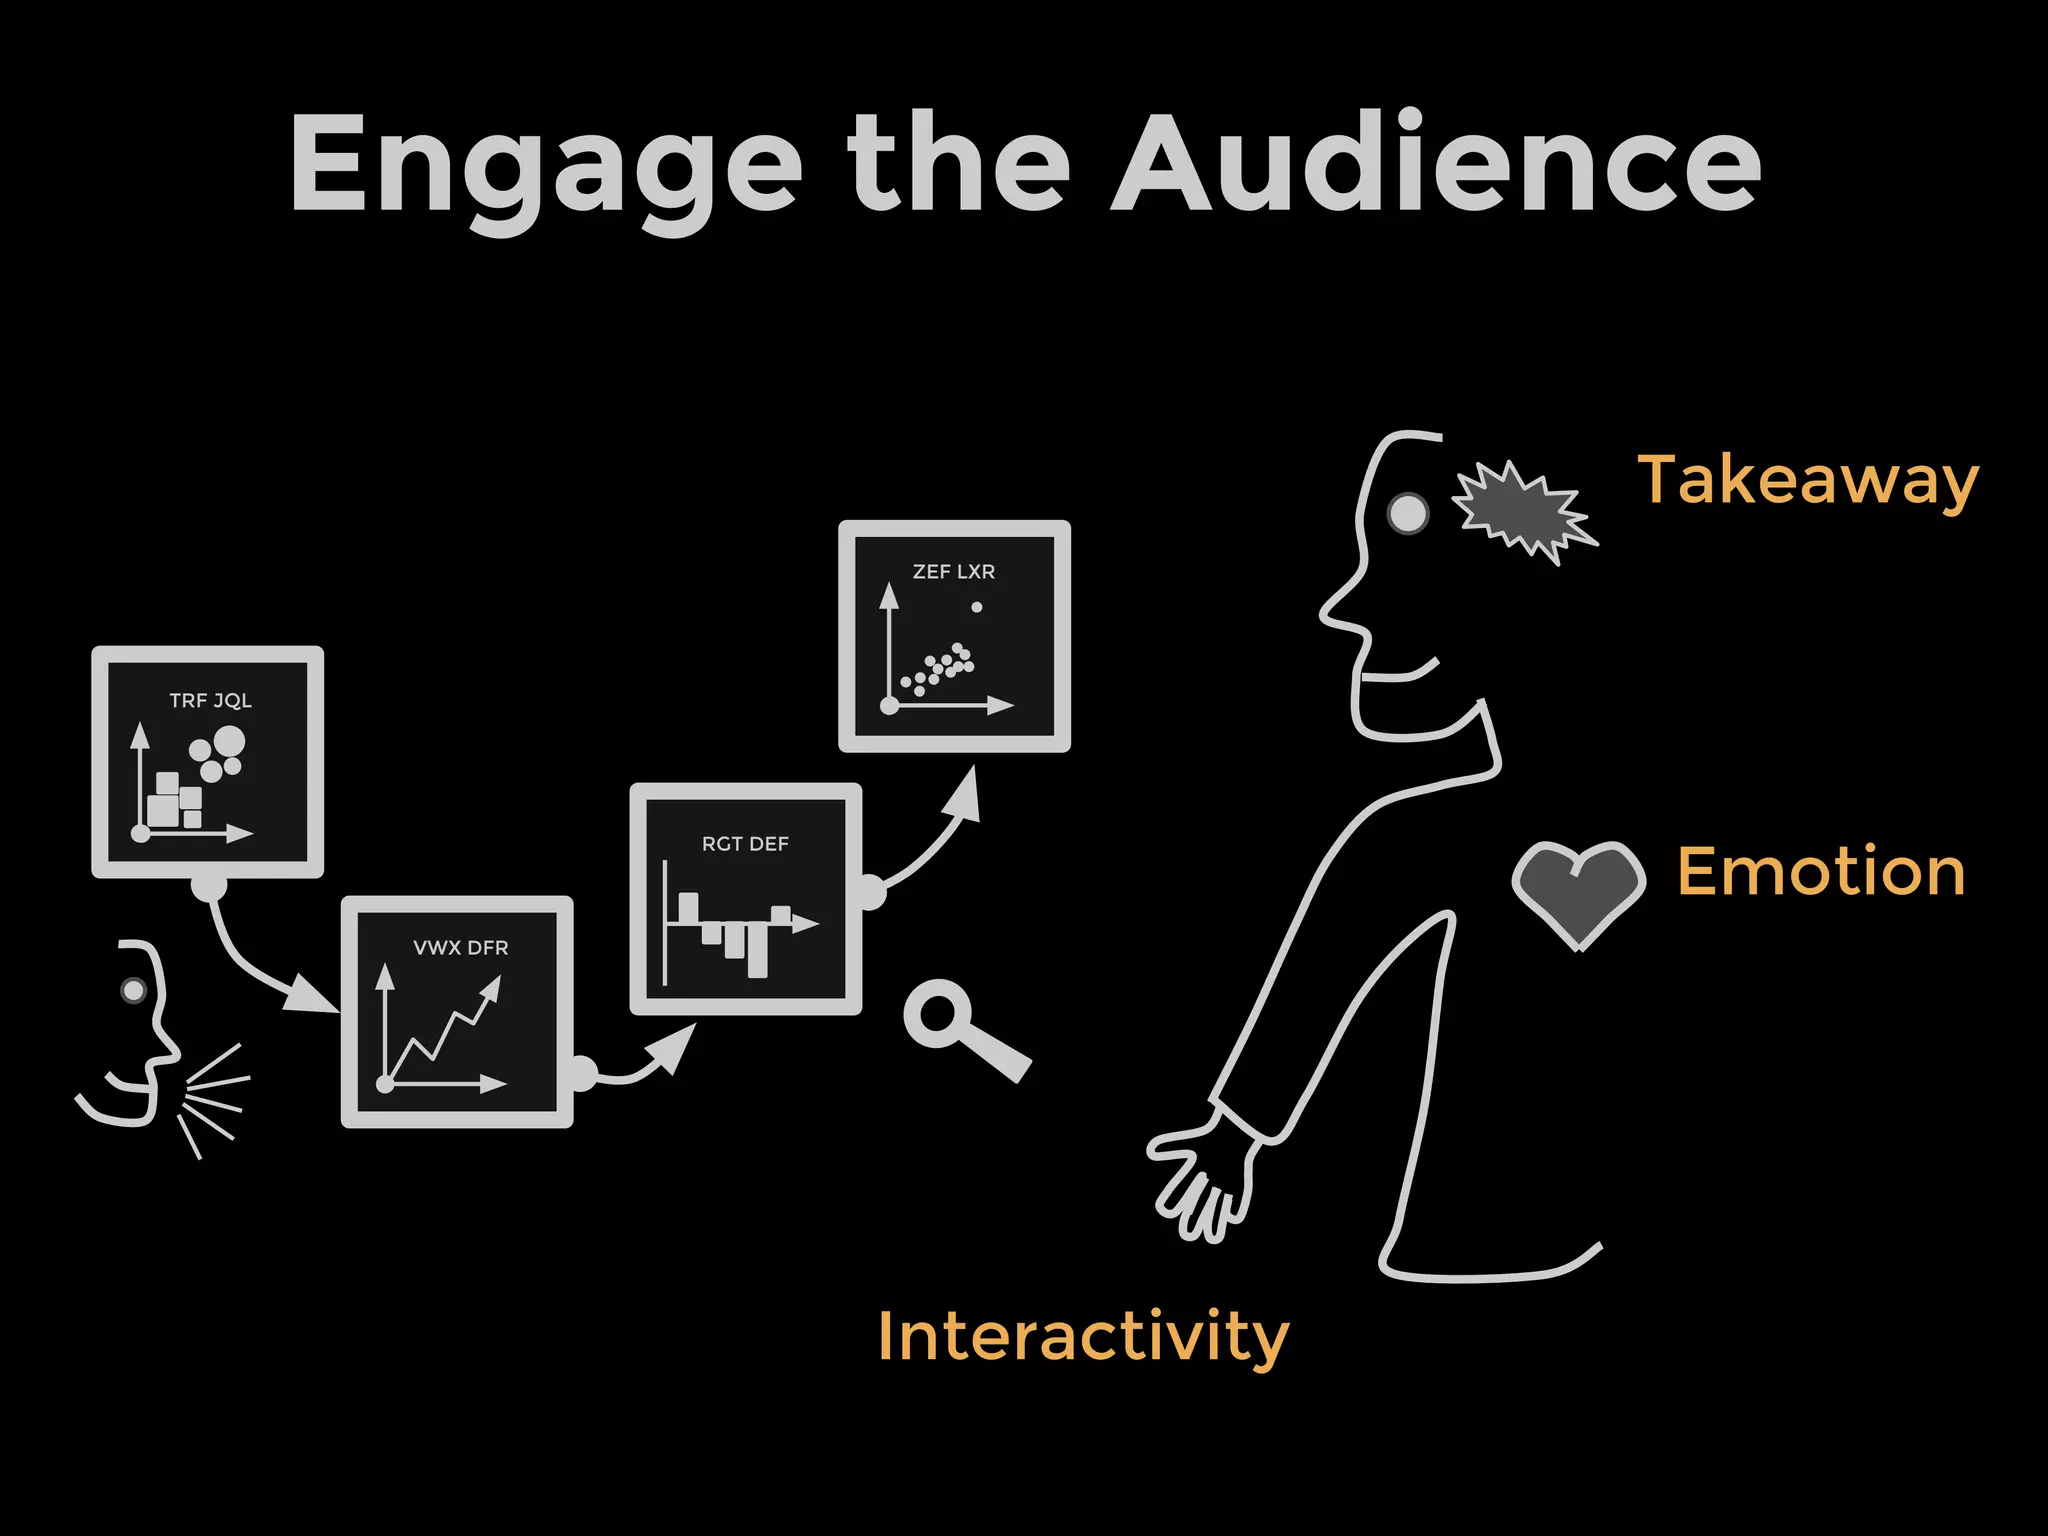
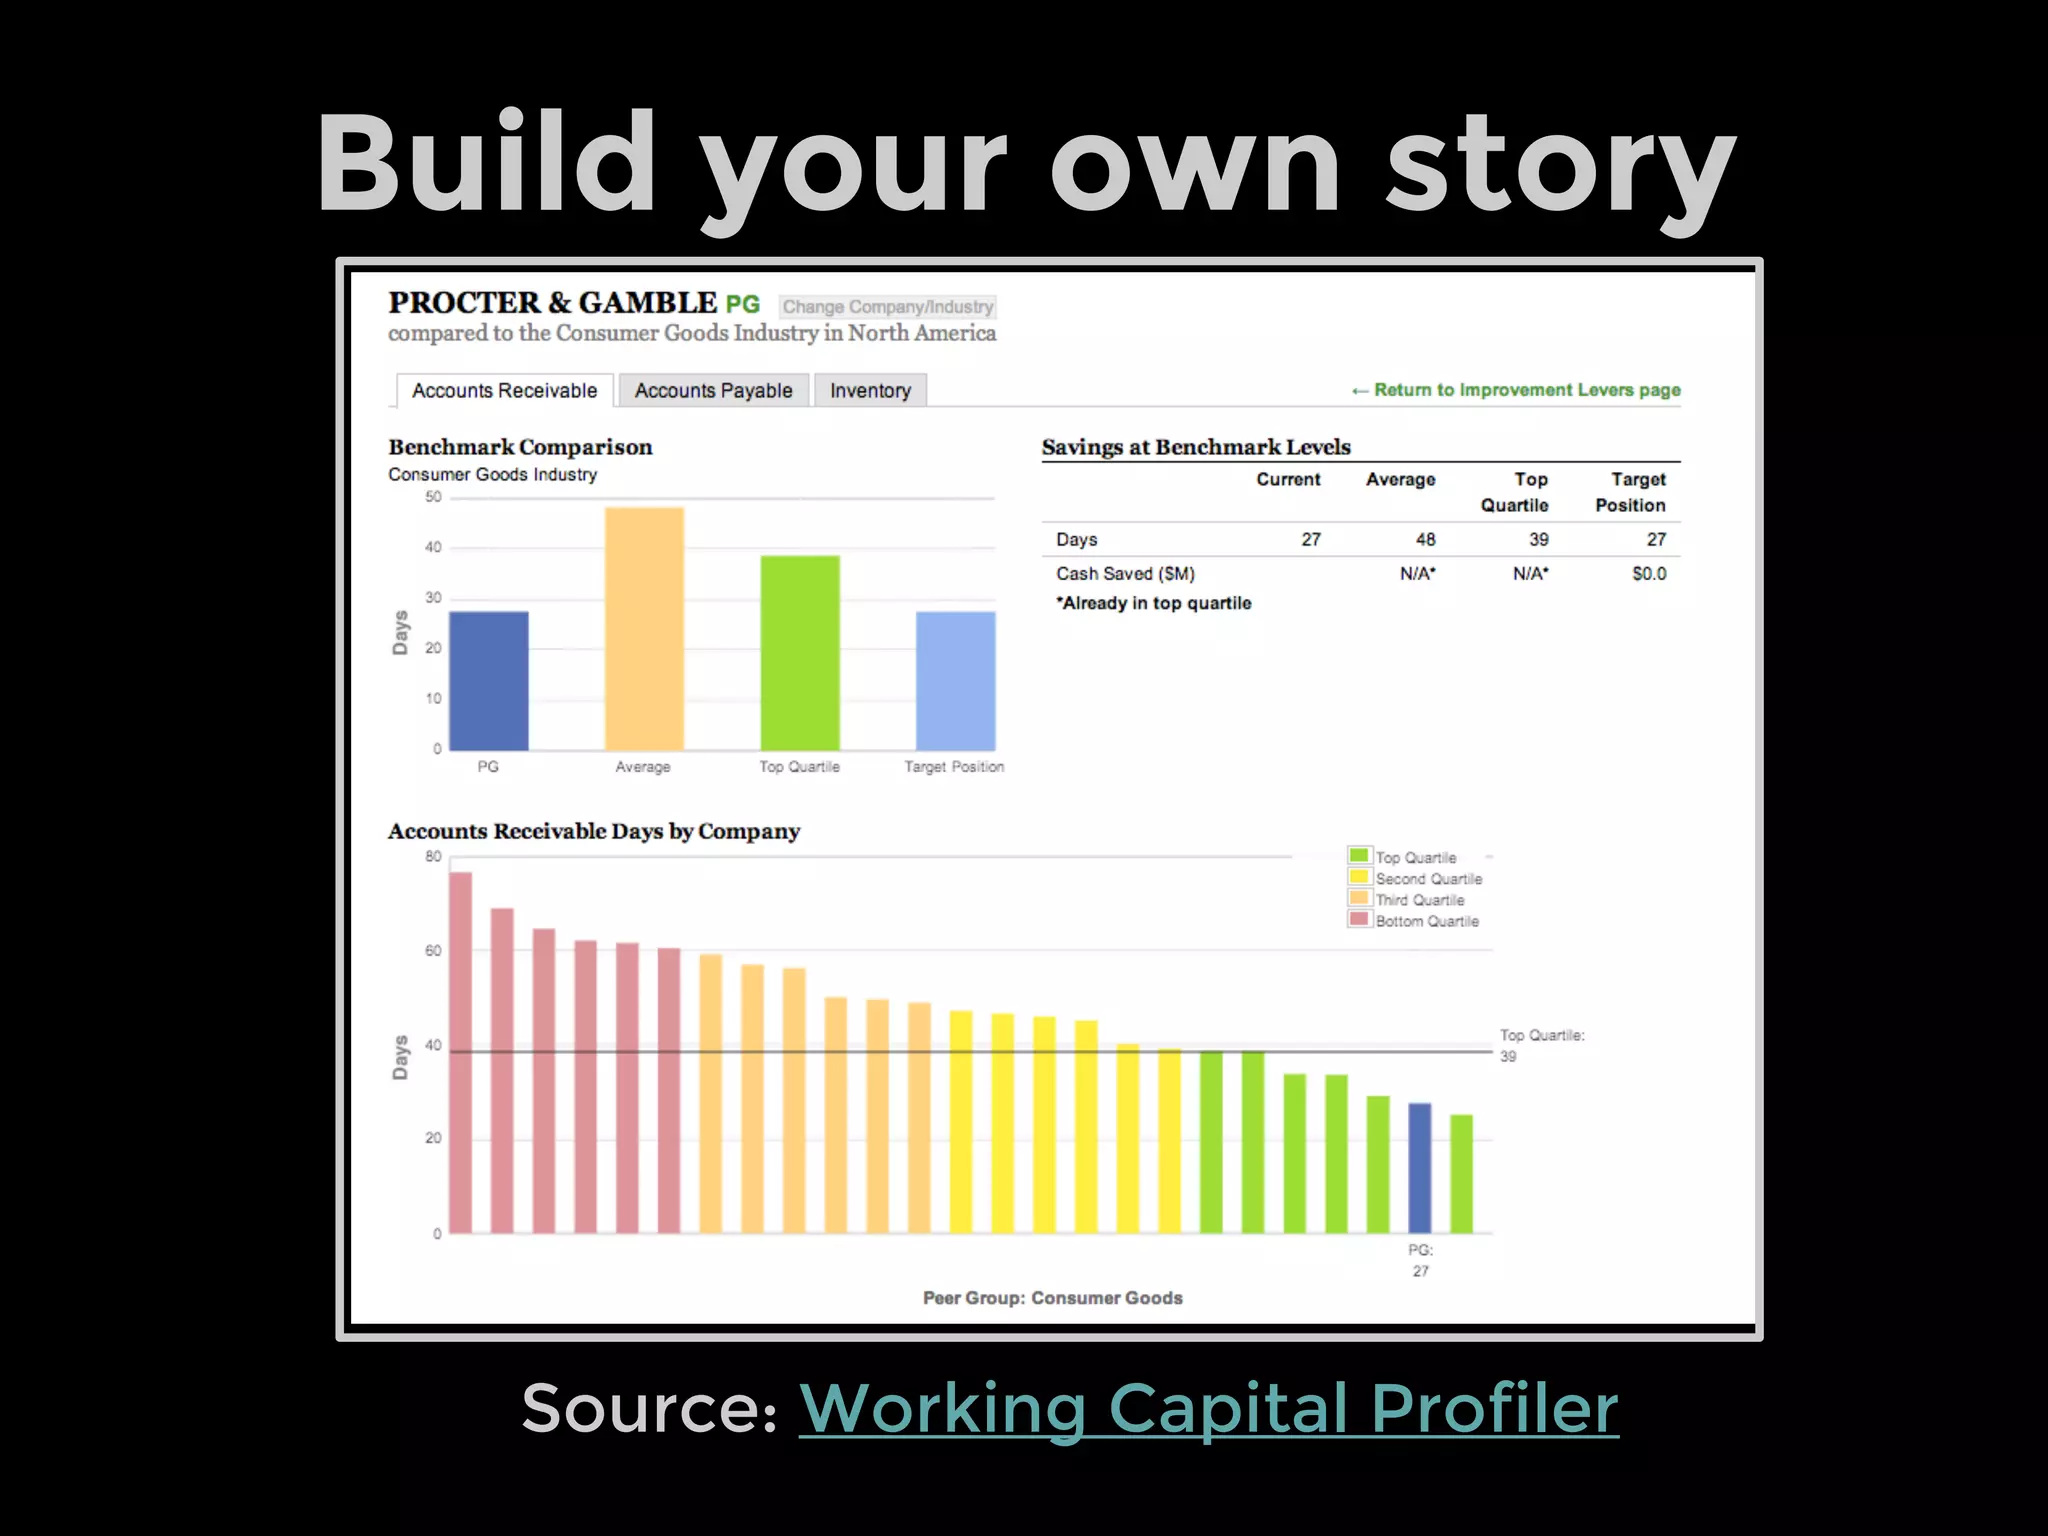
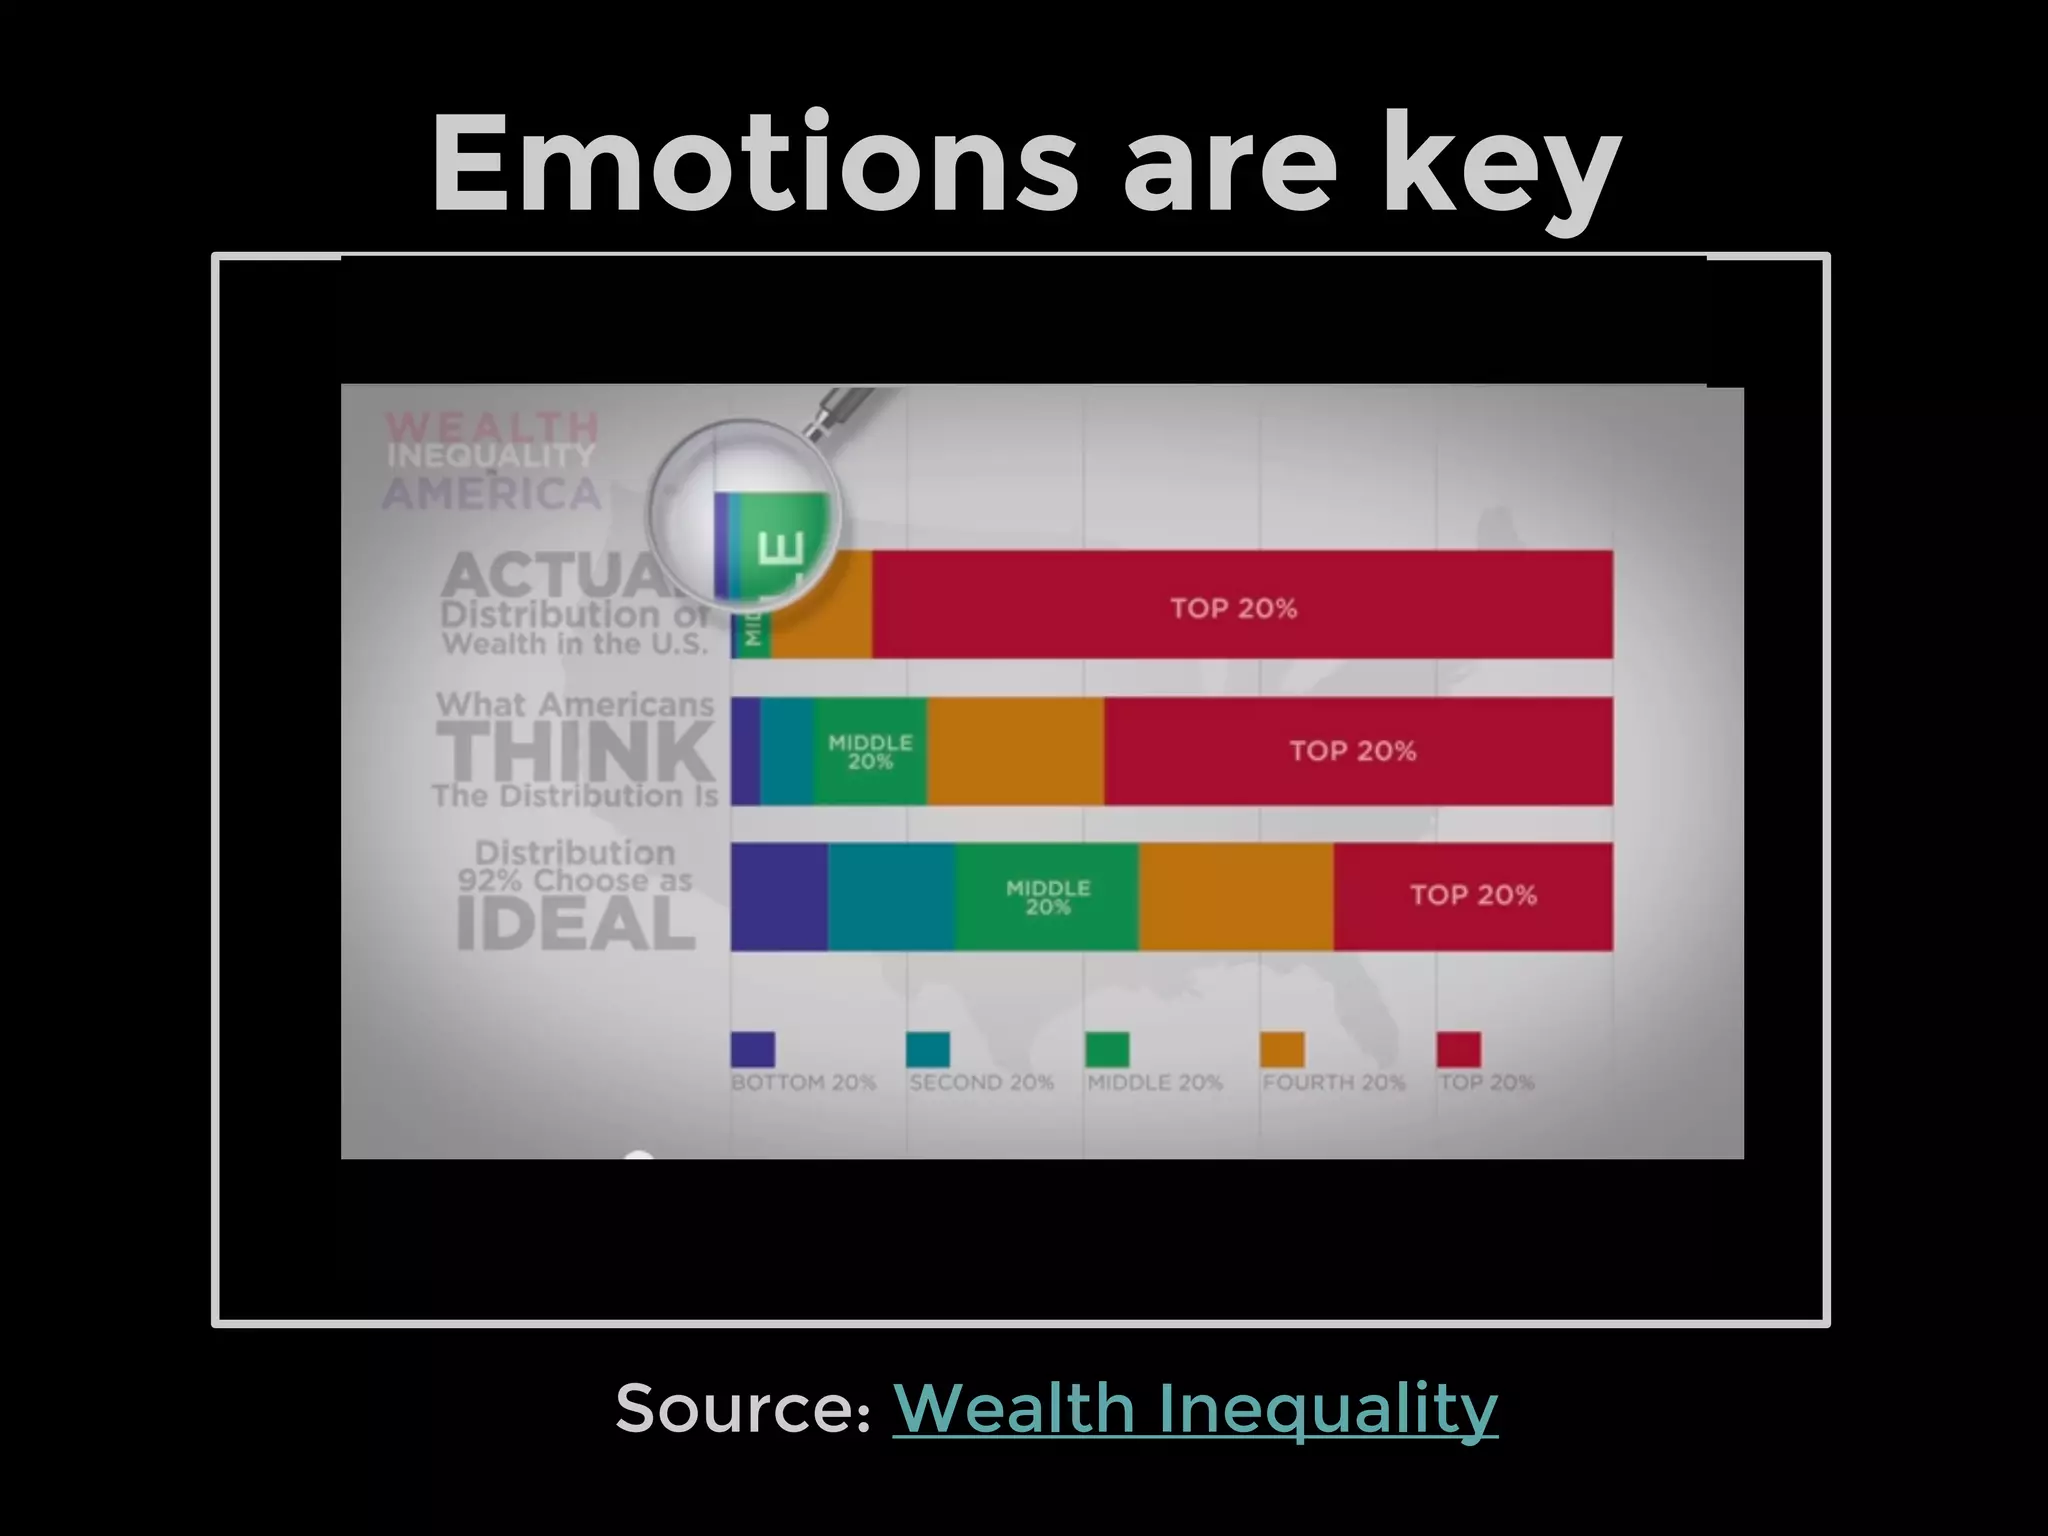
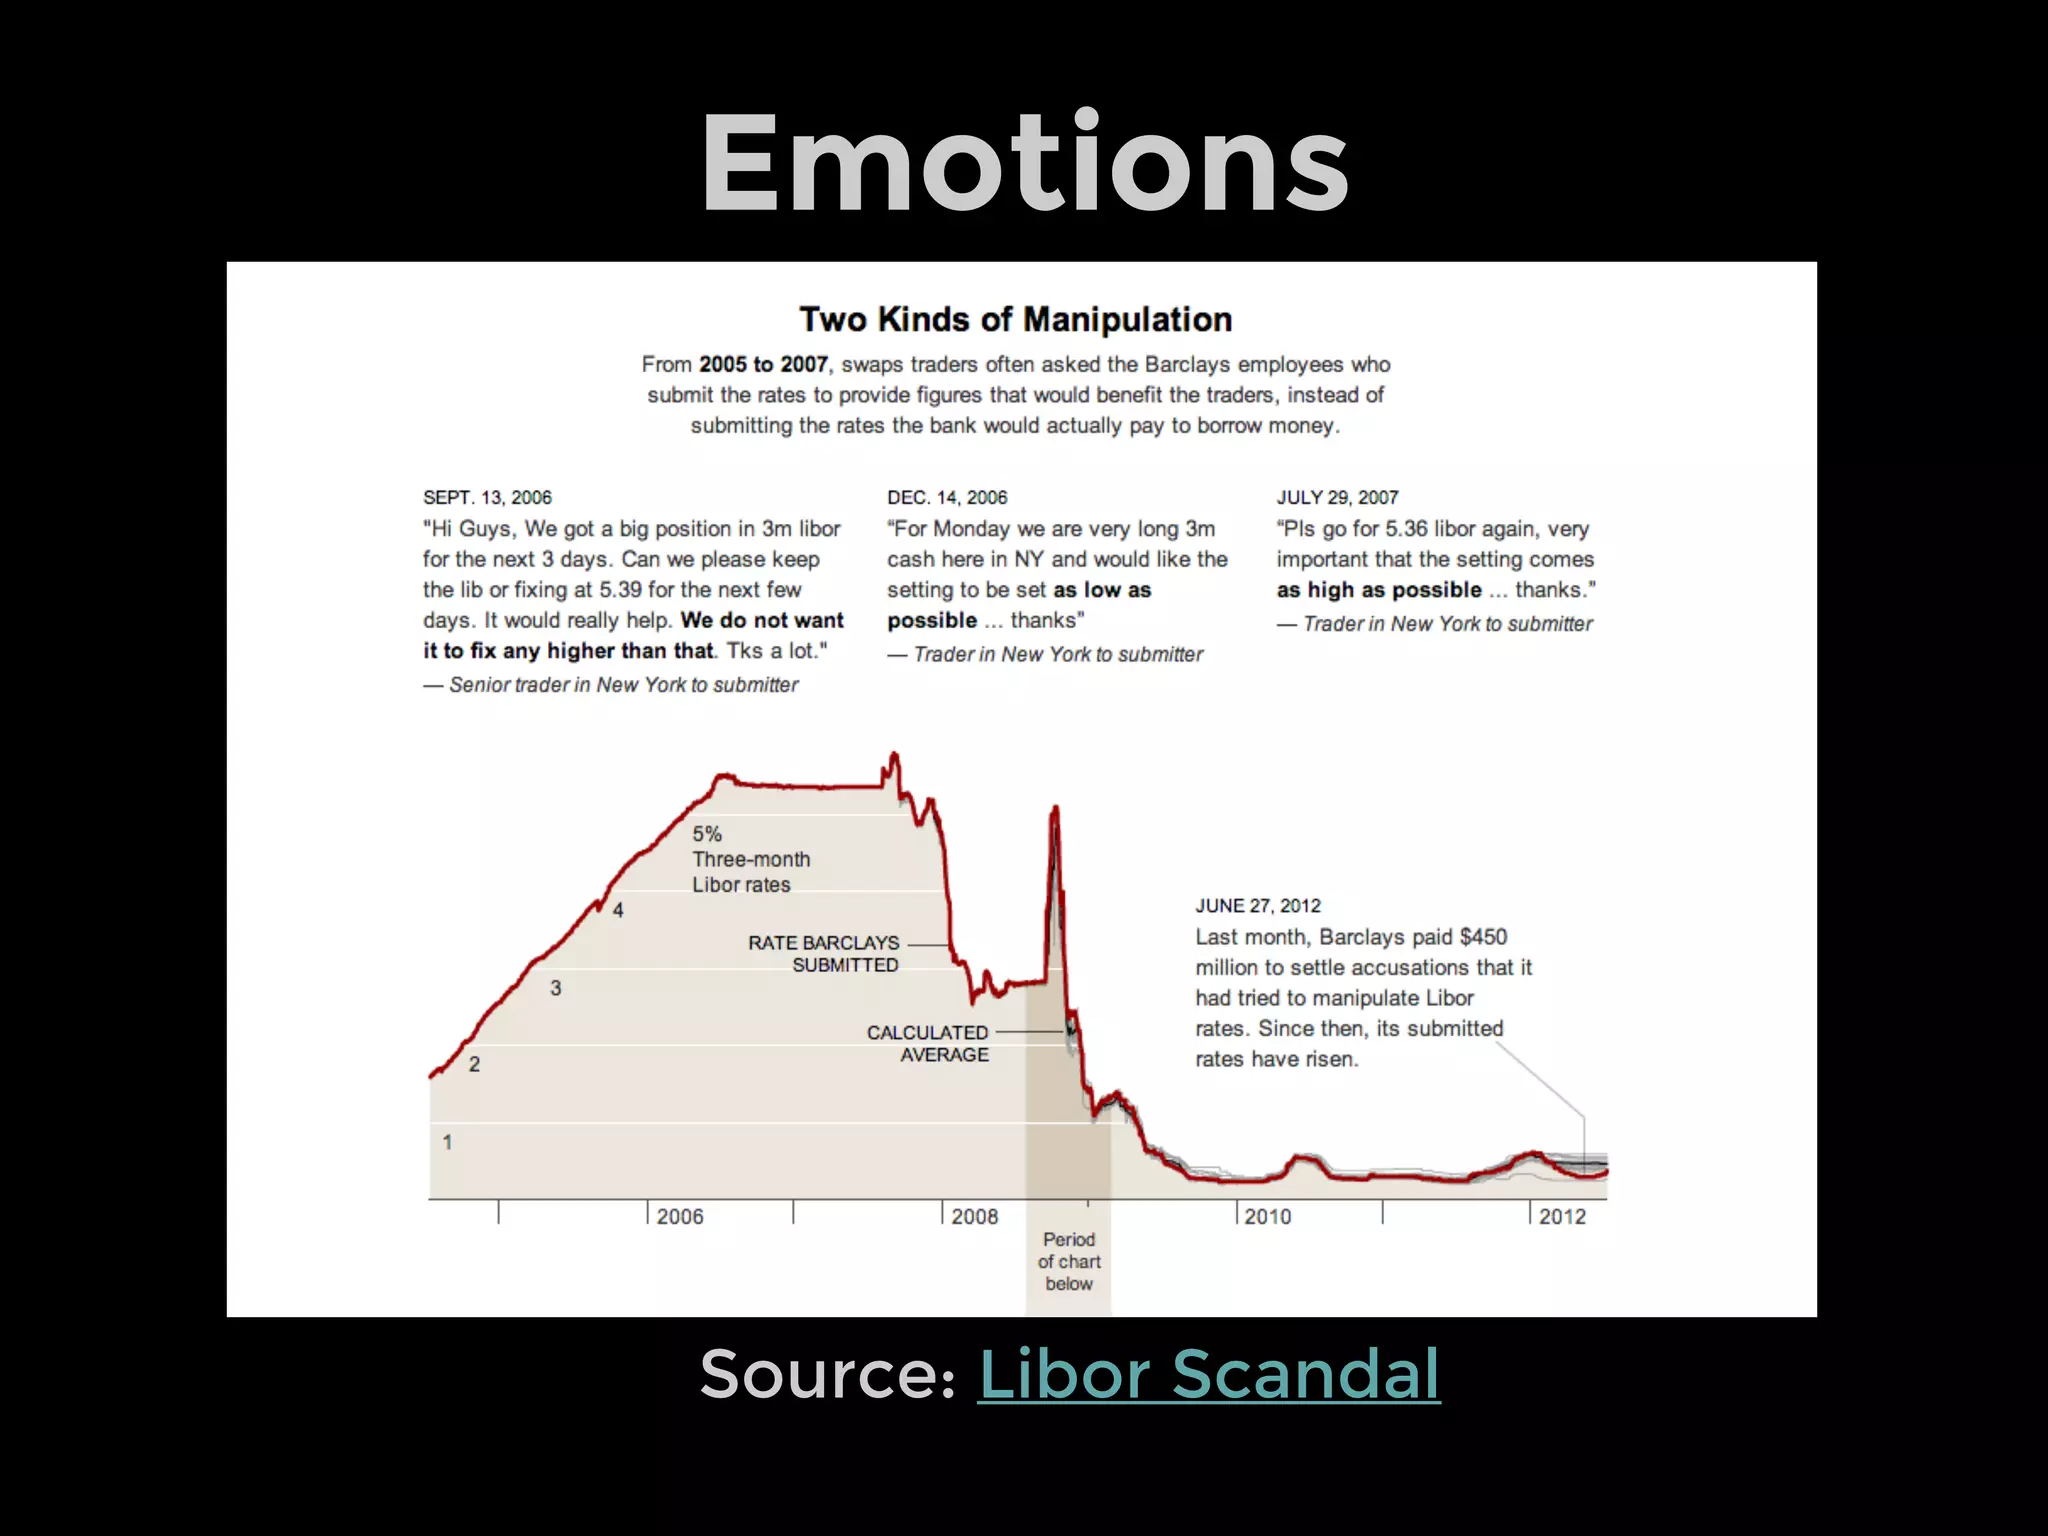


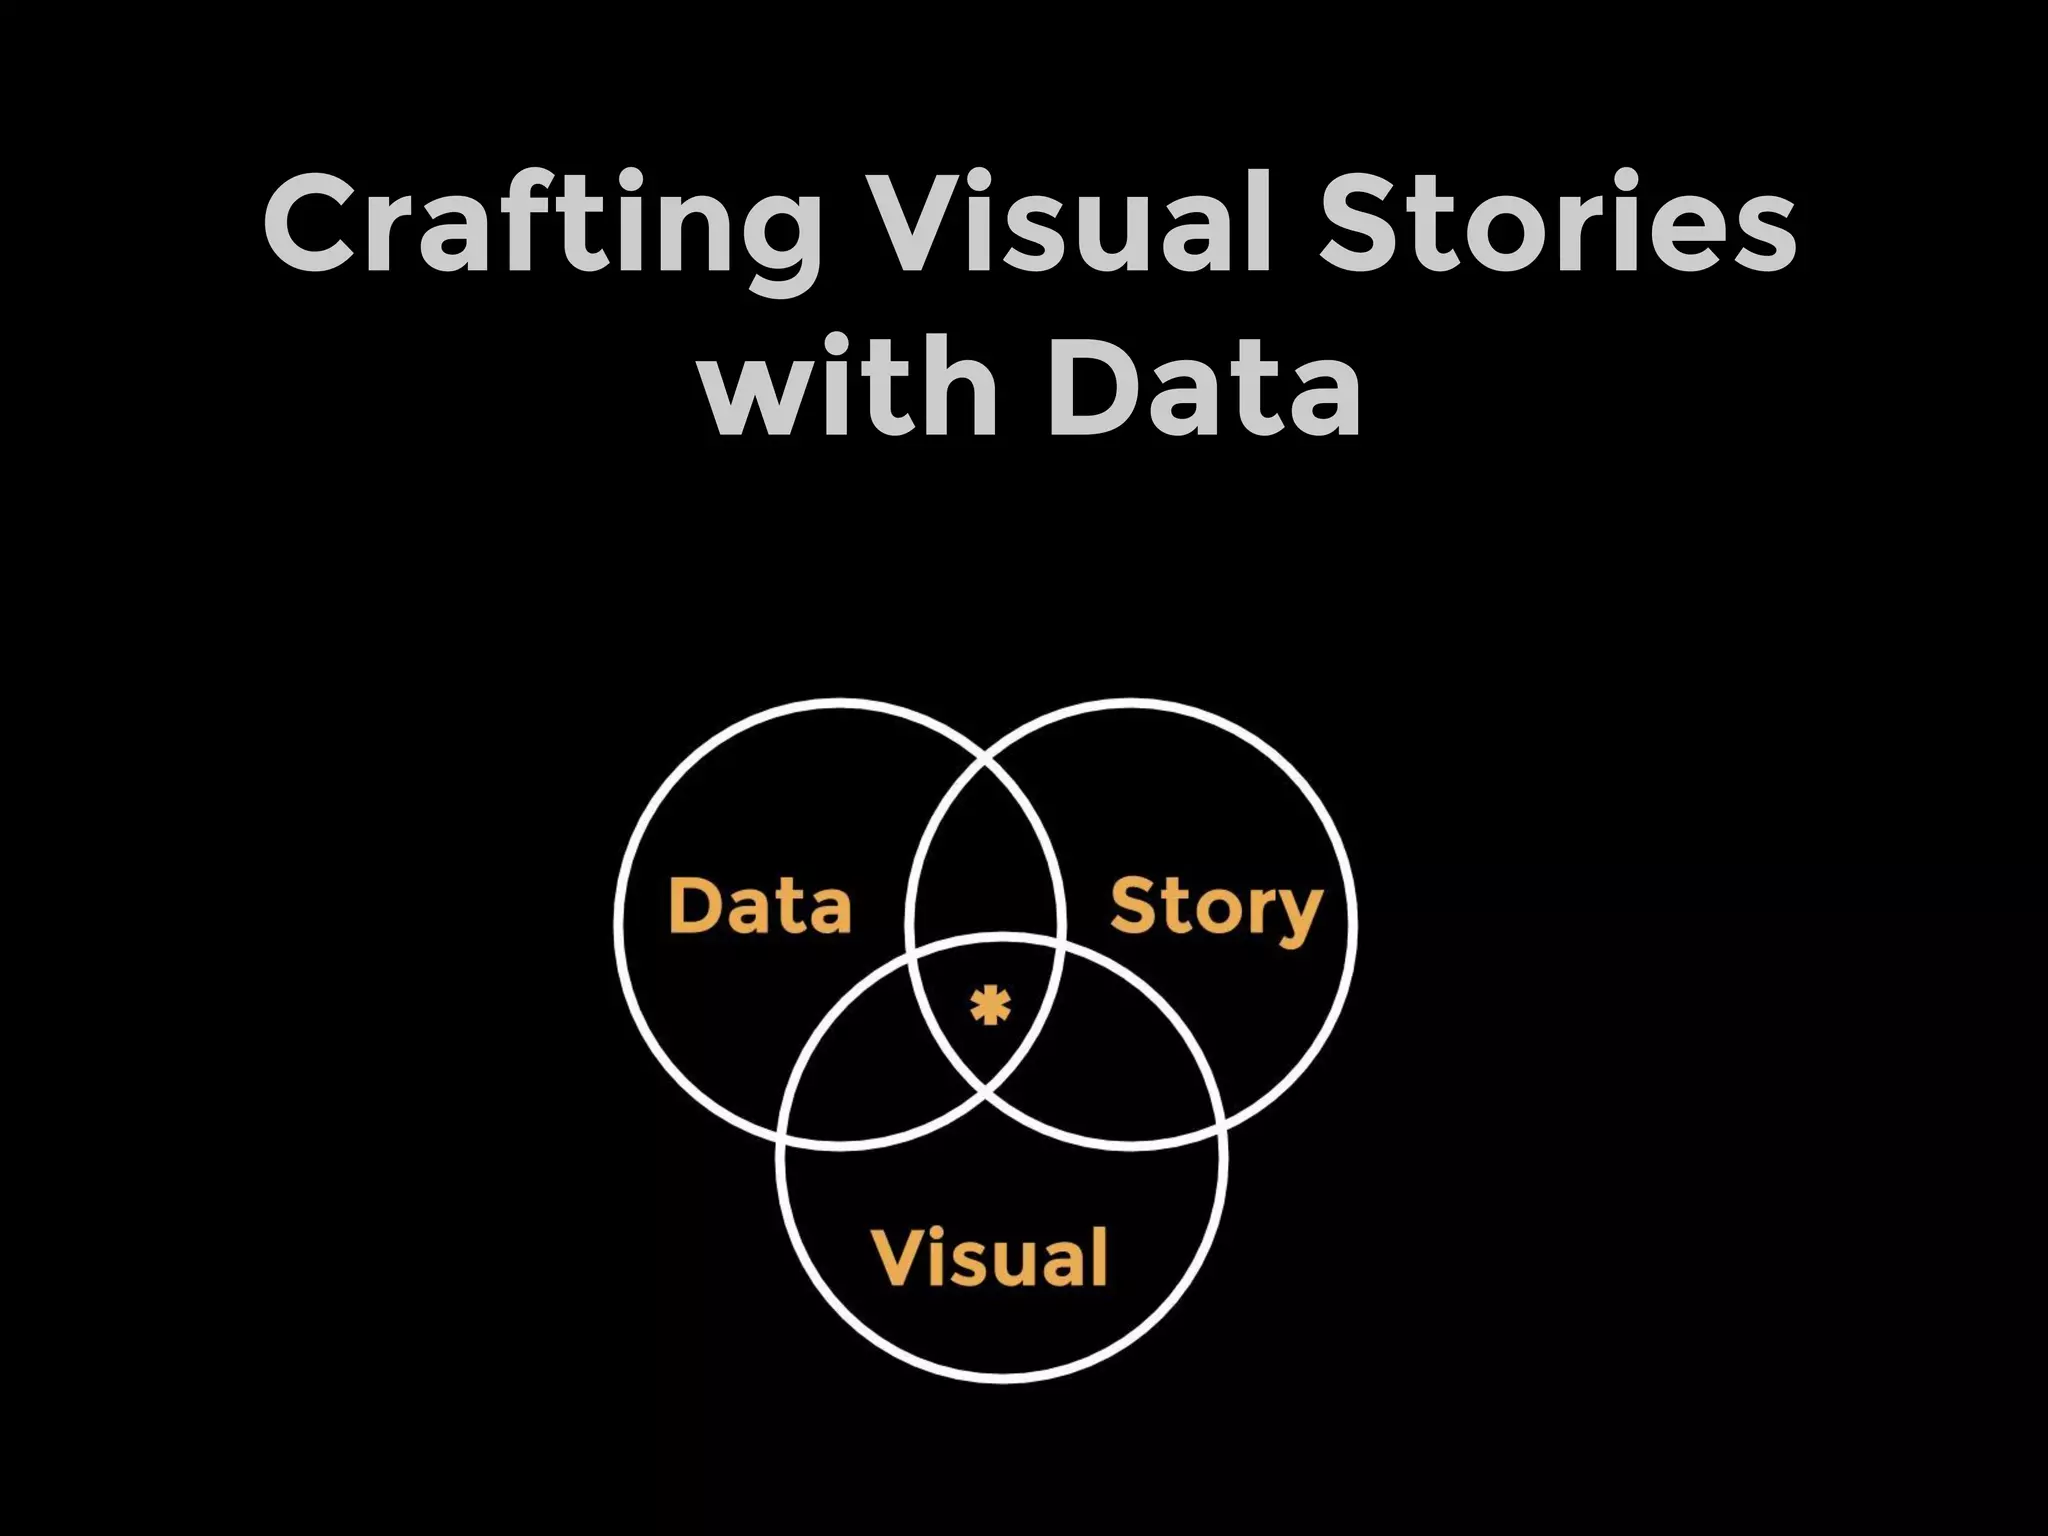
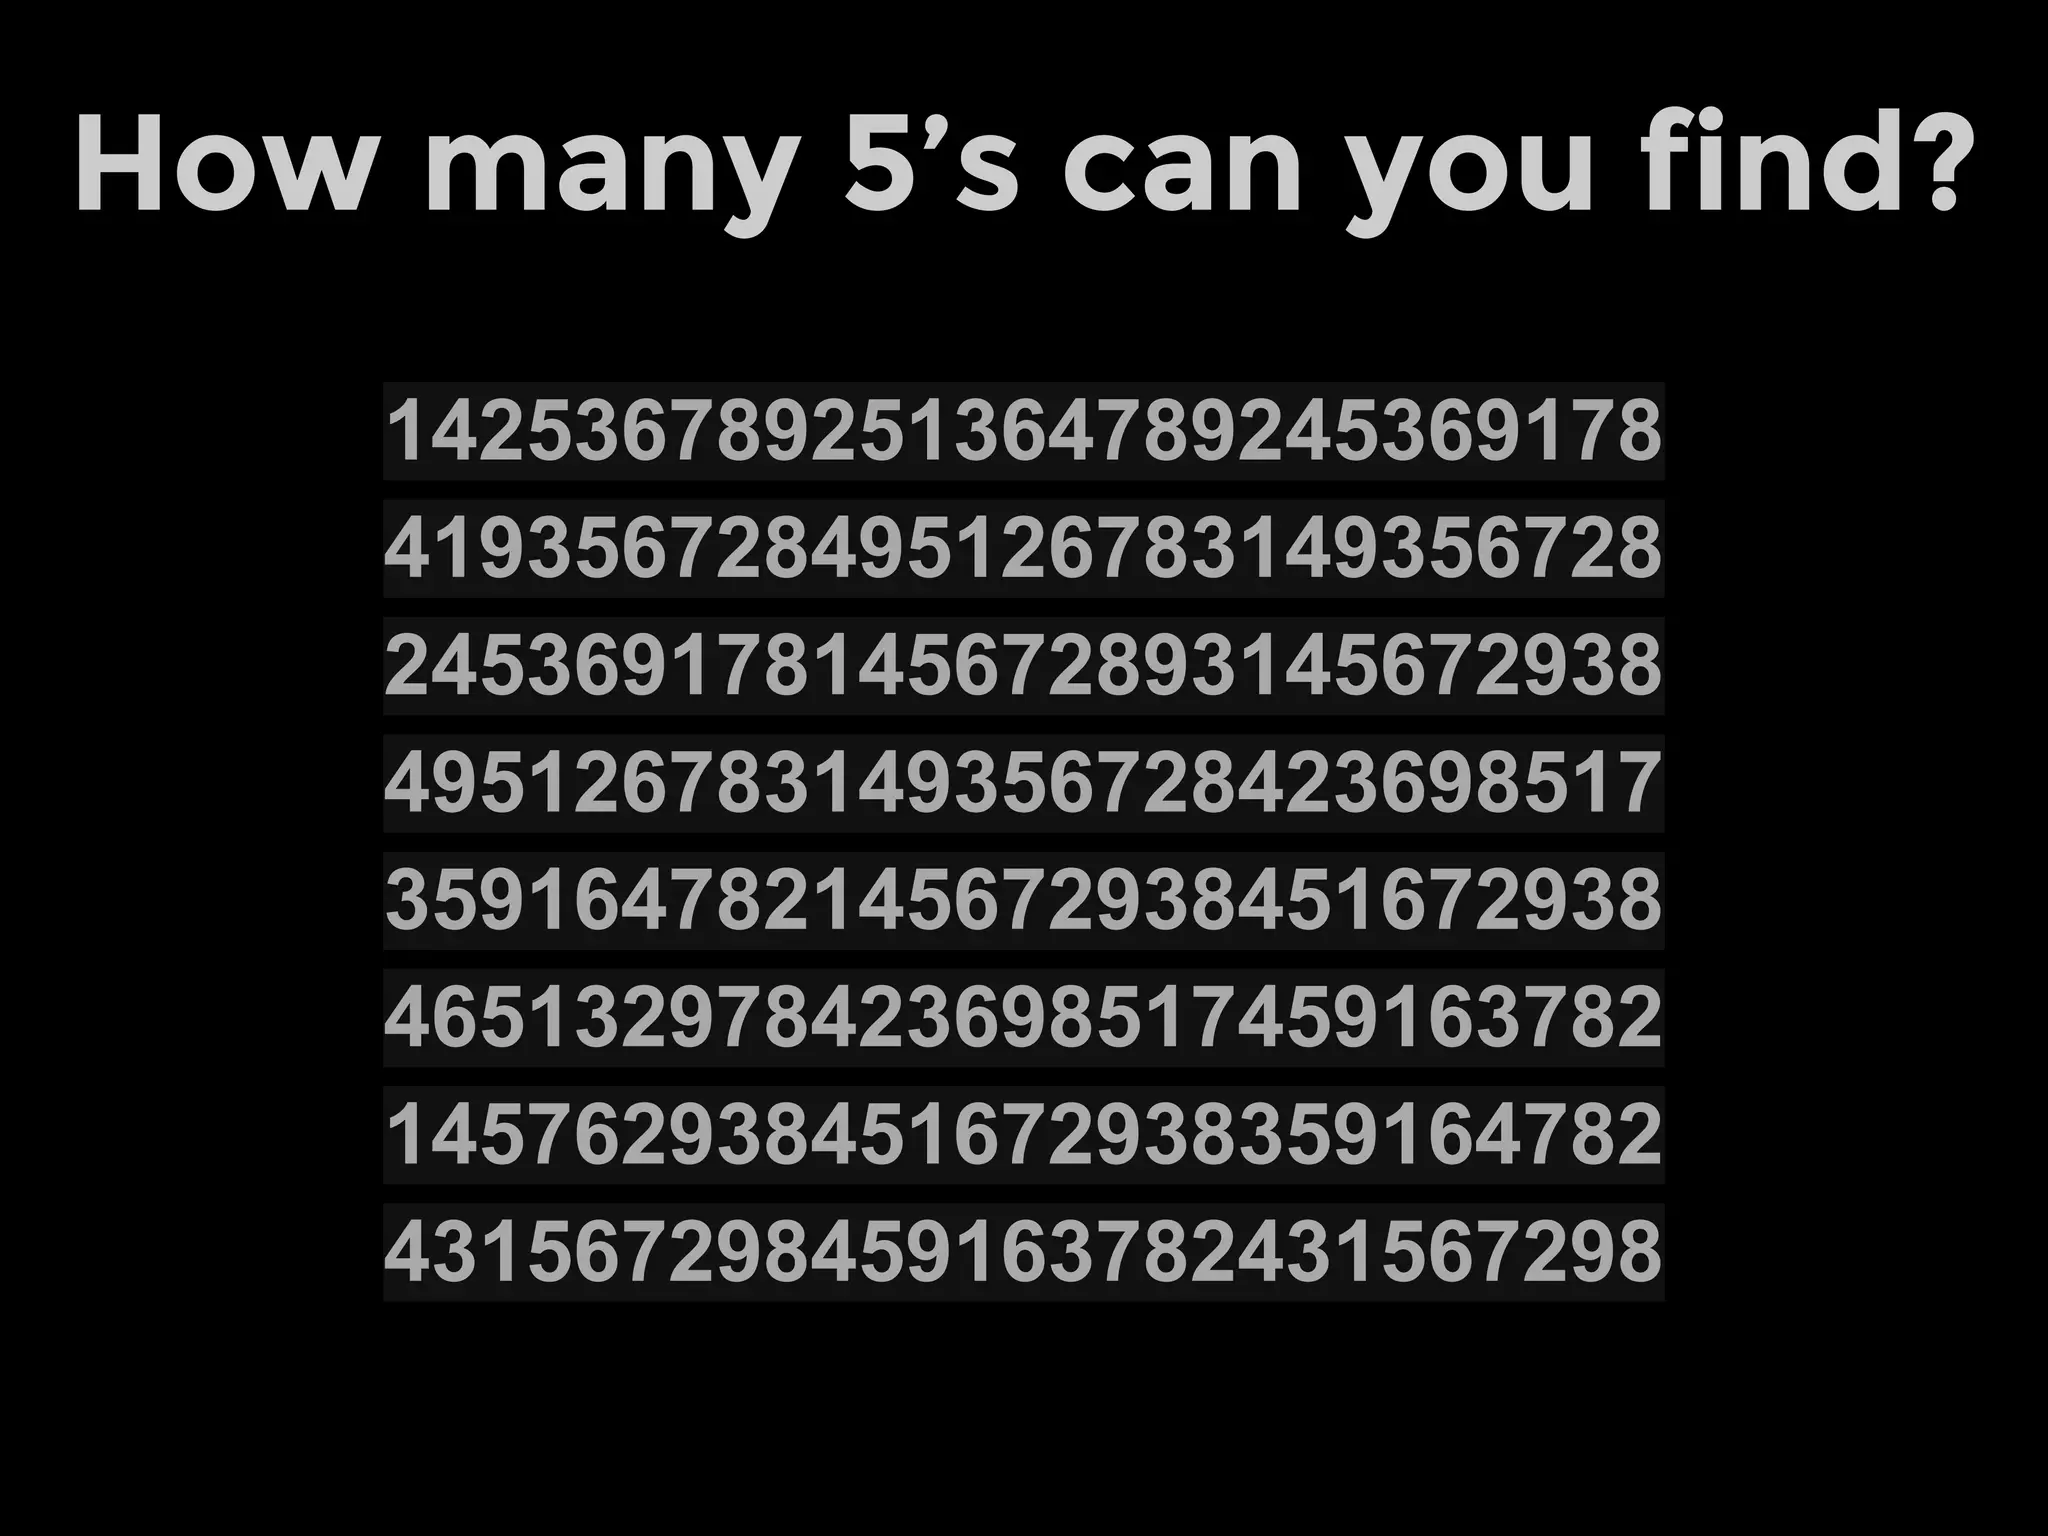
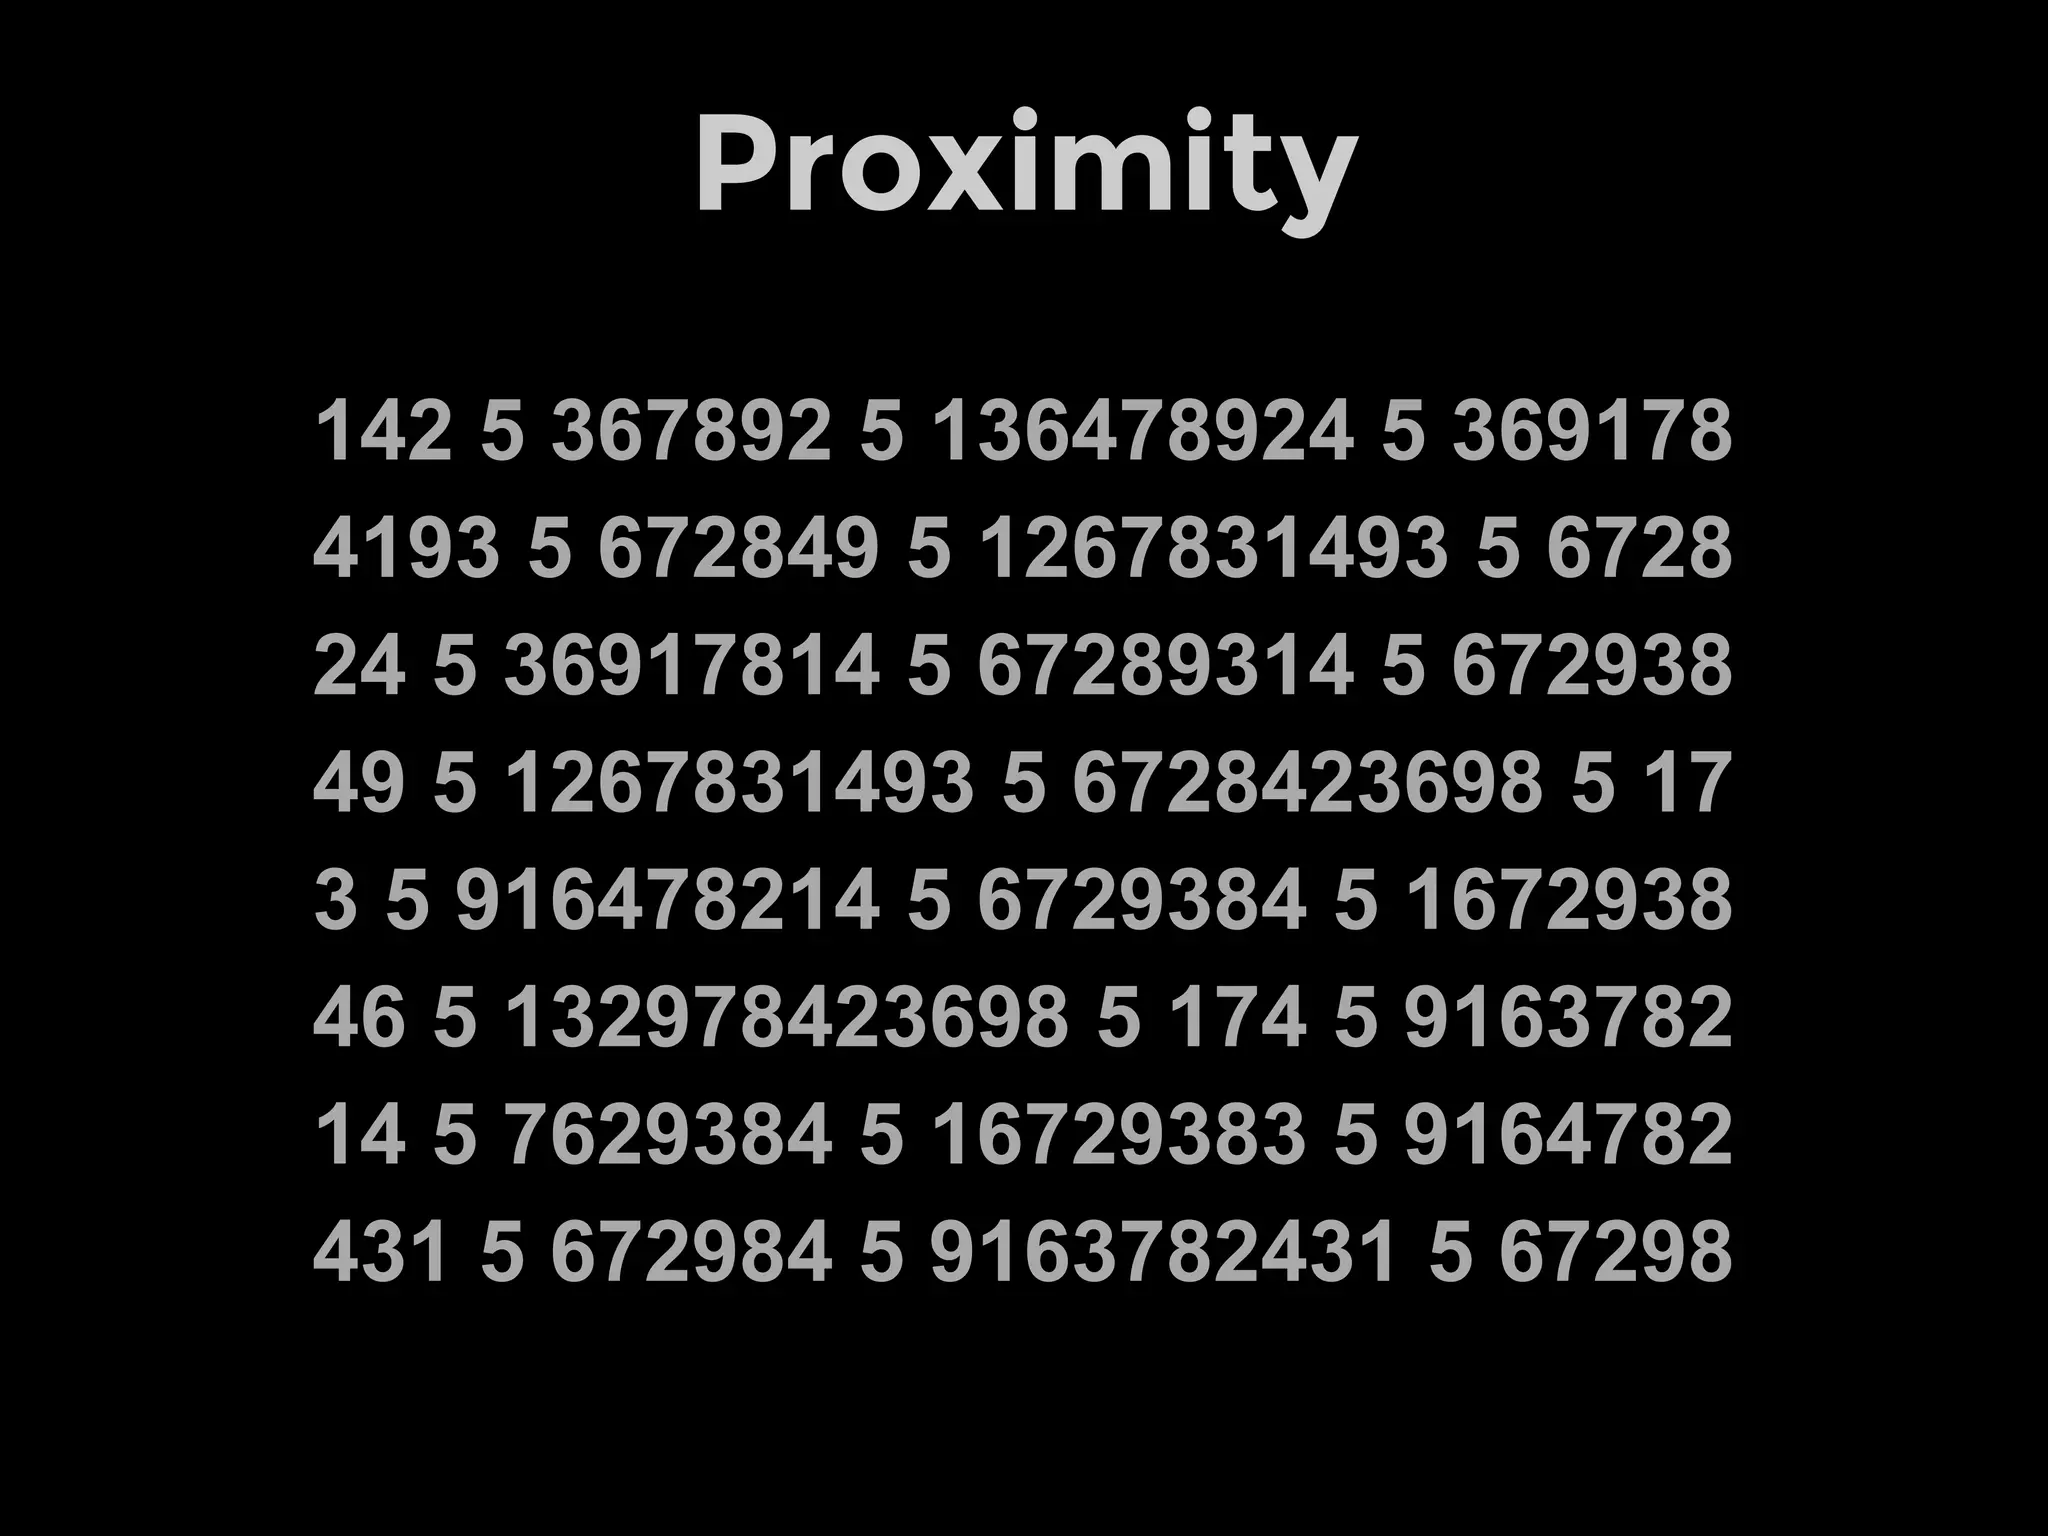
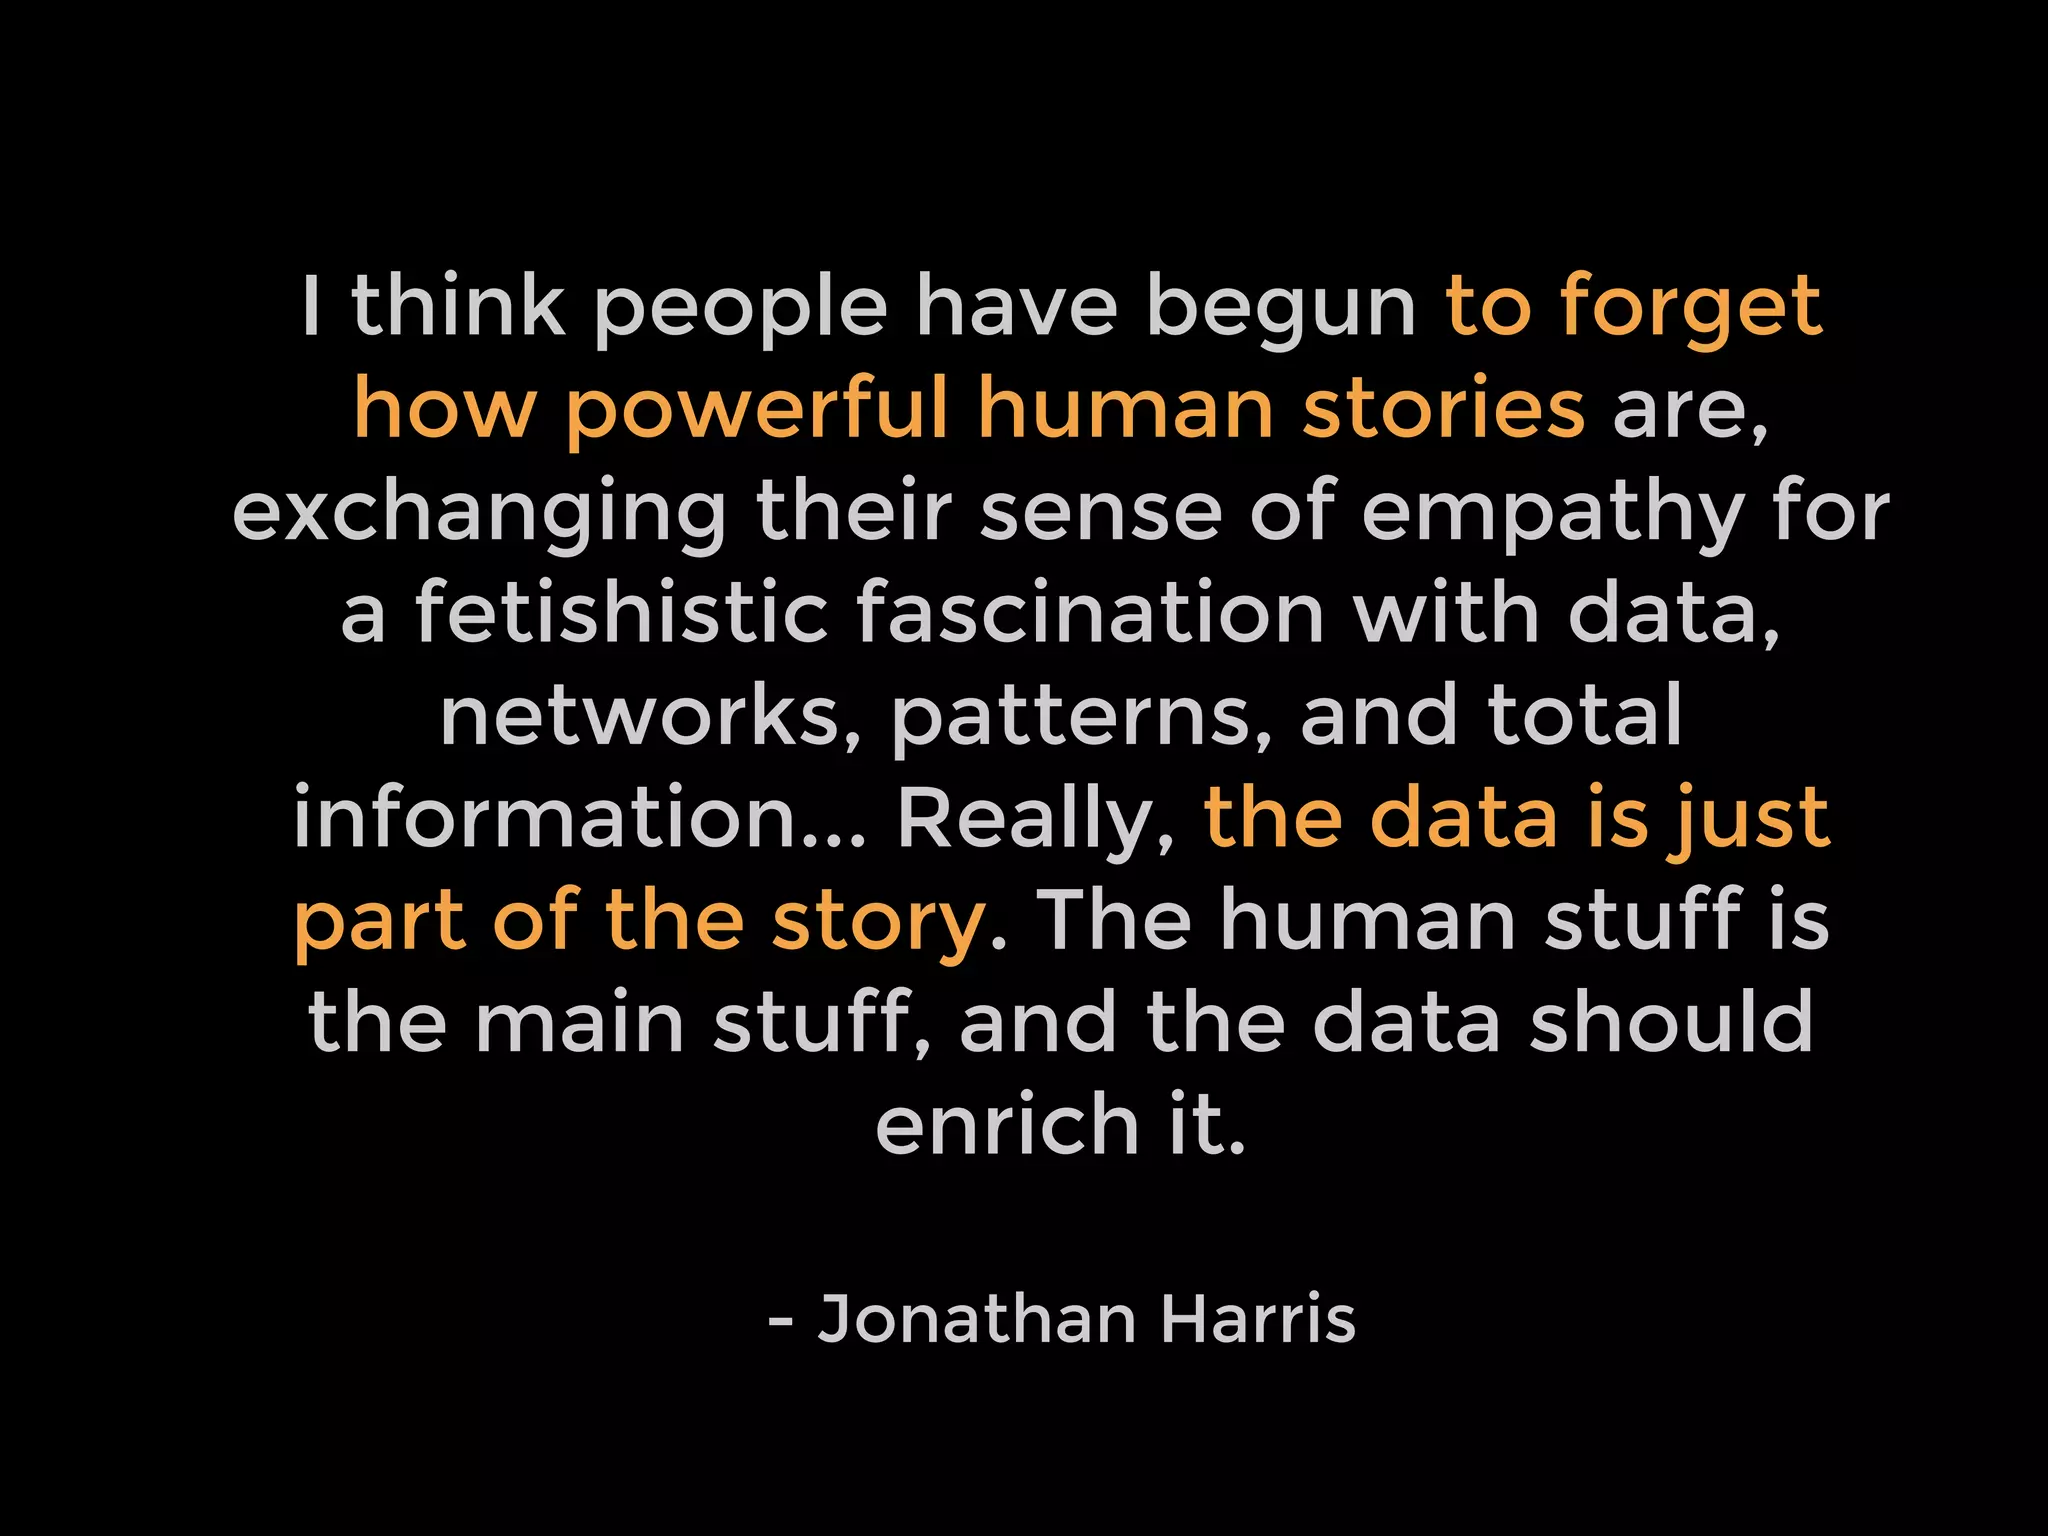
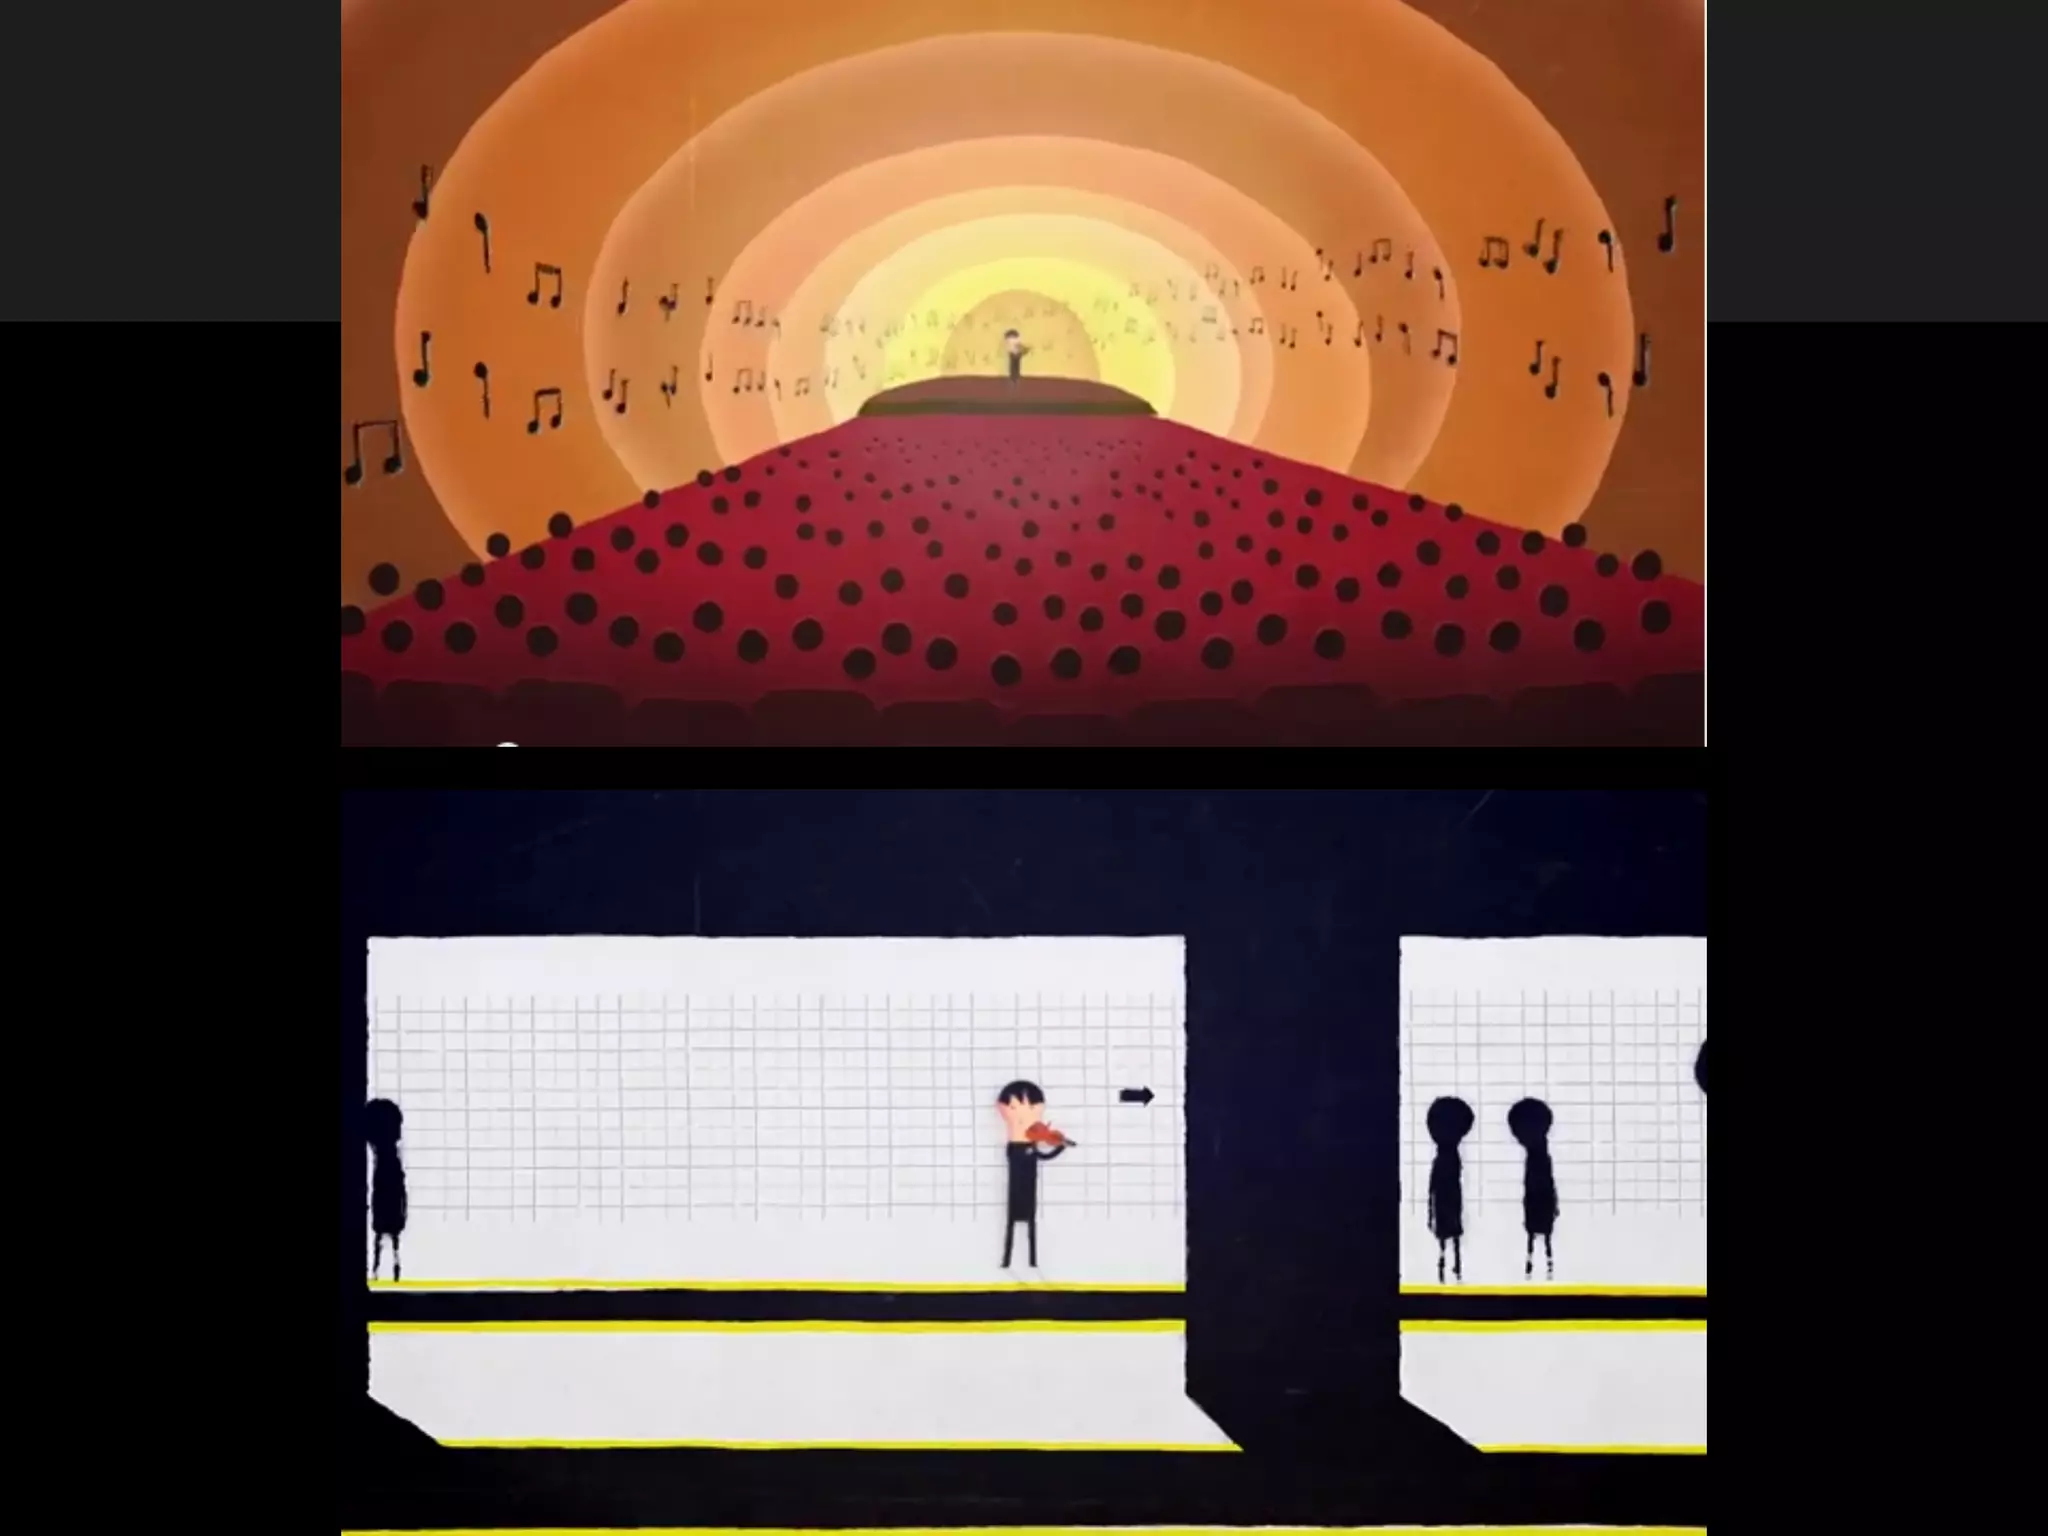
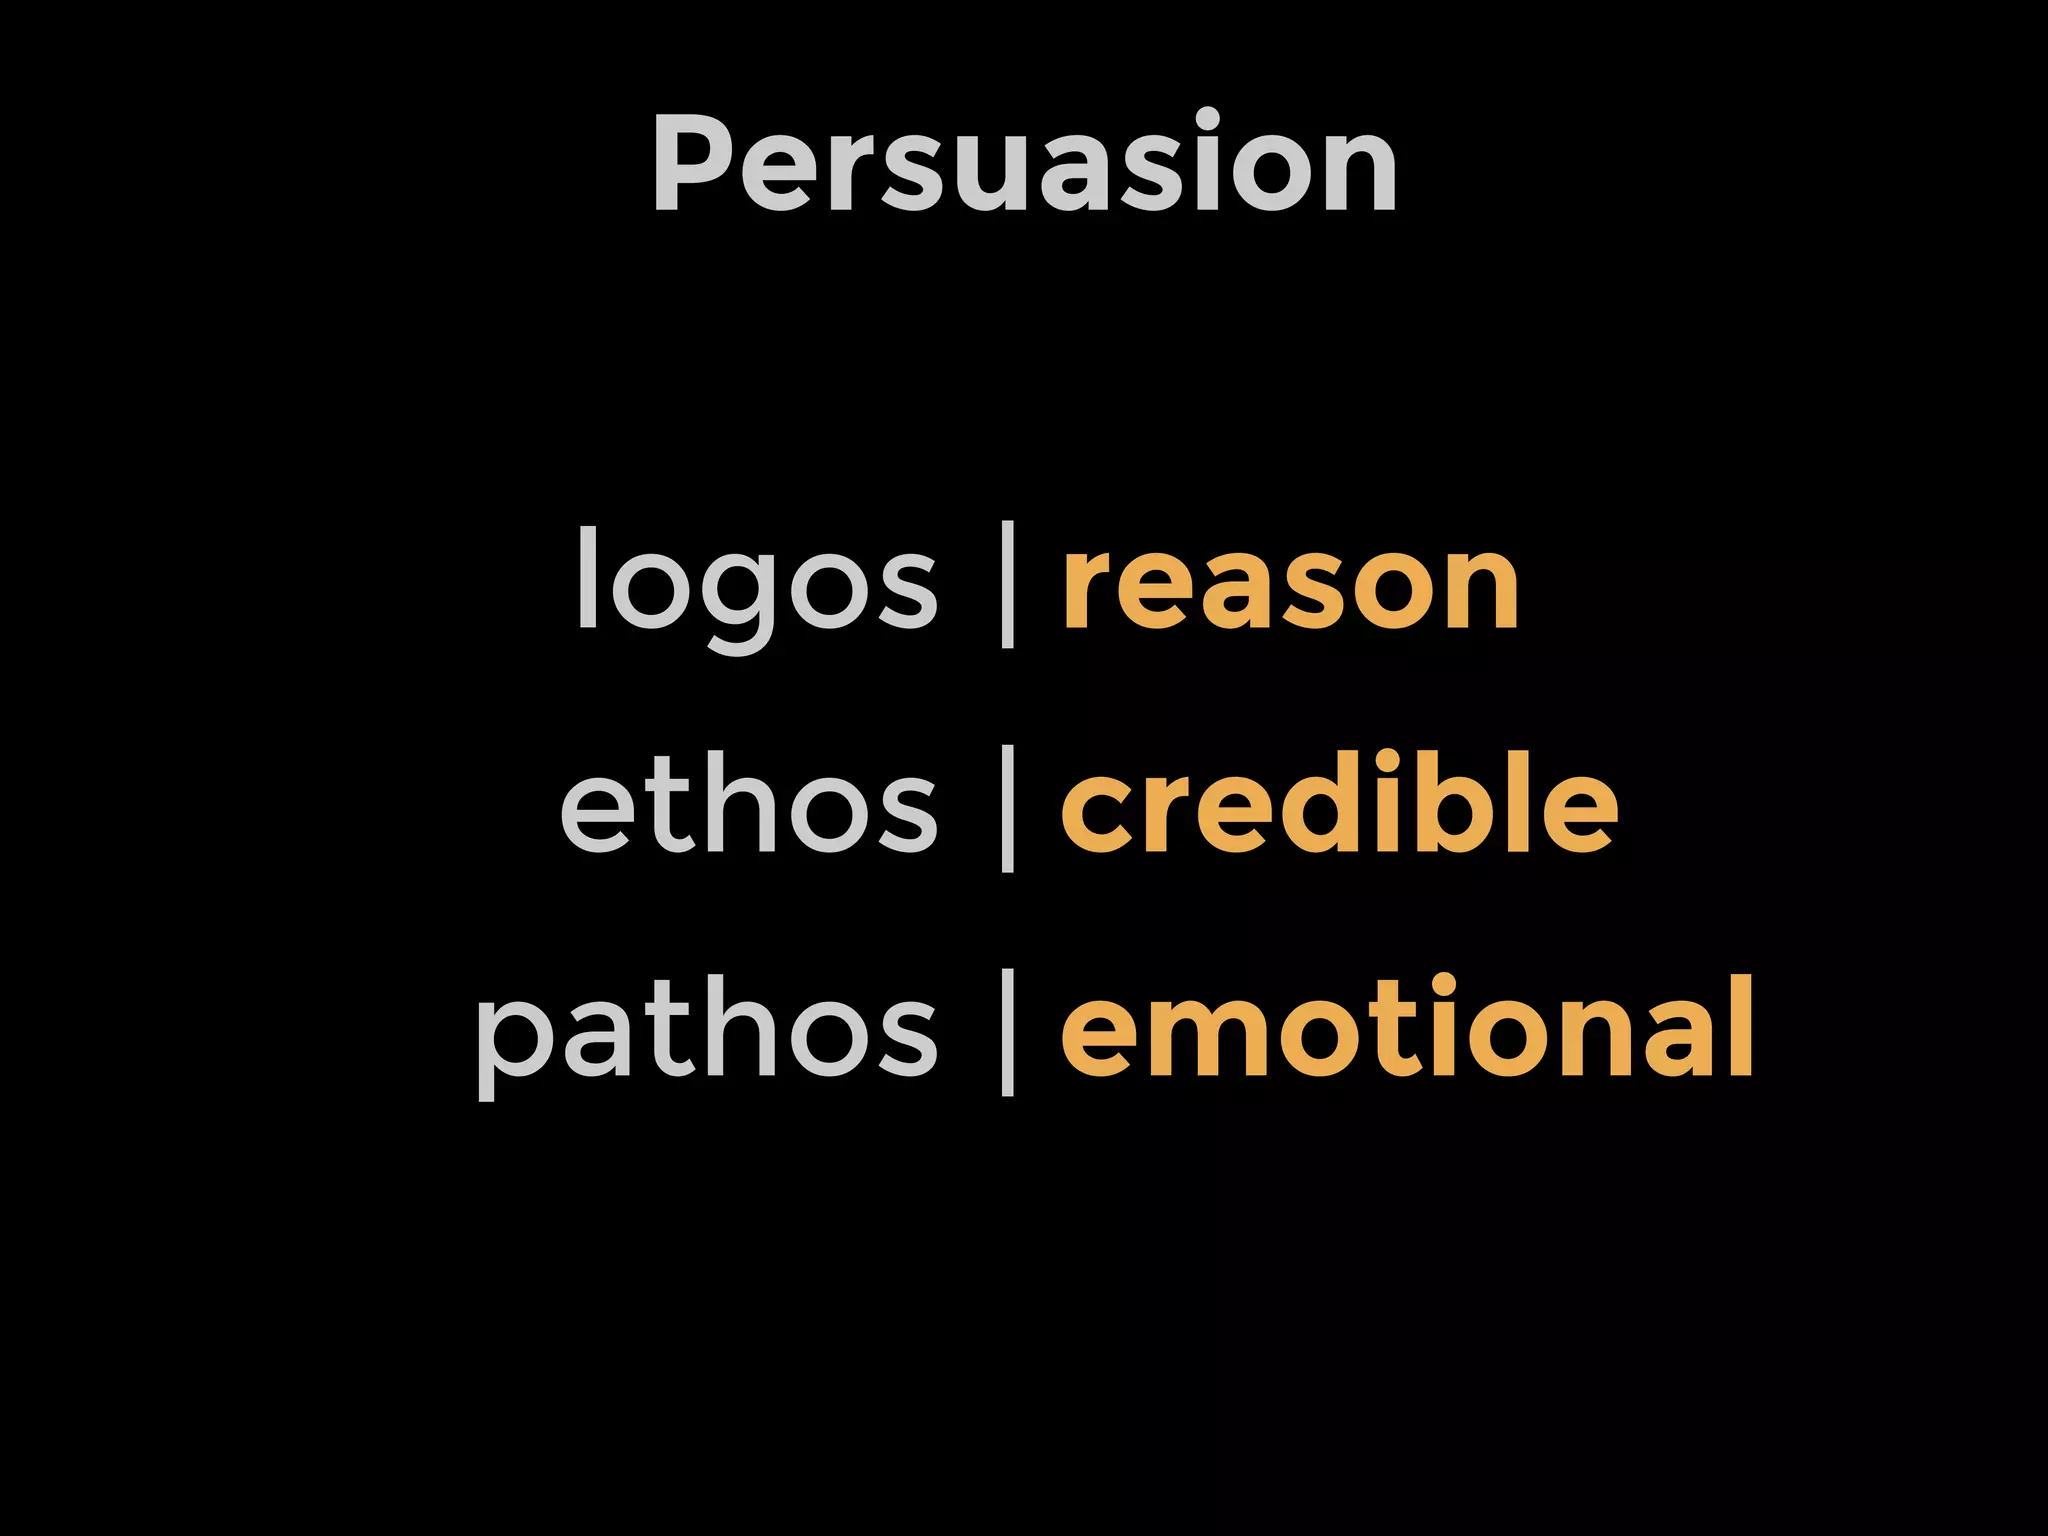
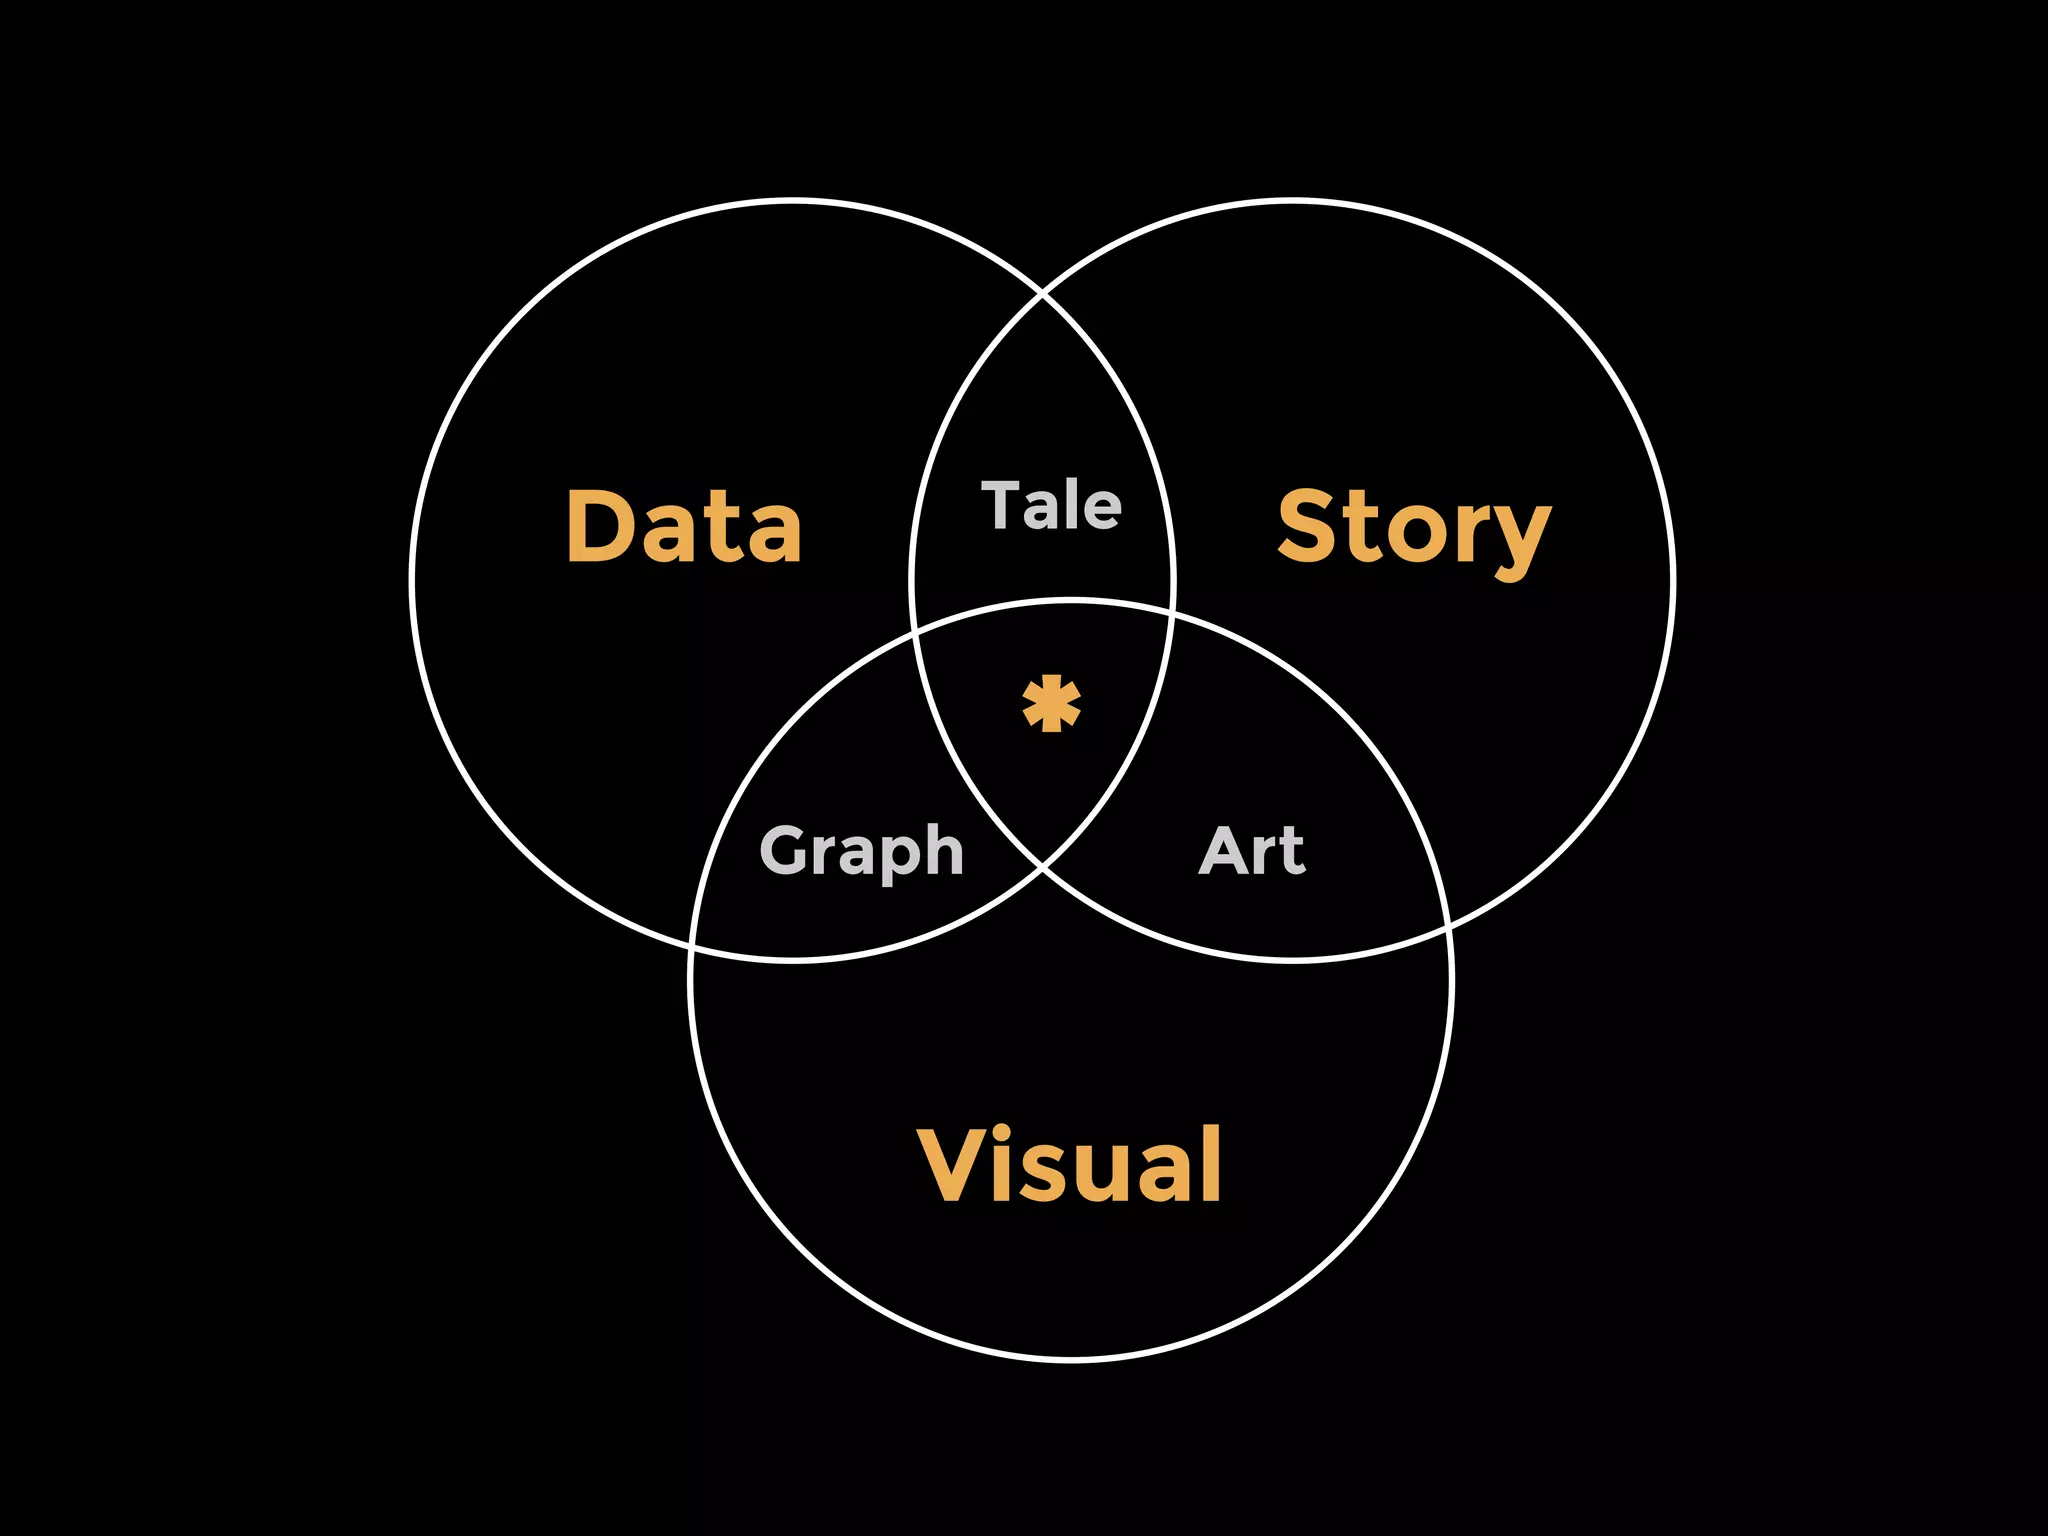
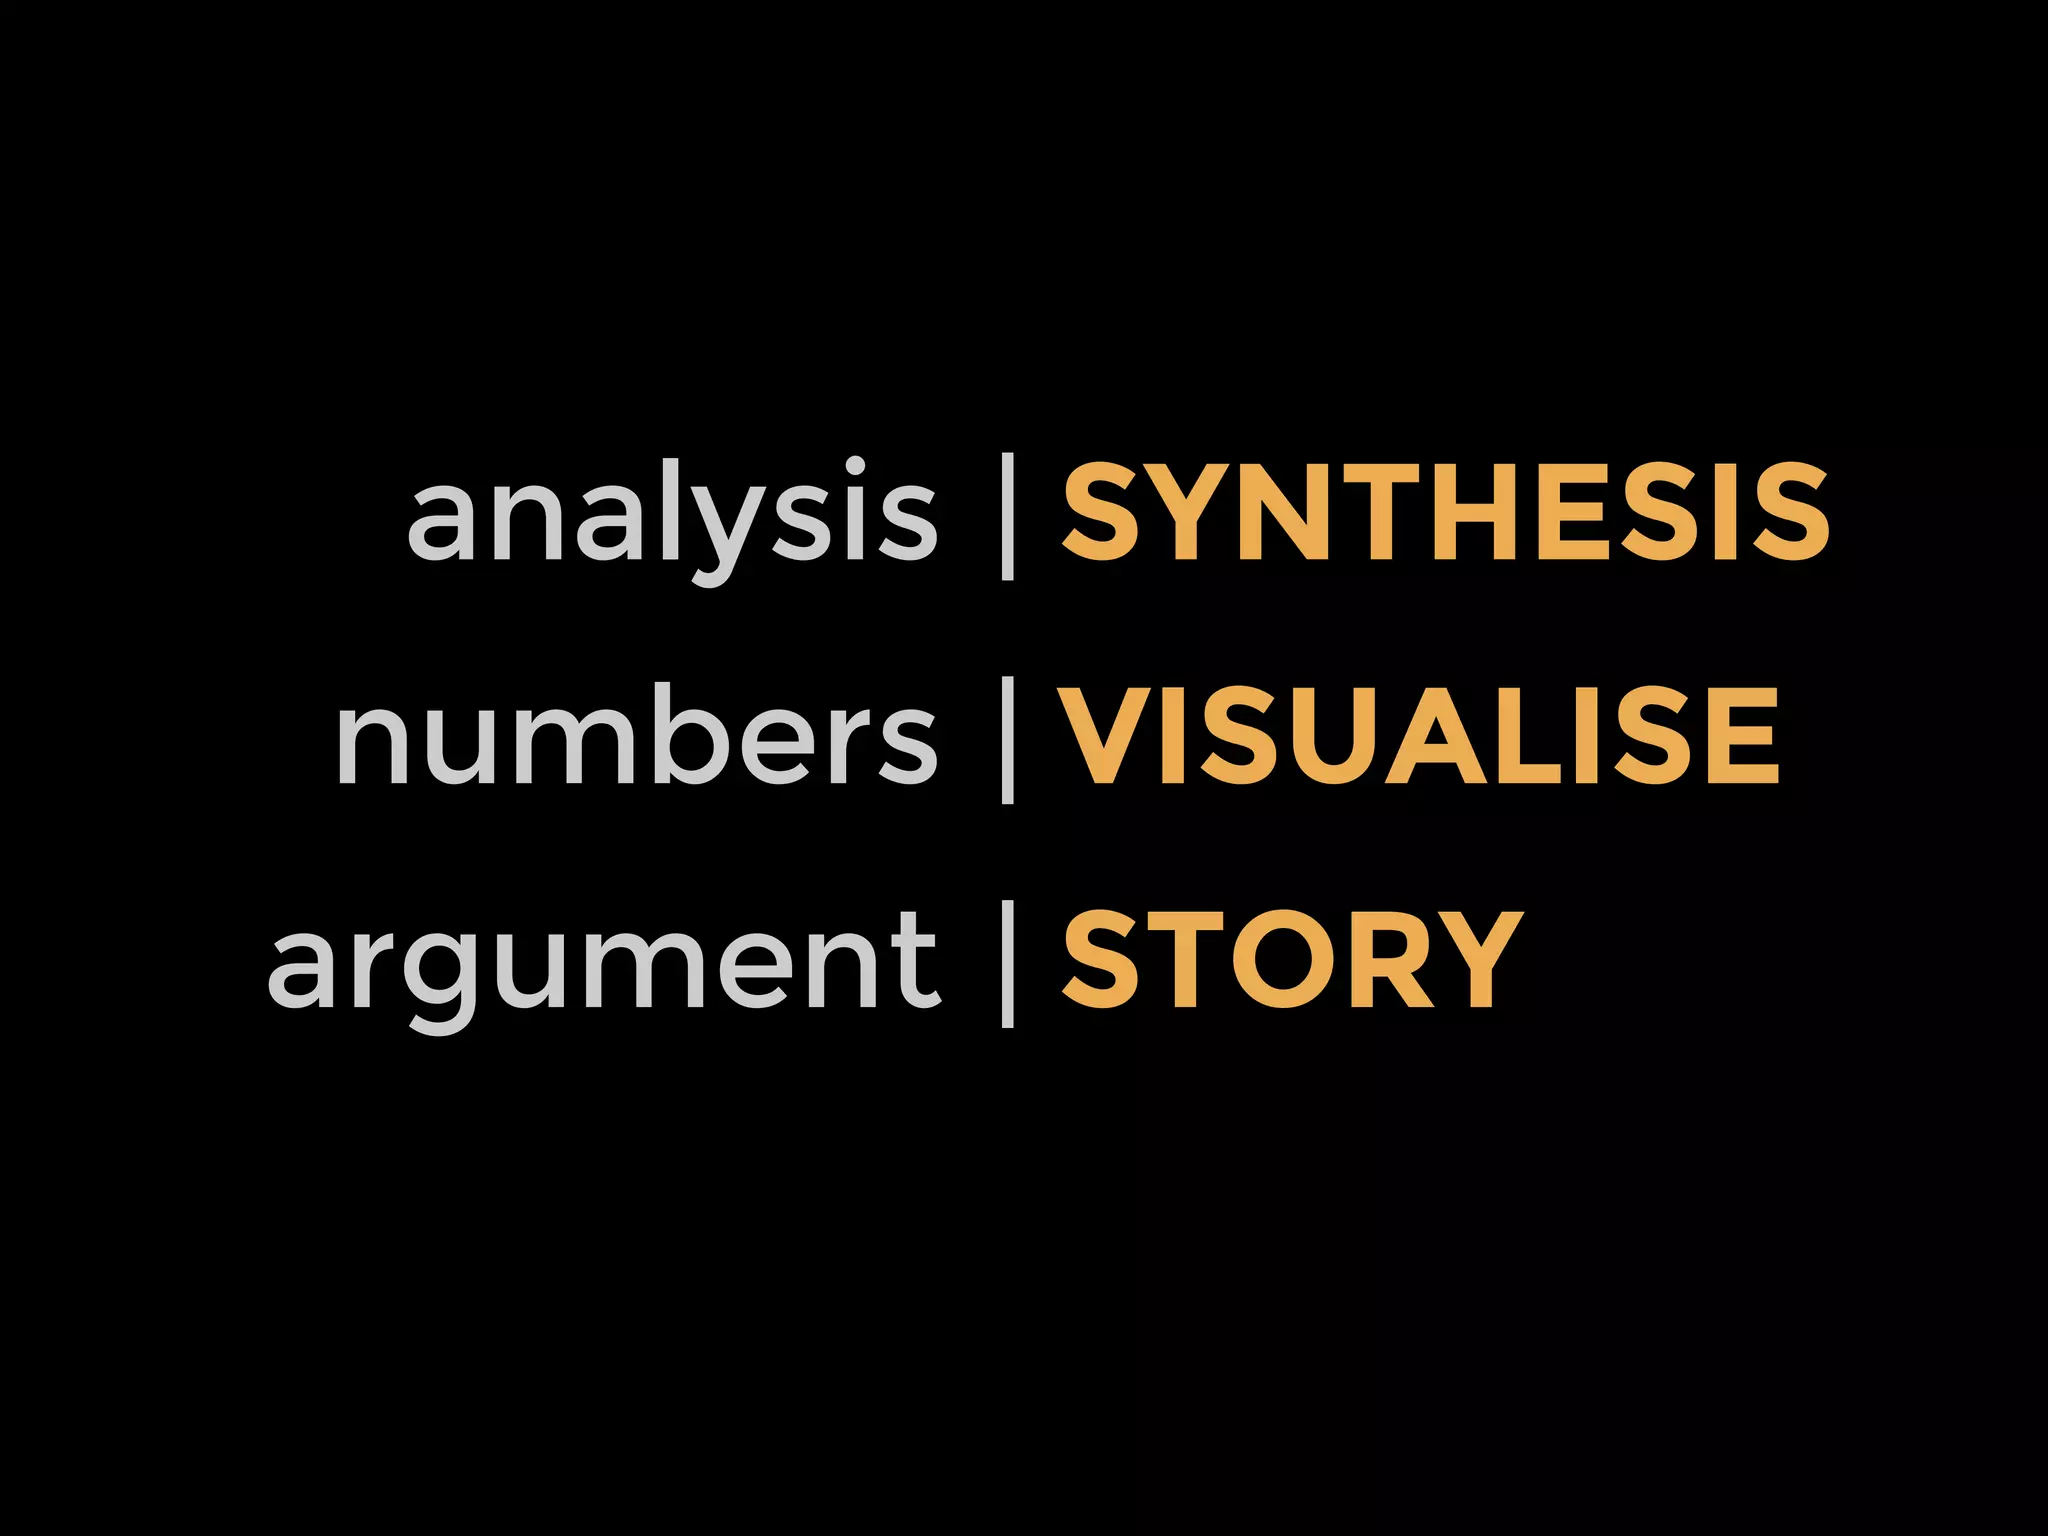
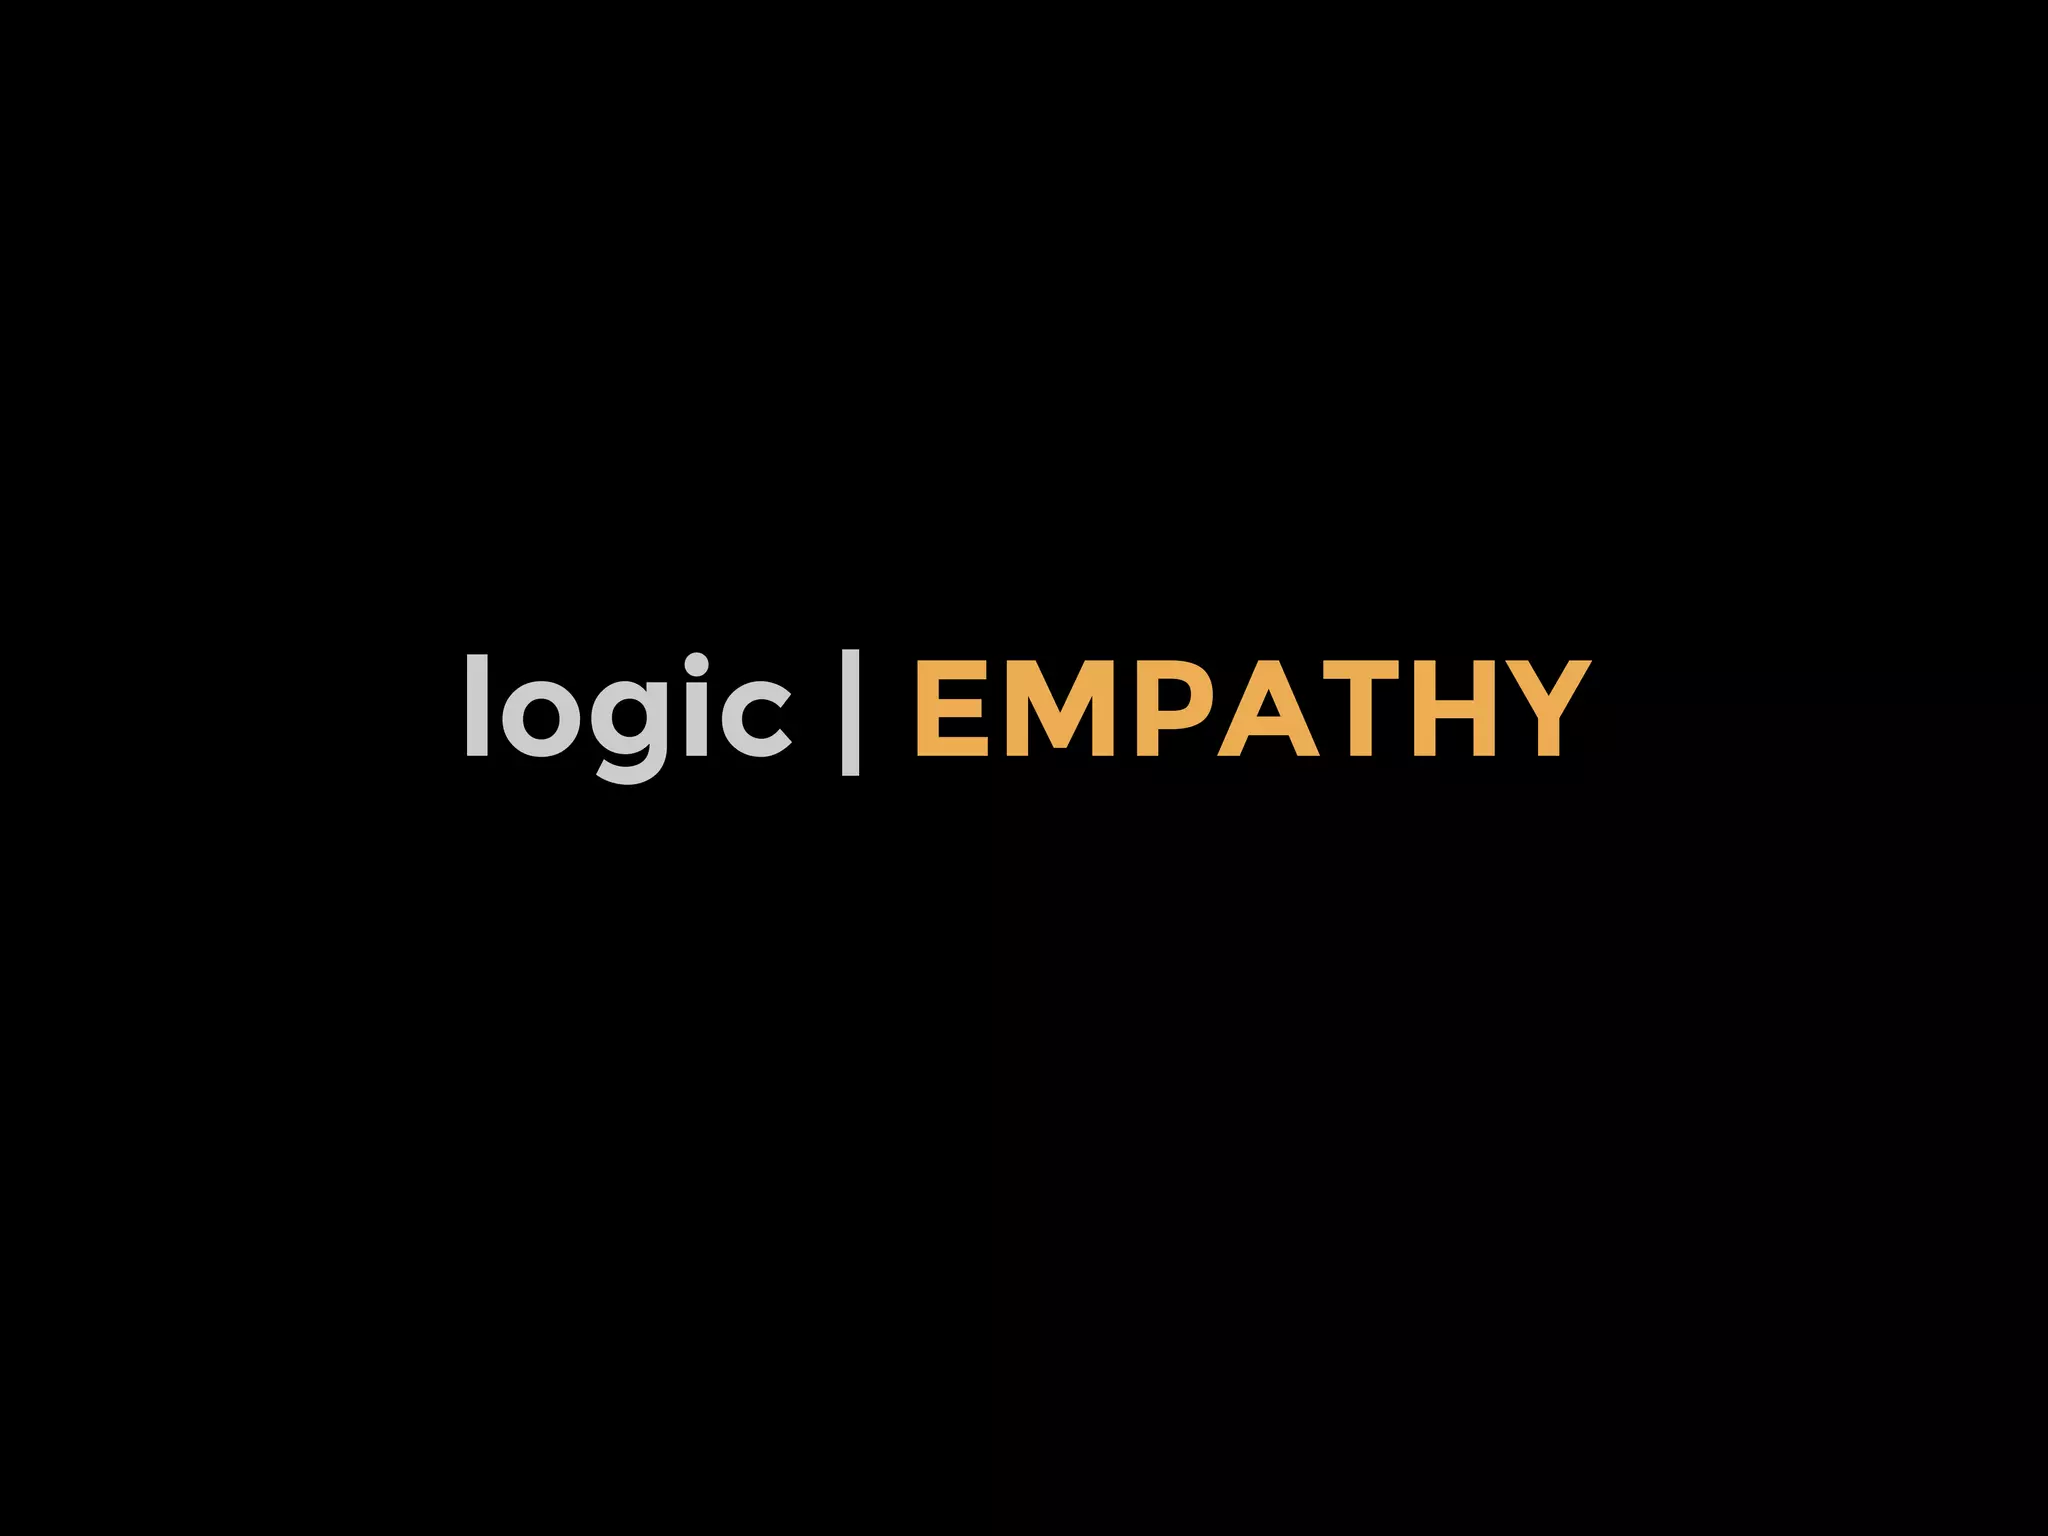
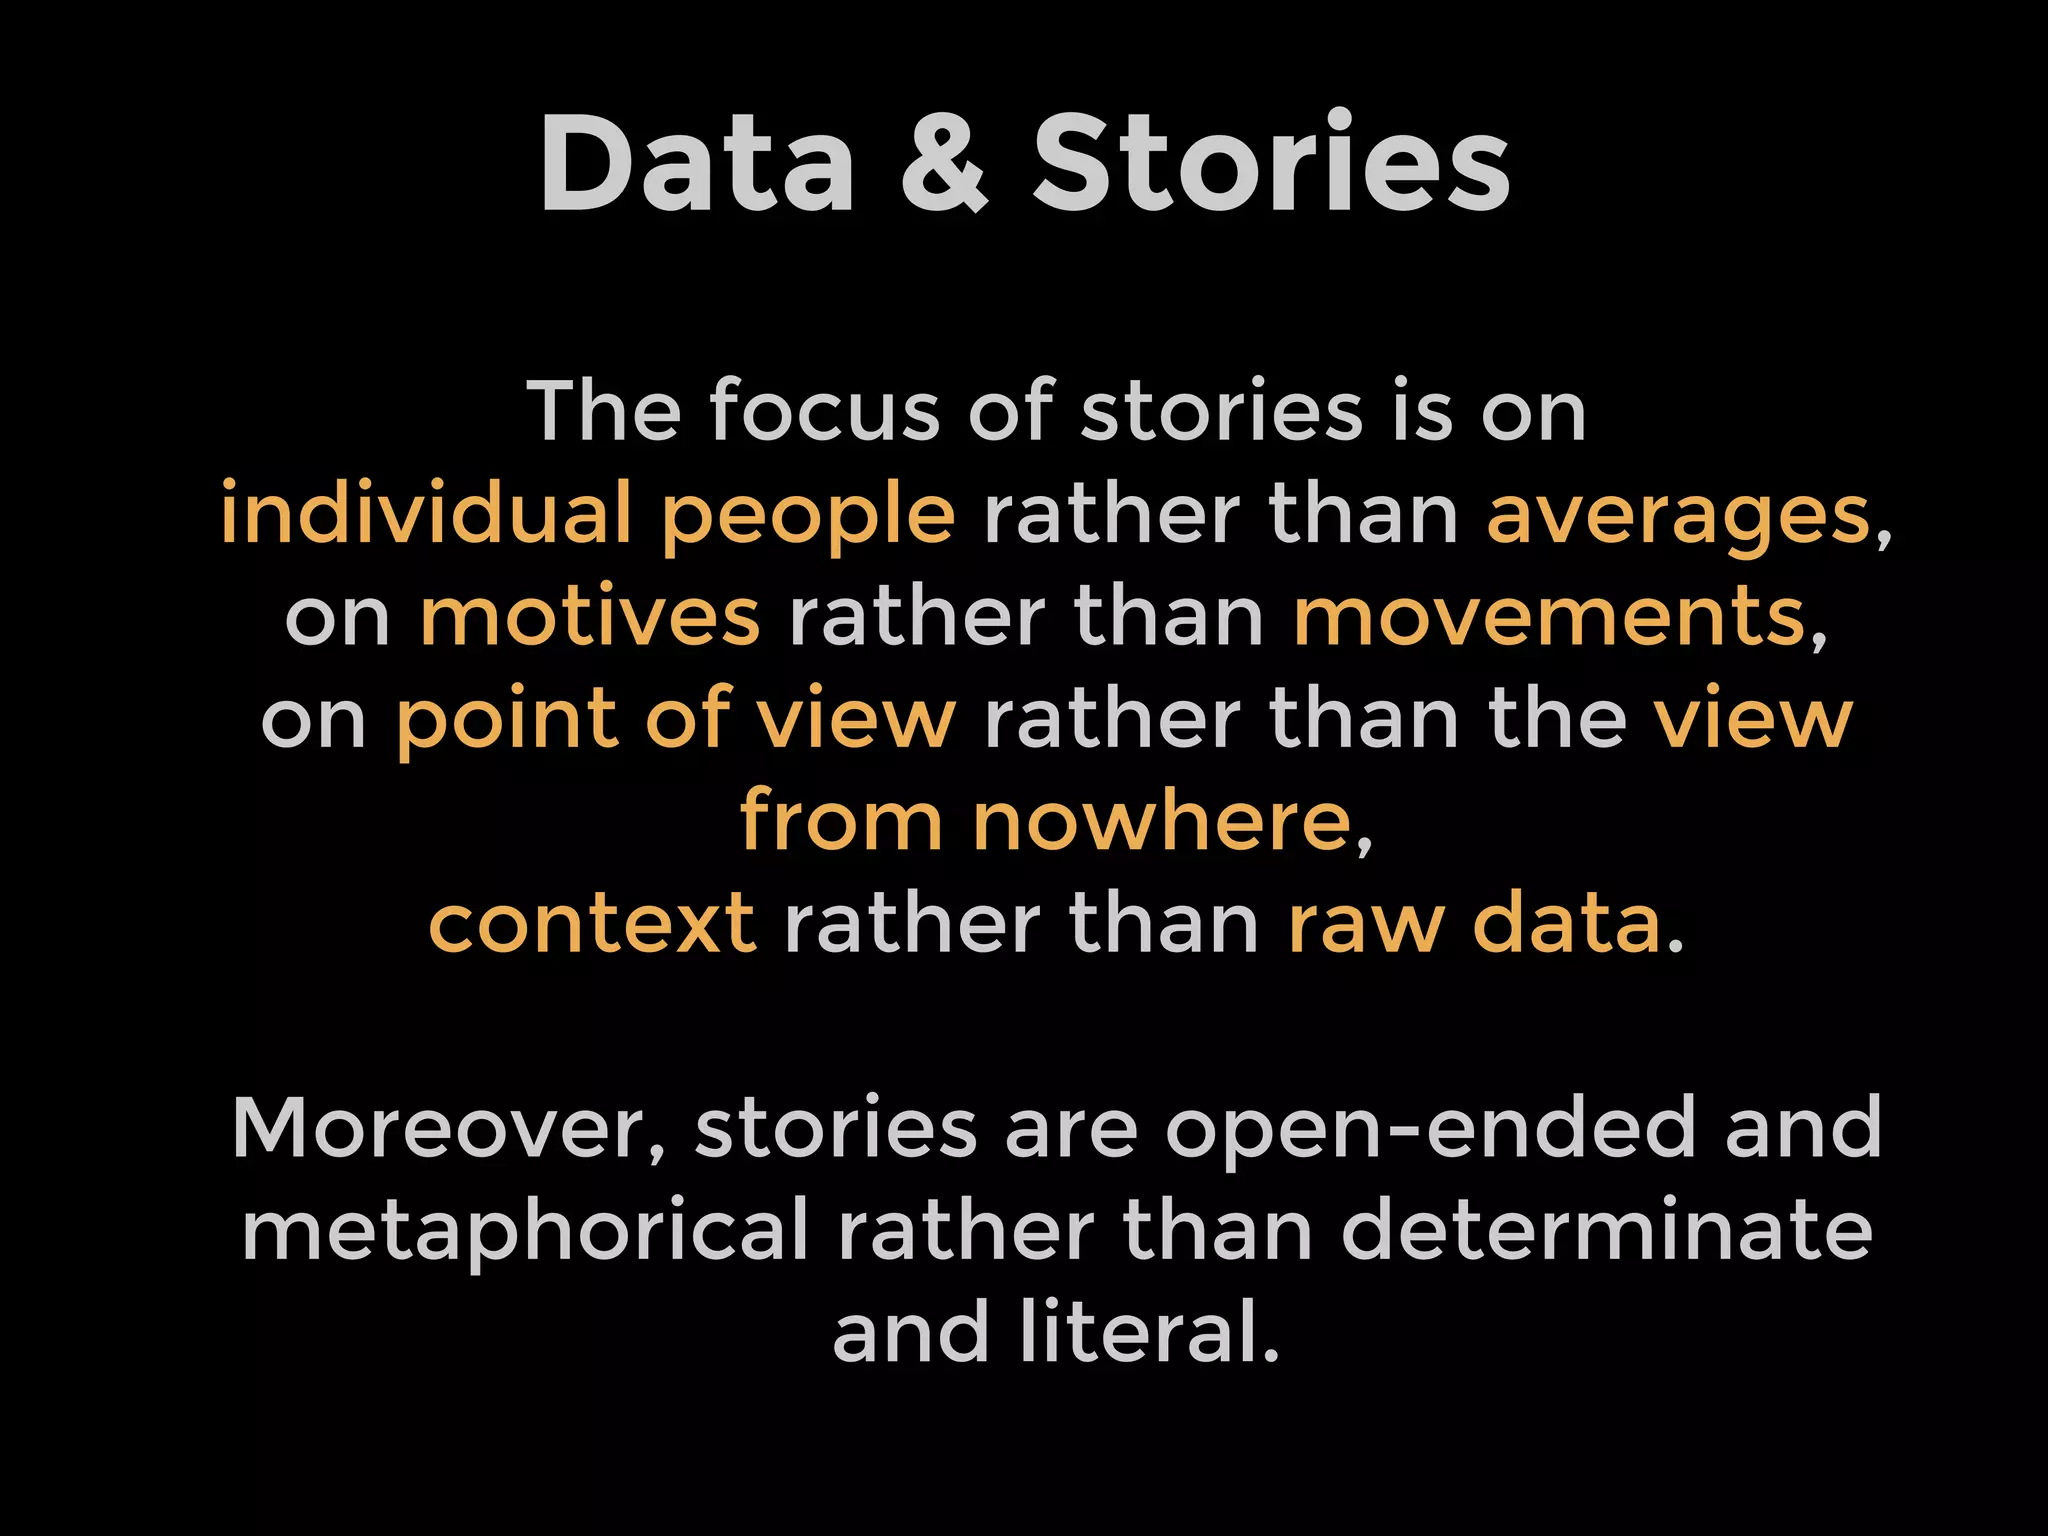
Crafting Visual Stories with Data is a document that discusses how to craft effective data stories. It begins by showing examples of using visualization techniques like proximity, alignment, repetition, and contrast to find patterns in data. It then discusses how stories are more impactful than just presenting raw data because they allow for emotion and empathy. The document outlines different types of visualizations like exhibition, exploration, and explanatory and provides examples of each. It also discusses how stories work by transferring imagery from the storyteller to the listener. The main sections cover how to see patterns in data, show the data visually, tell the story, and engage the audience. It emphasizes establishing focus, integrating text and graphics, using narrative structure and point of view to


![[AWSマイスターシリーズ] Amazon ElastiCache](https://cdn.slidesharecdn.com/ss_thumbnails/20131030aws-meister-regenerate-elasticache-131101003447-phpapp02-thumbnail.jpg?width=640&height=640&fit=bounds)


![[20220126] JAWS-UG 2022初頭までに葬ったAWSアンチパターン大紹介](https://cdn.slidesharecdn.com/ss_thumbnails/20220126-anti-220126190603-thumbnail.jpg?width=640&height=640&fit=bounds)
![[AKIBA.AWS] VPN接続とルーティングの基礎](https://cdn.slidesharecdn.com/ss_thumbnails/akibaaws6vpn-180510092054-thumbnail.jpg?width=640&height=640&fit=bounds)