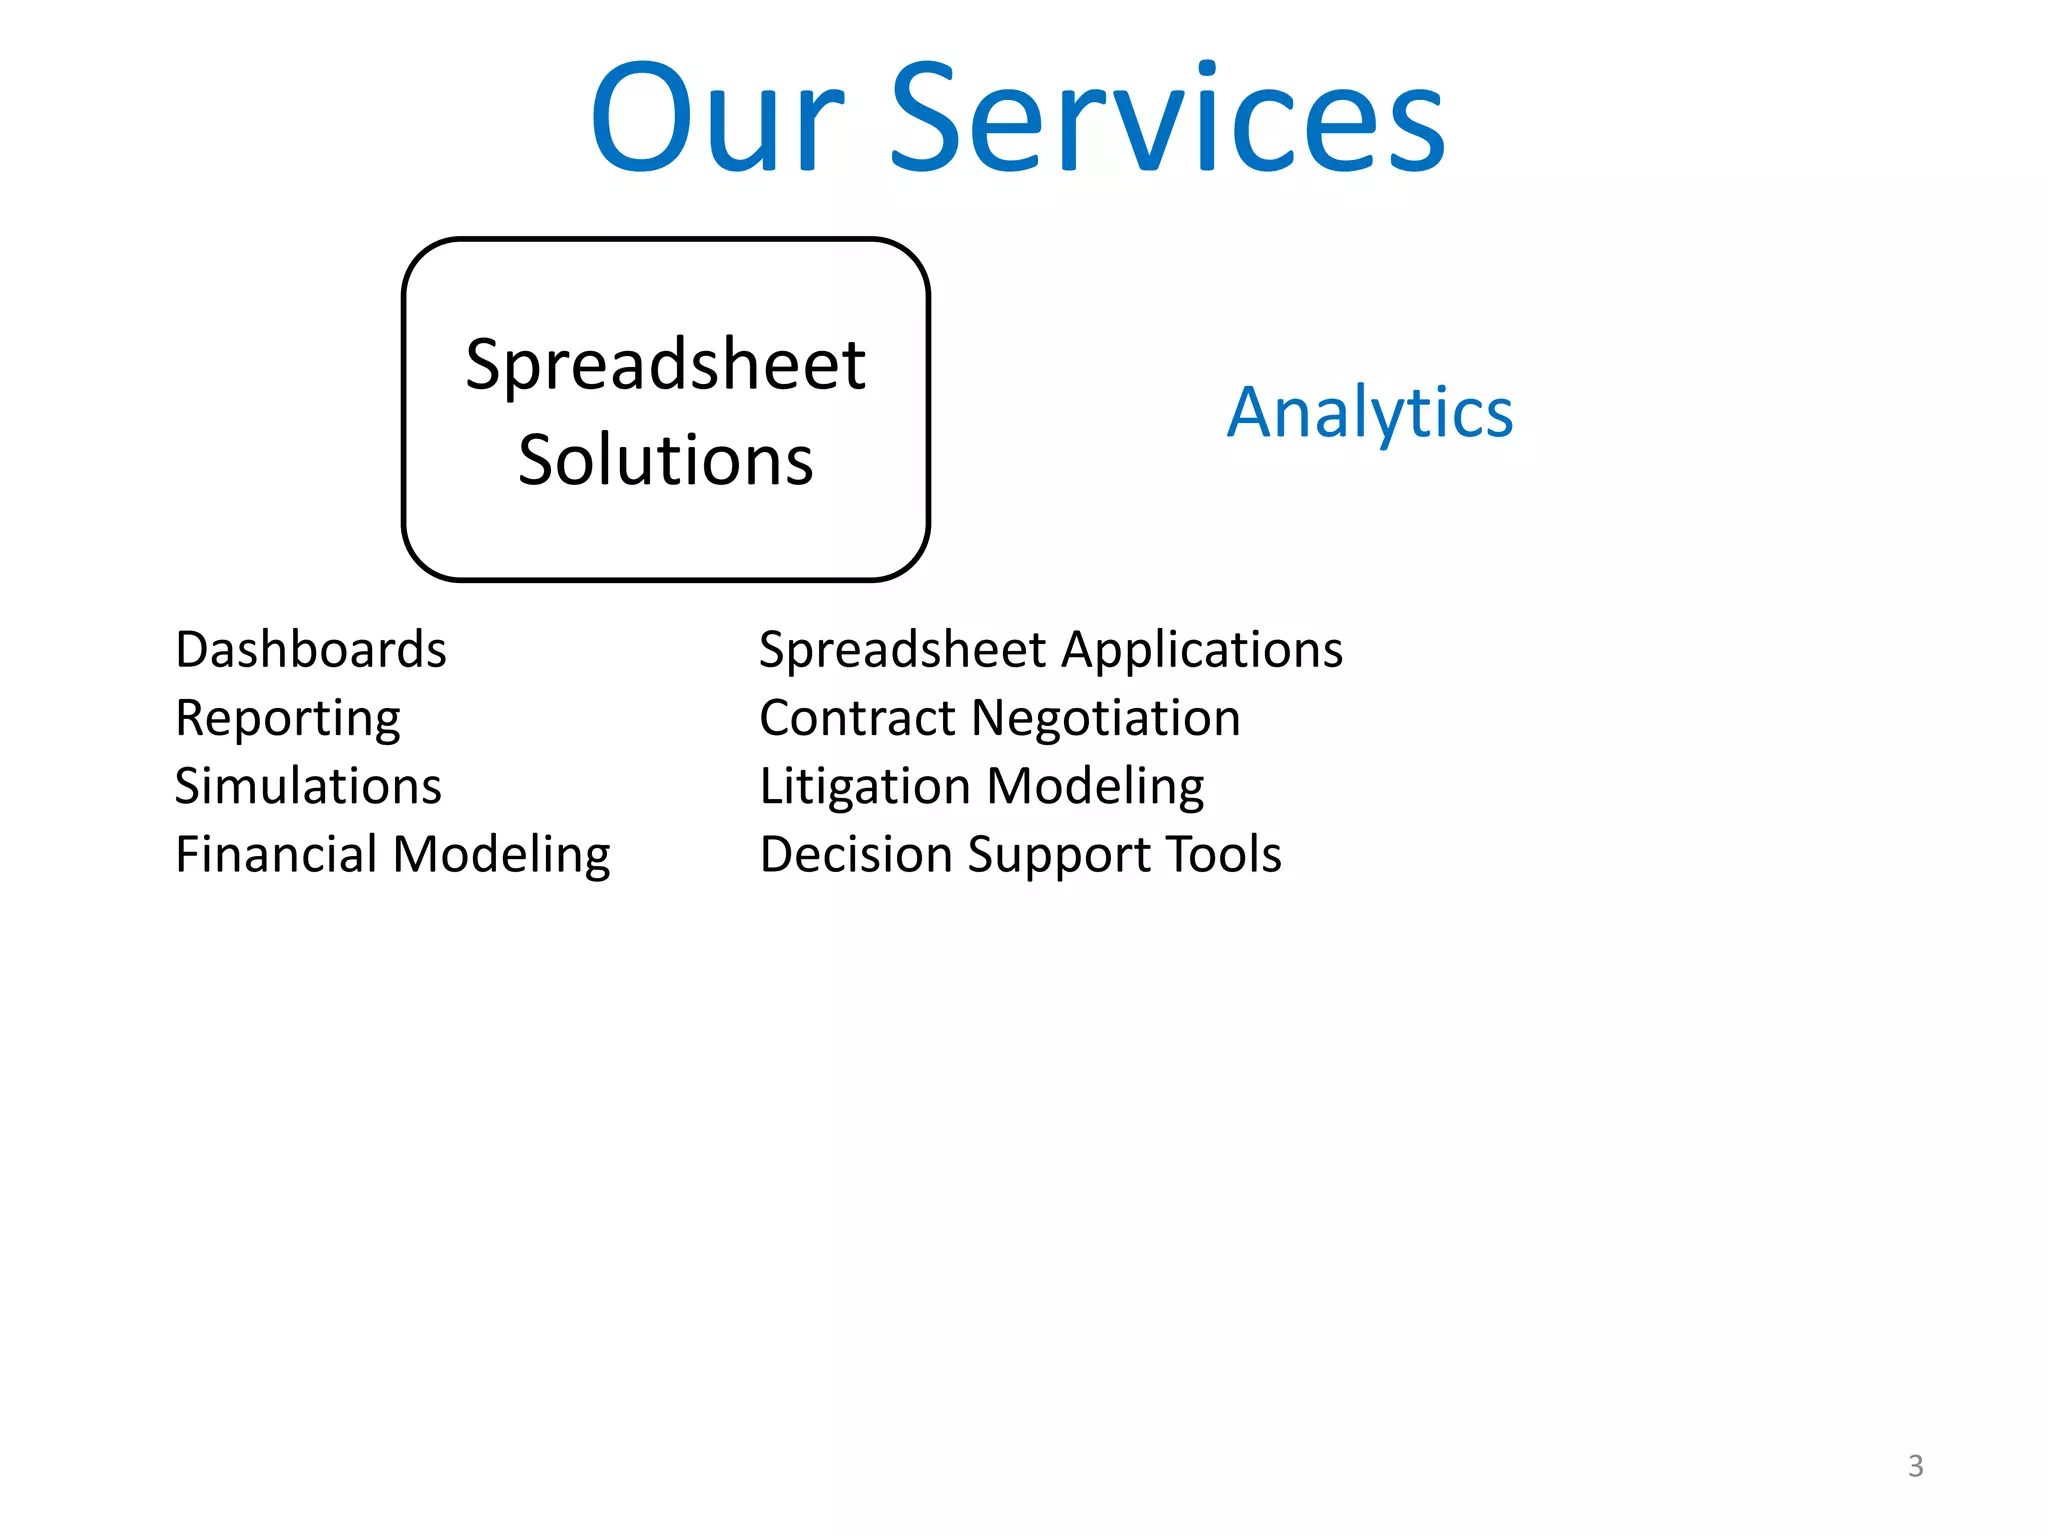
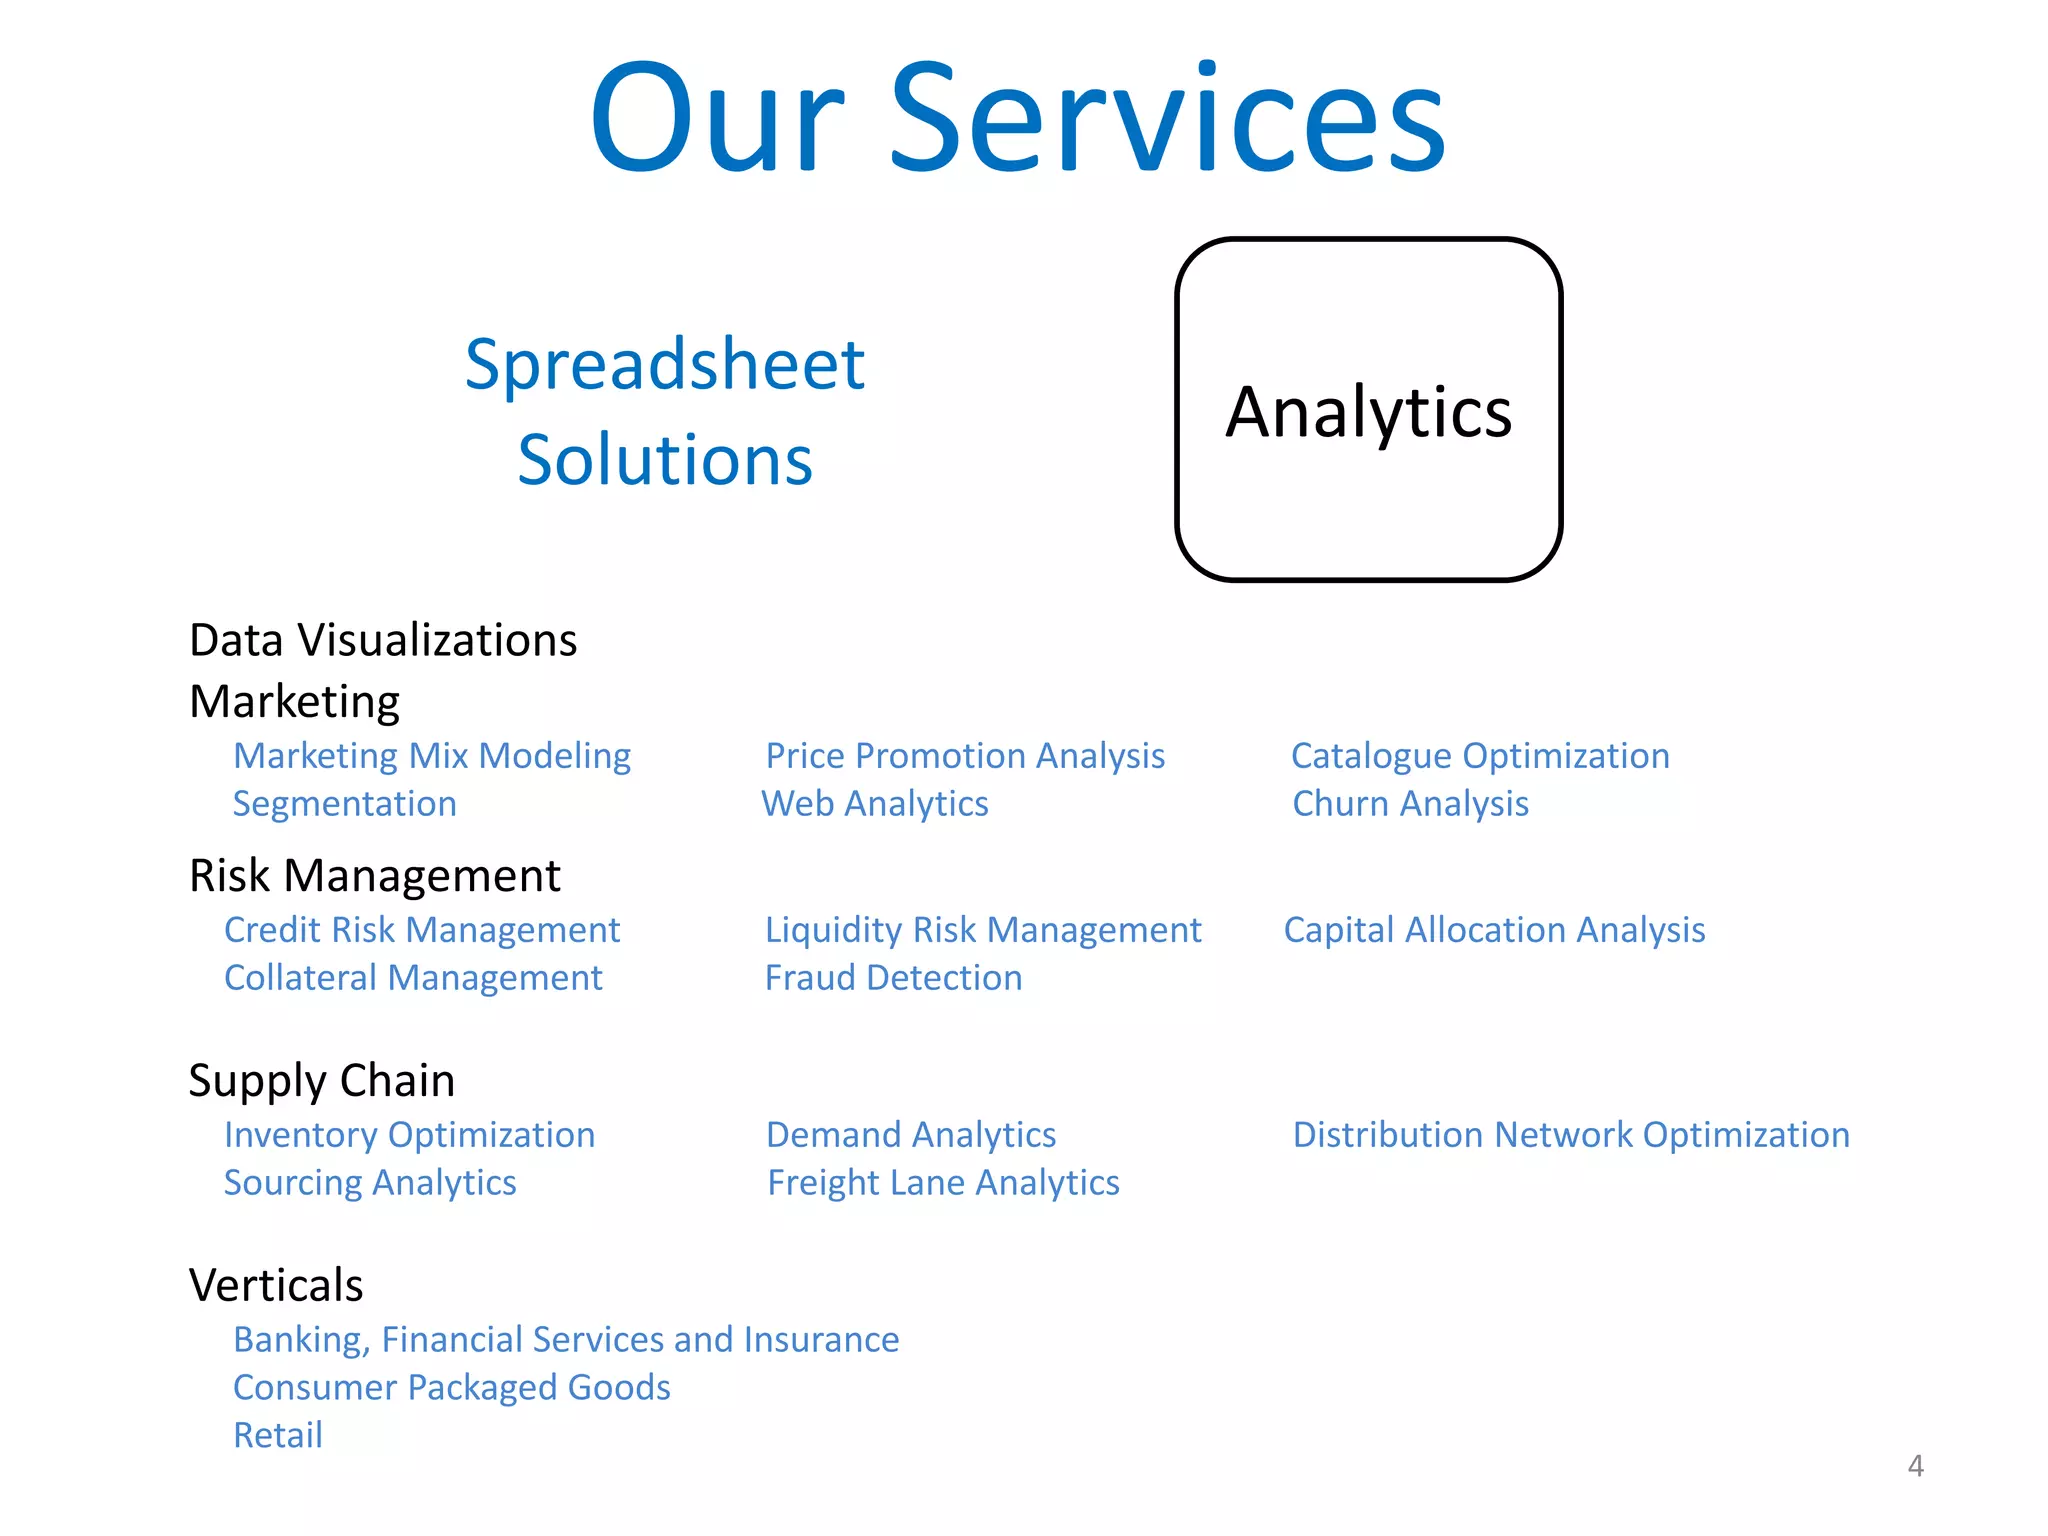
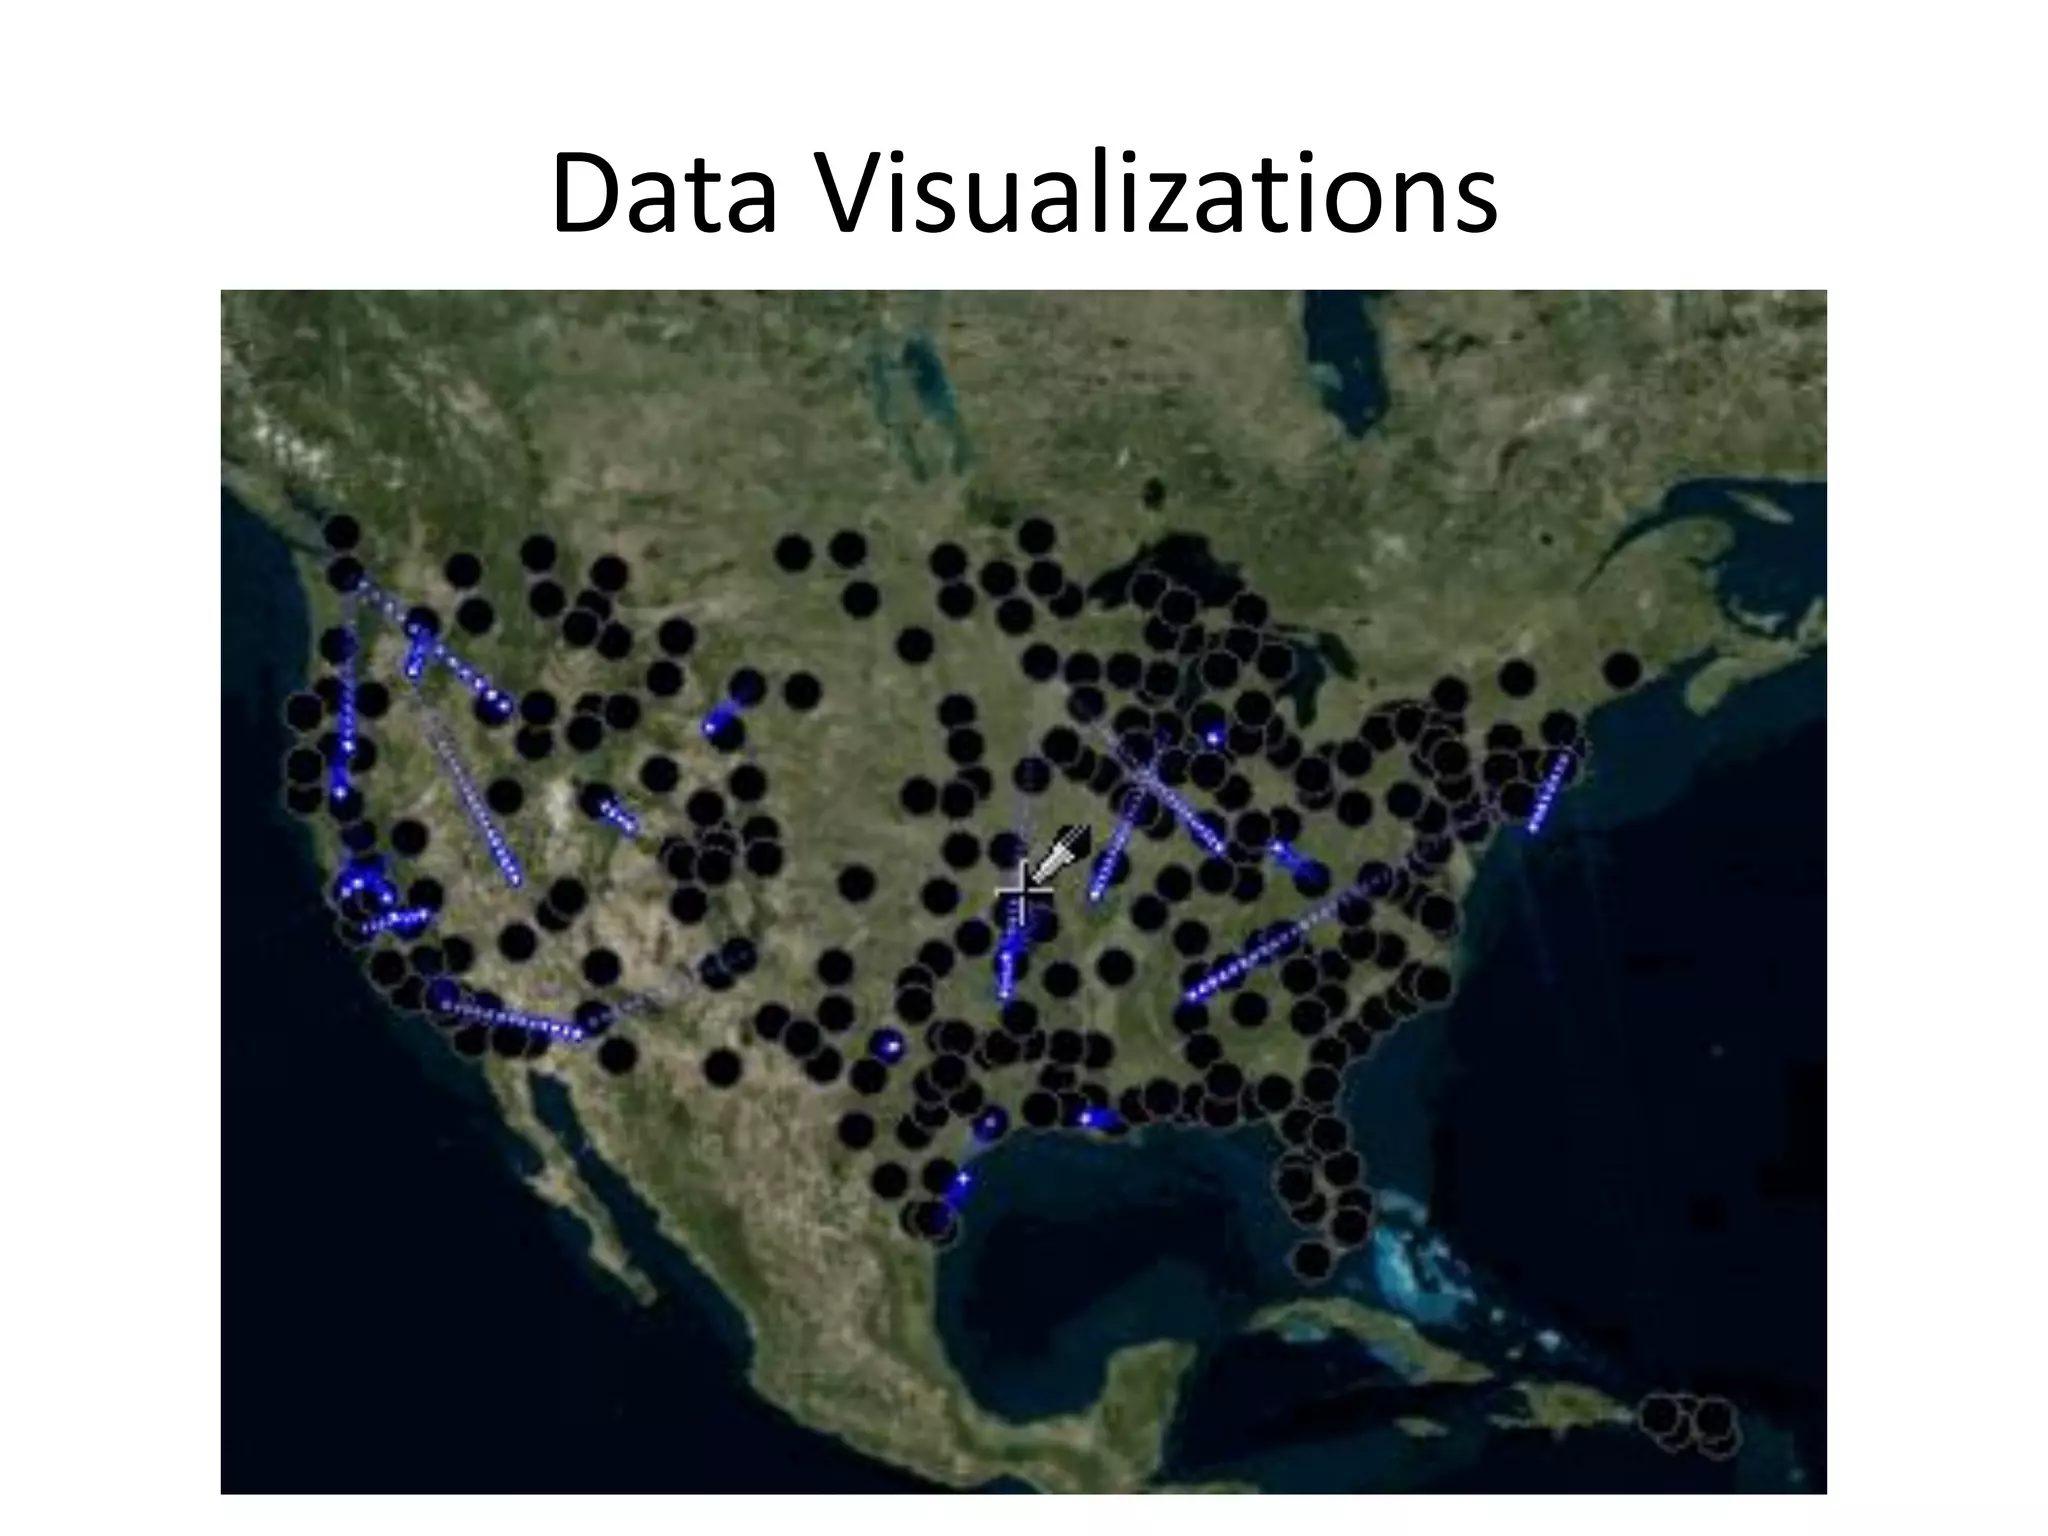
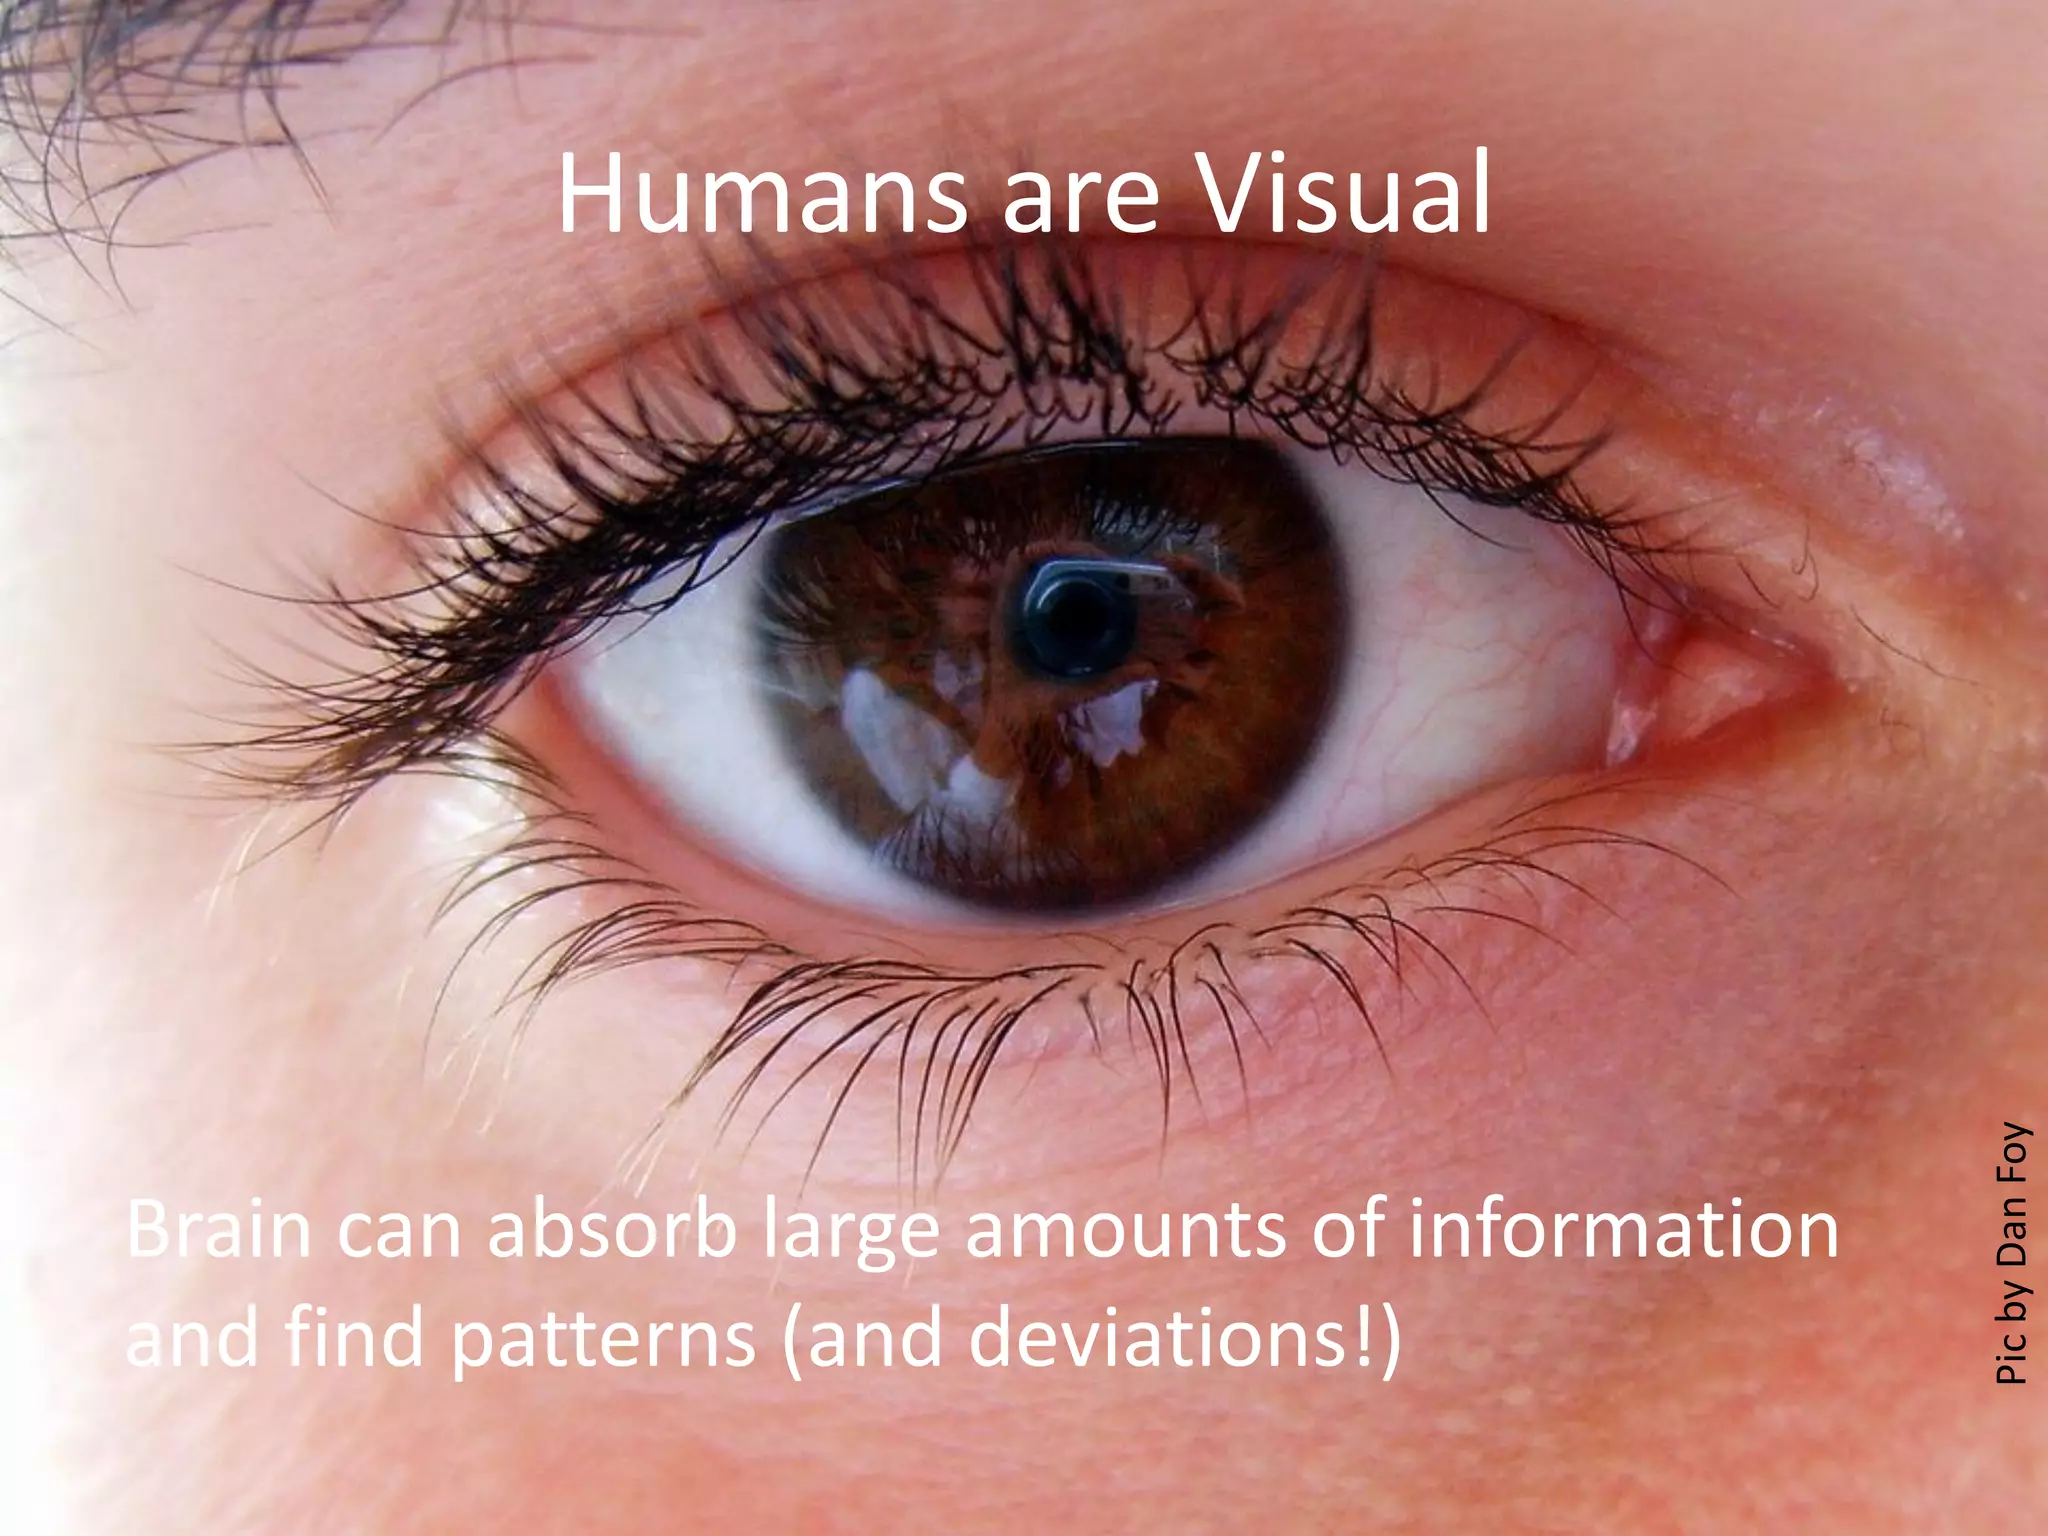
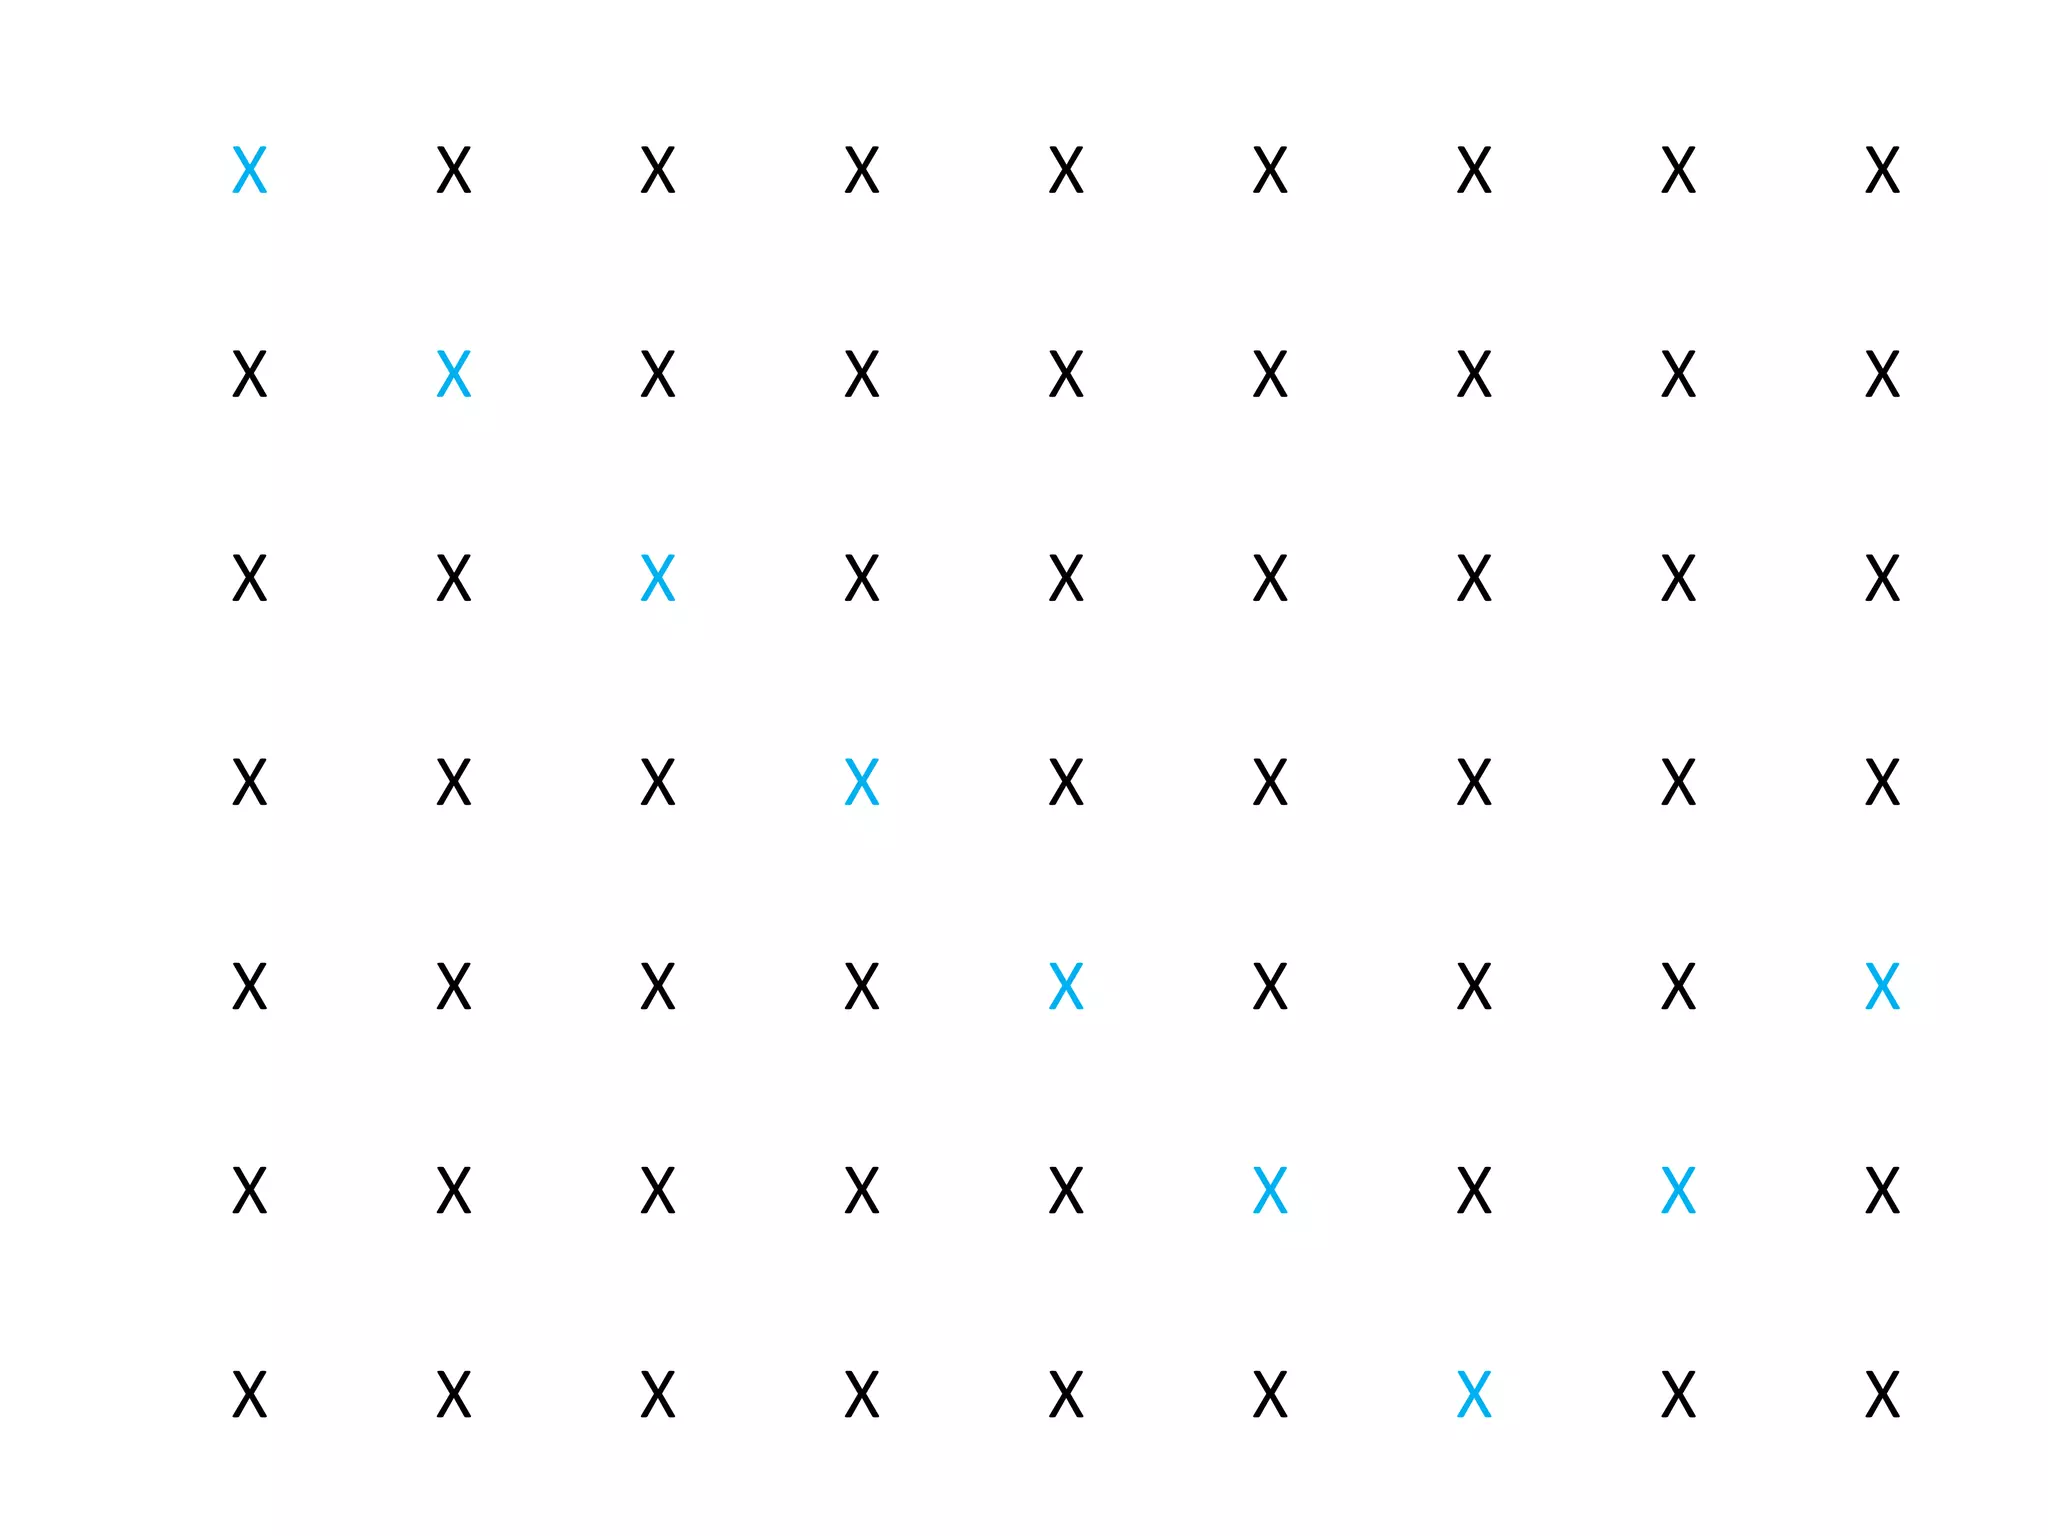
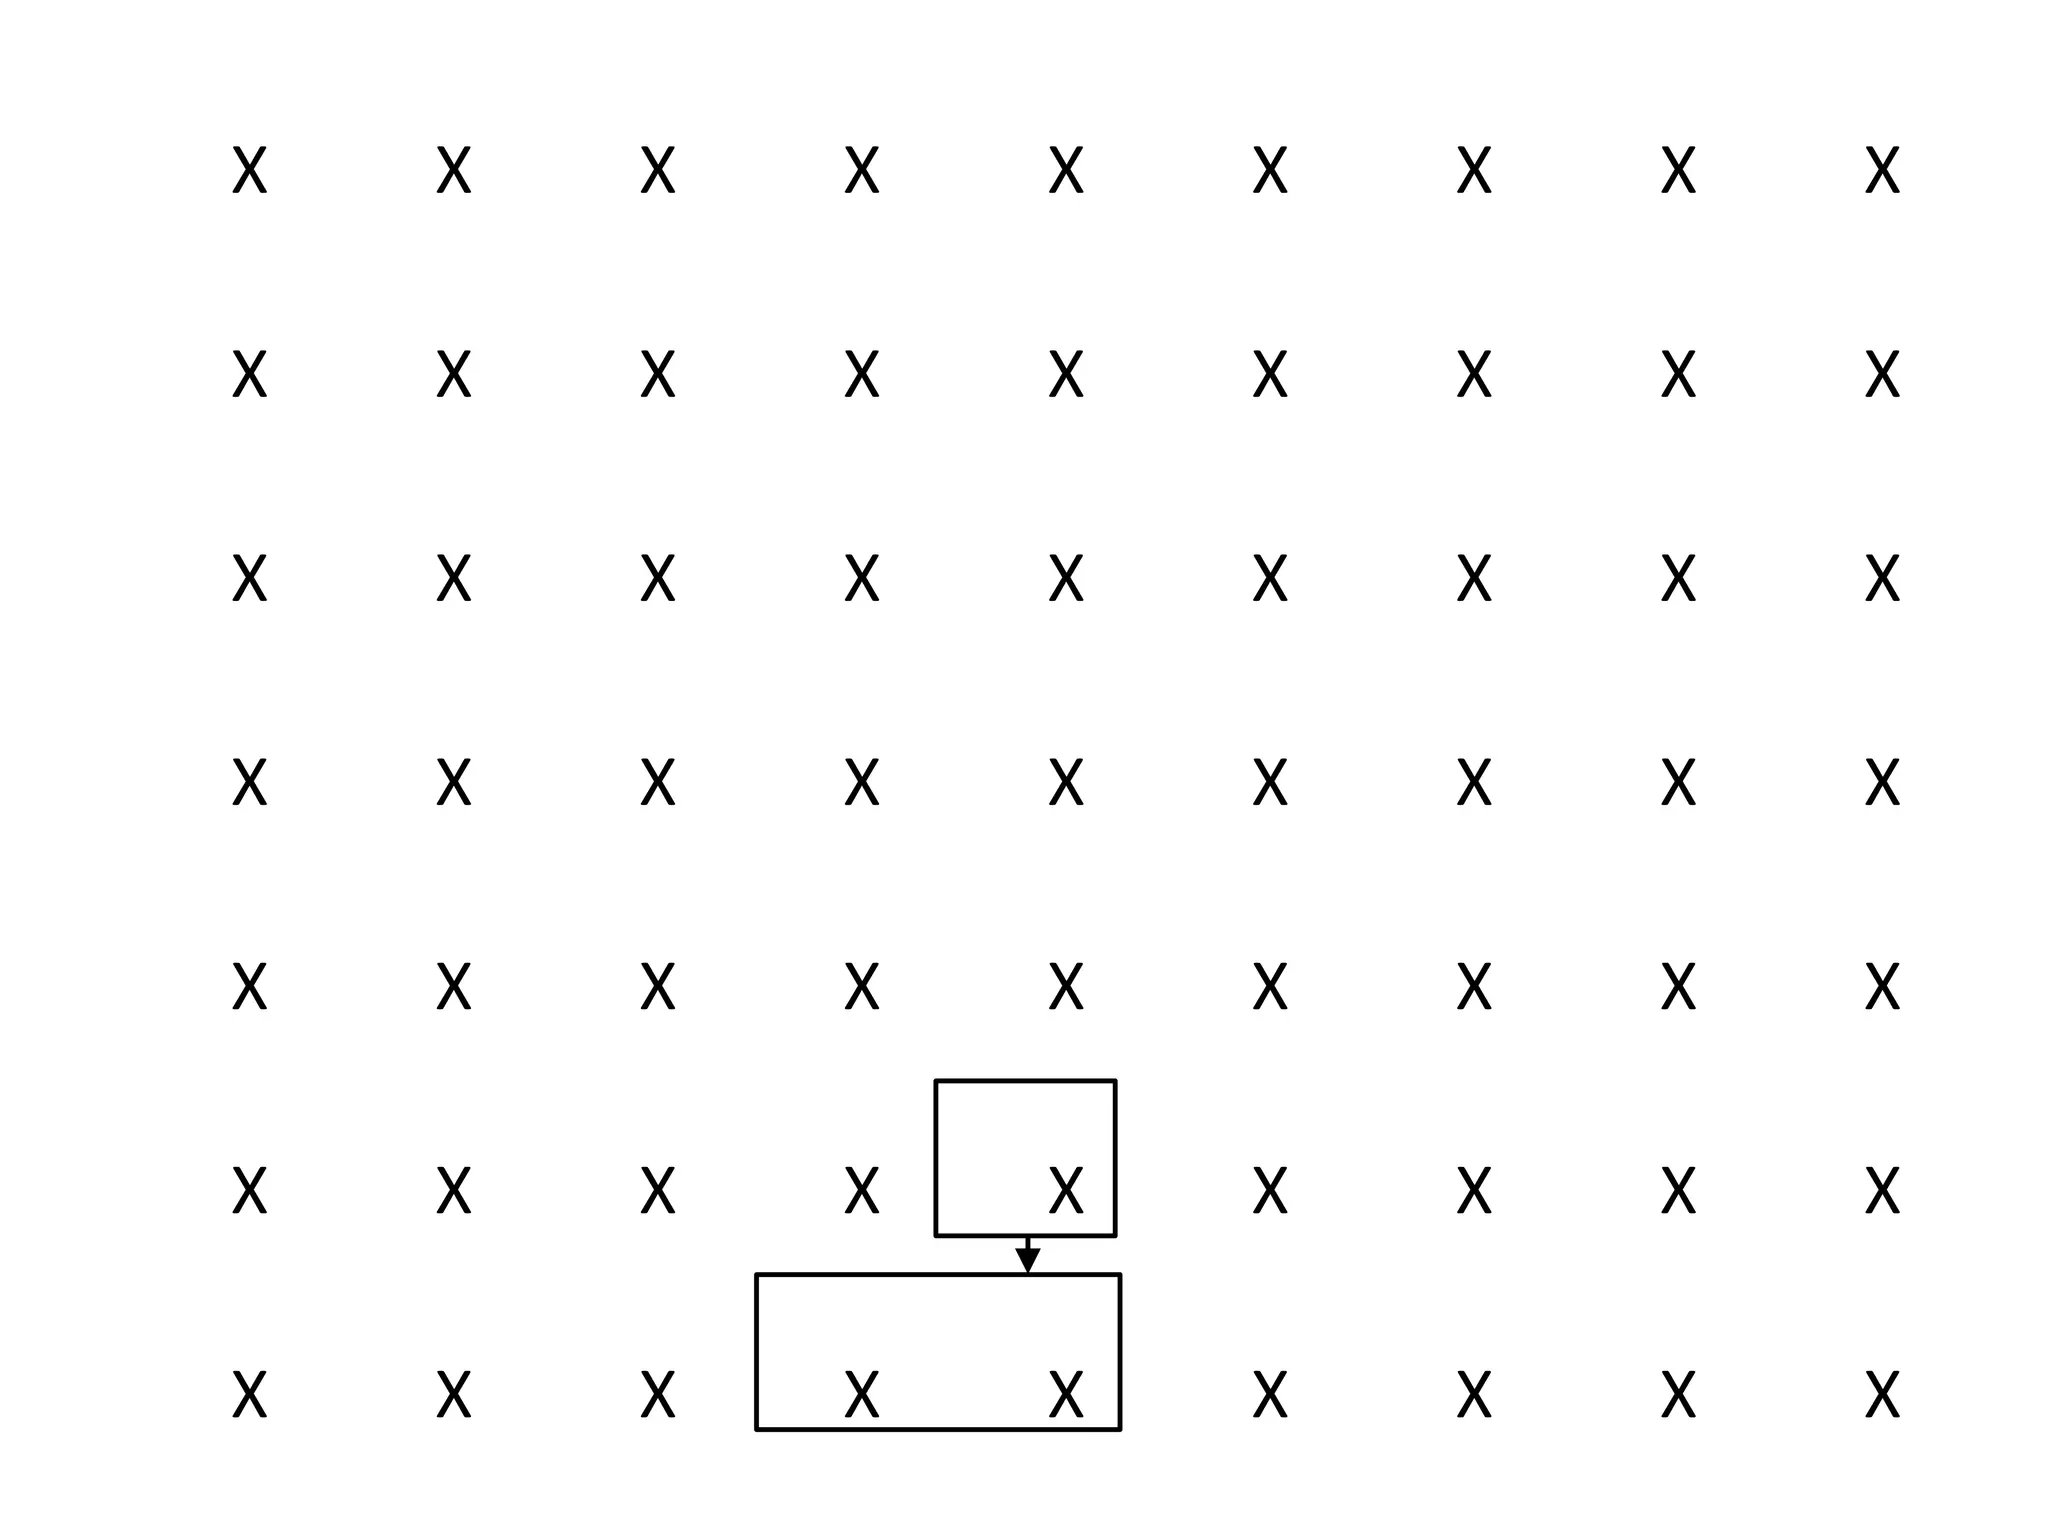
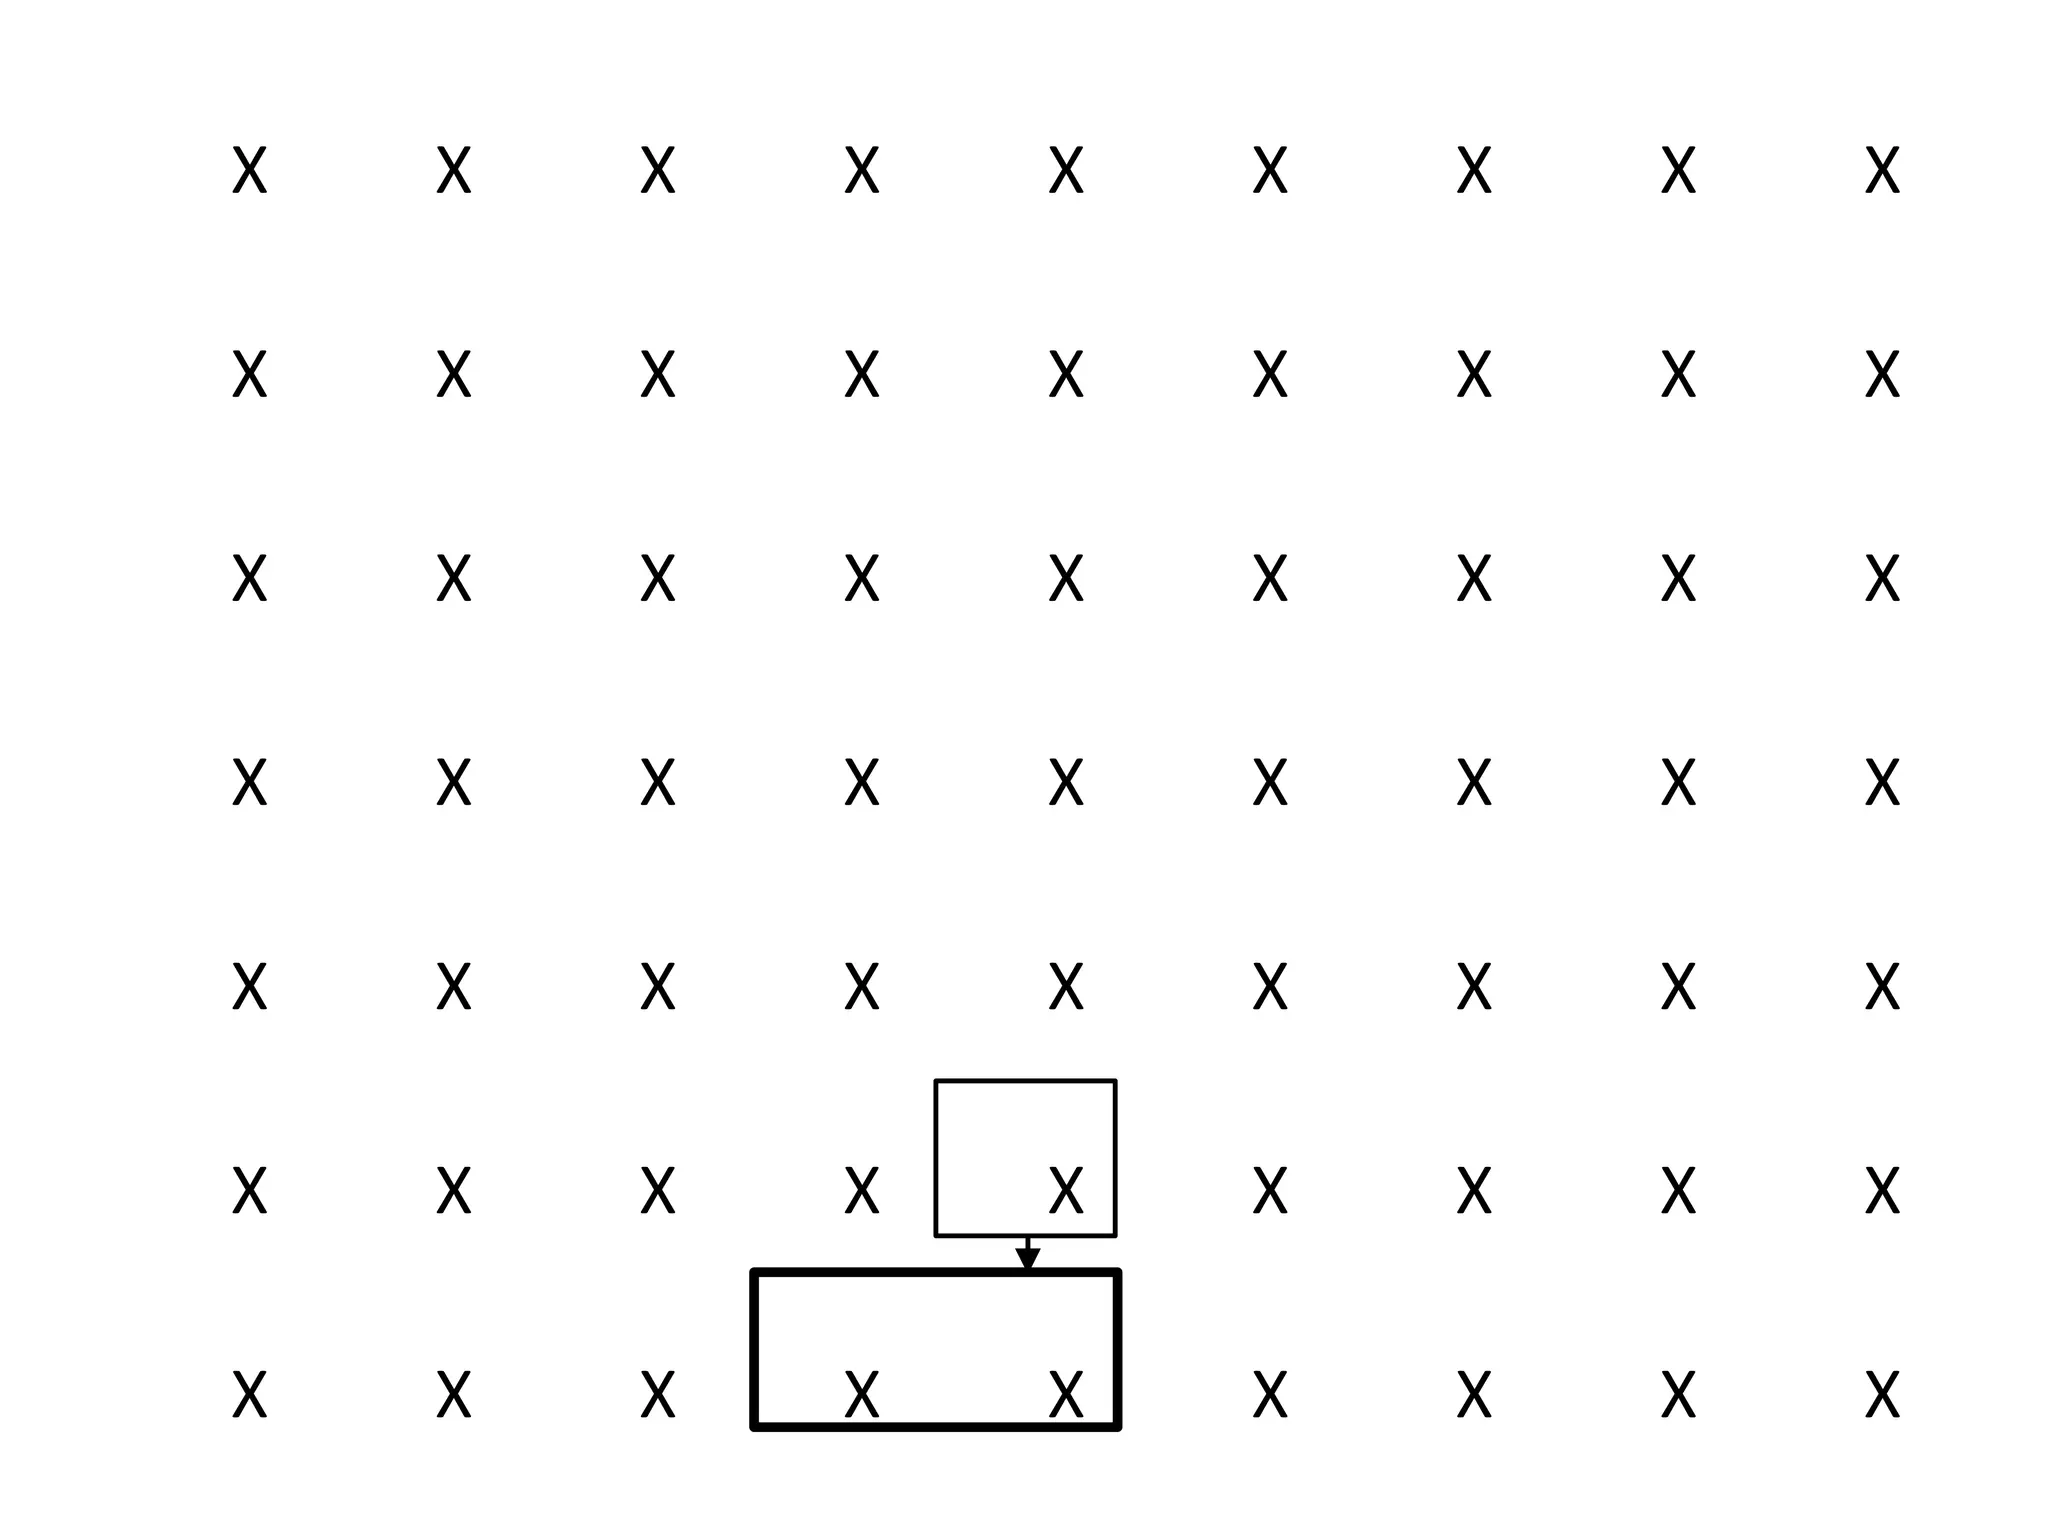
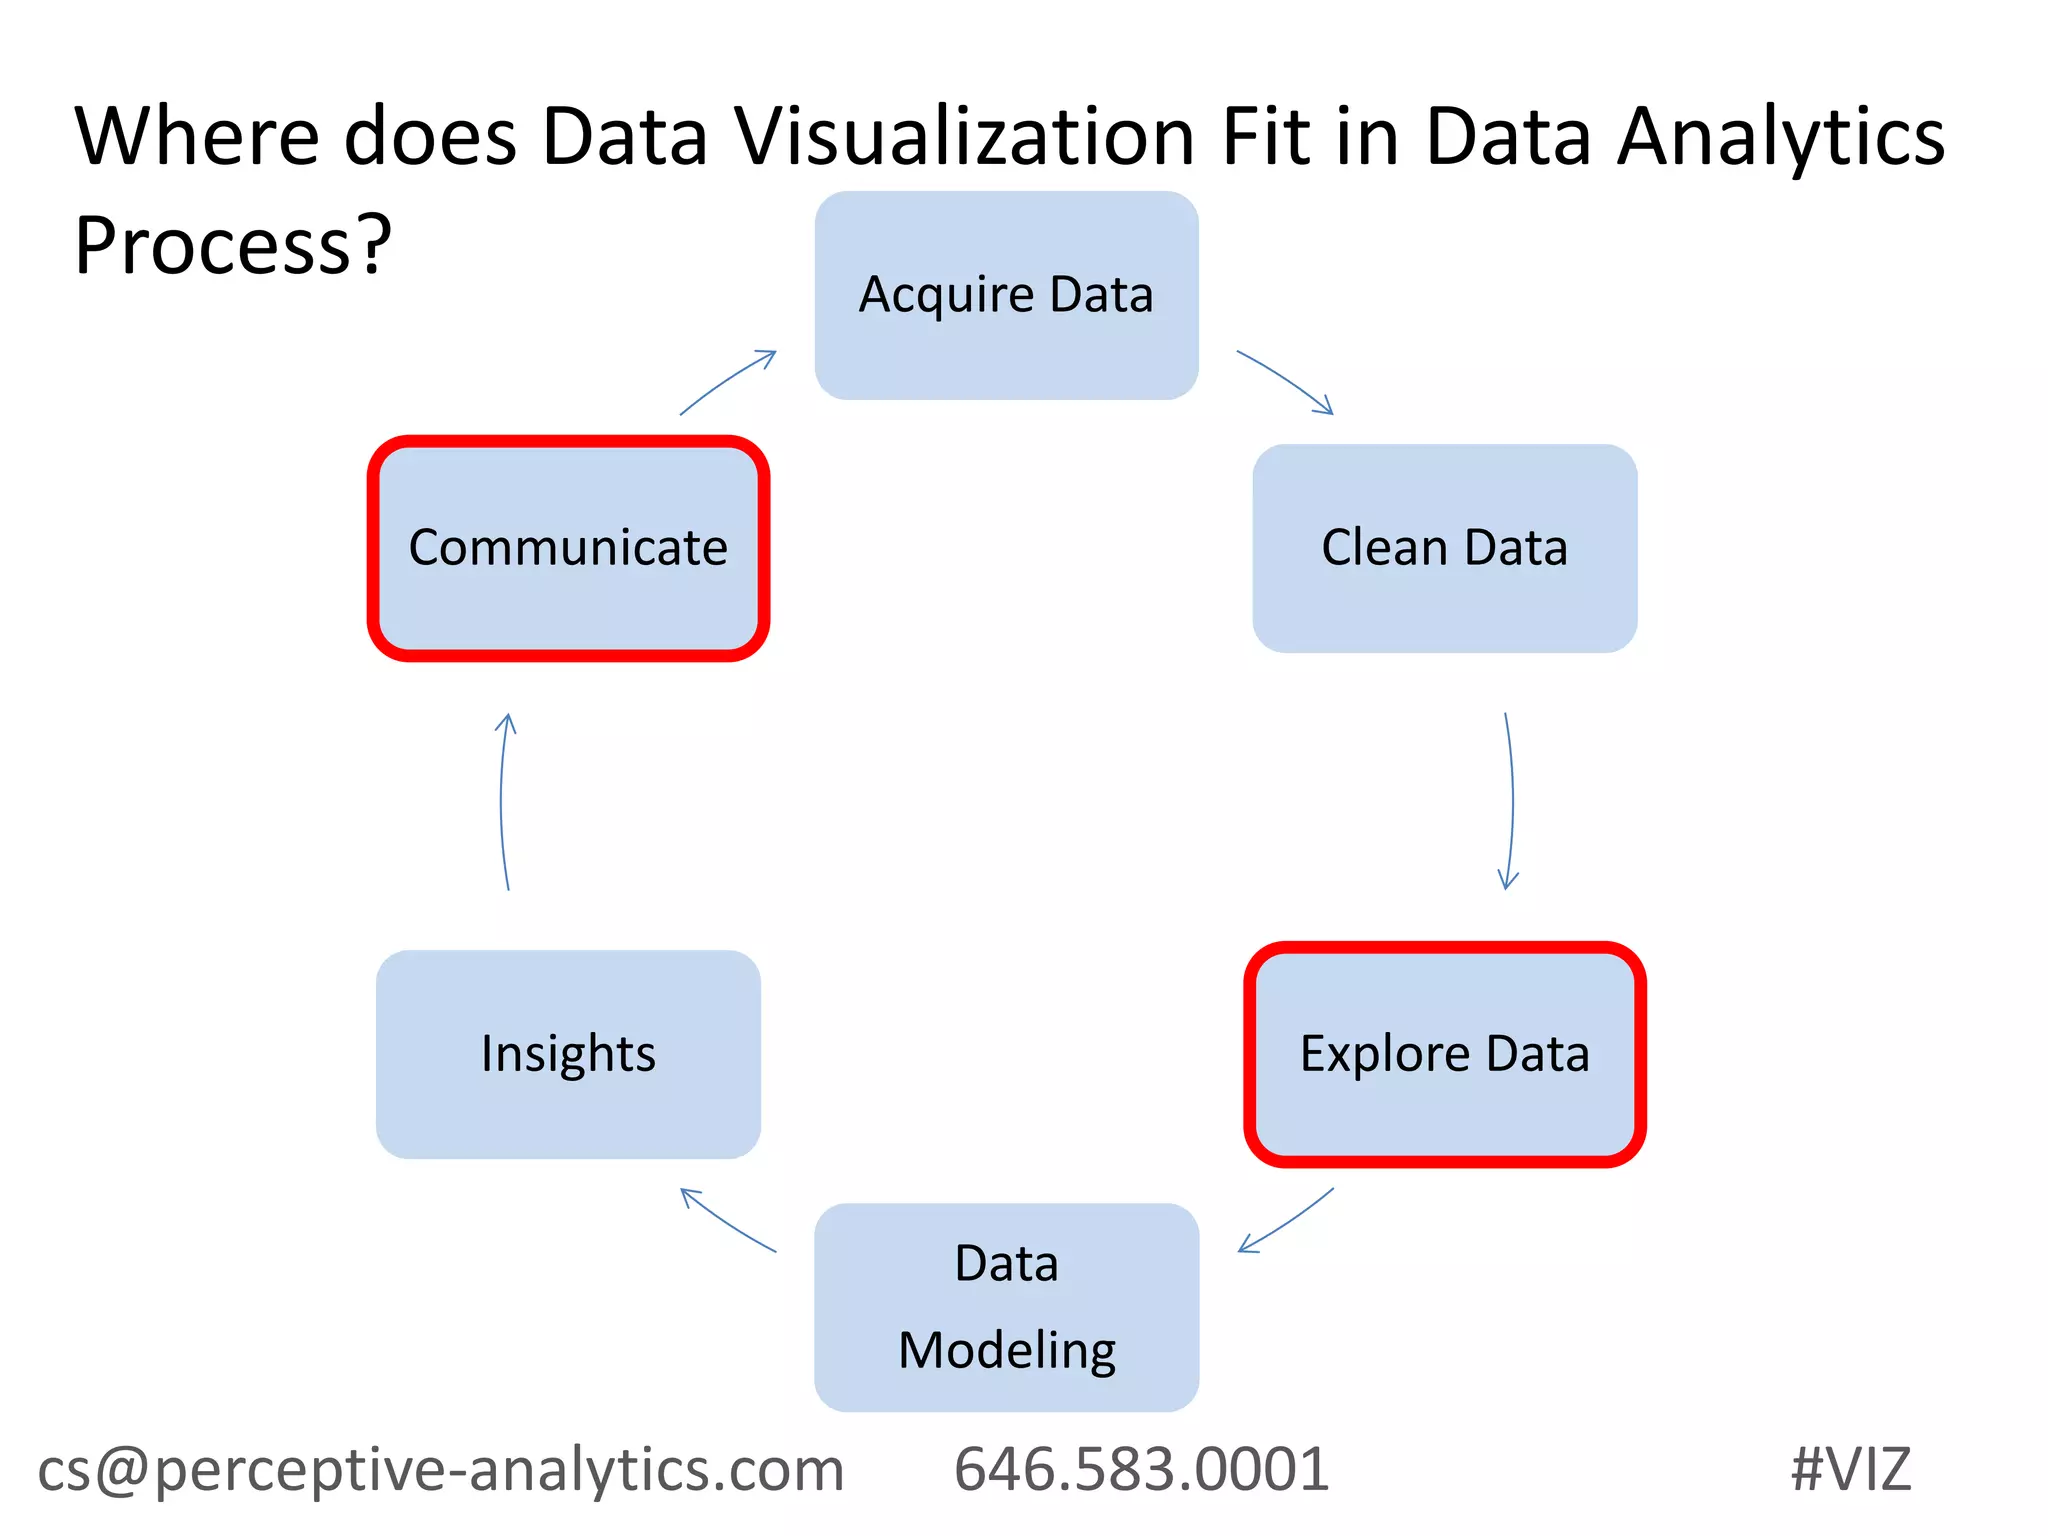
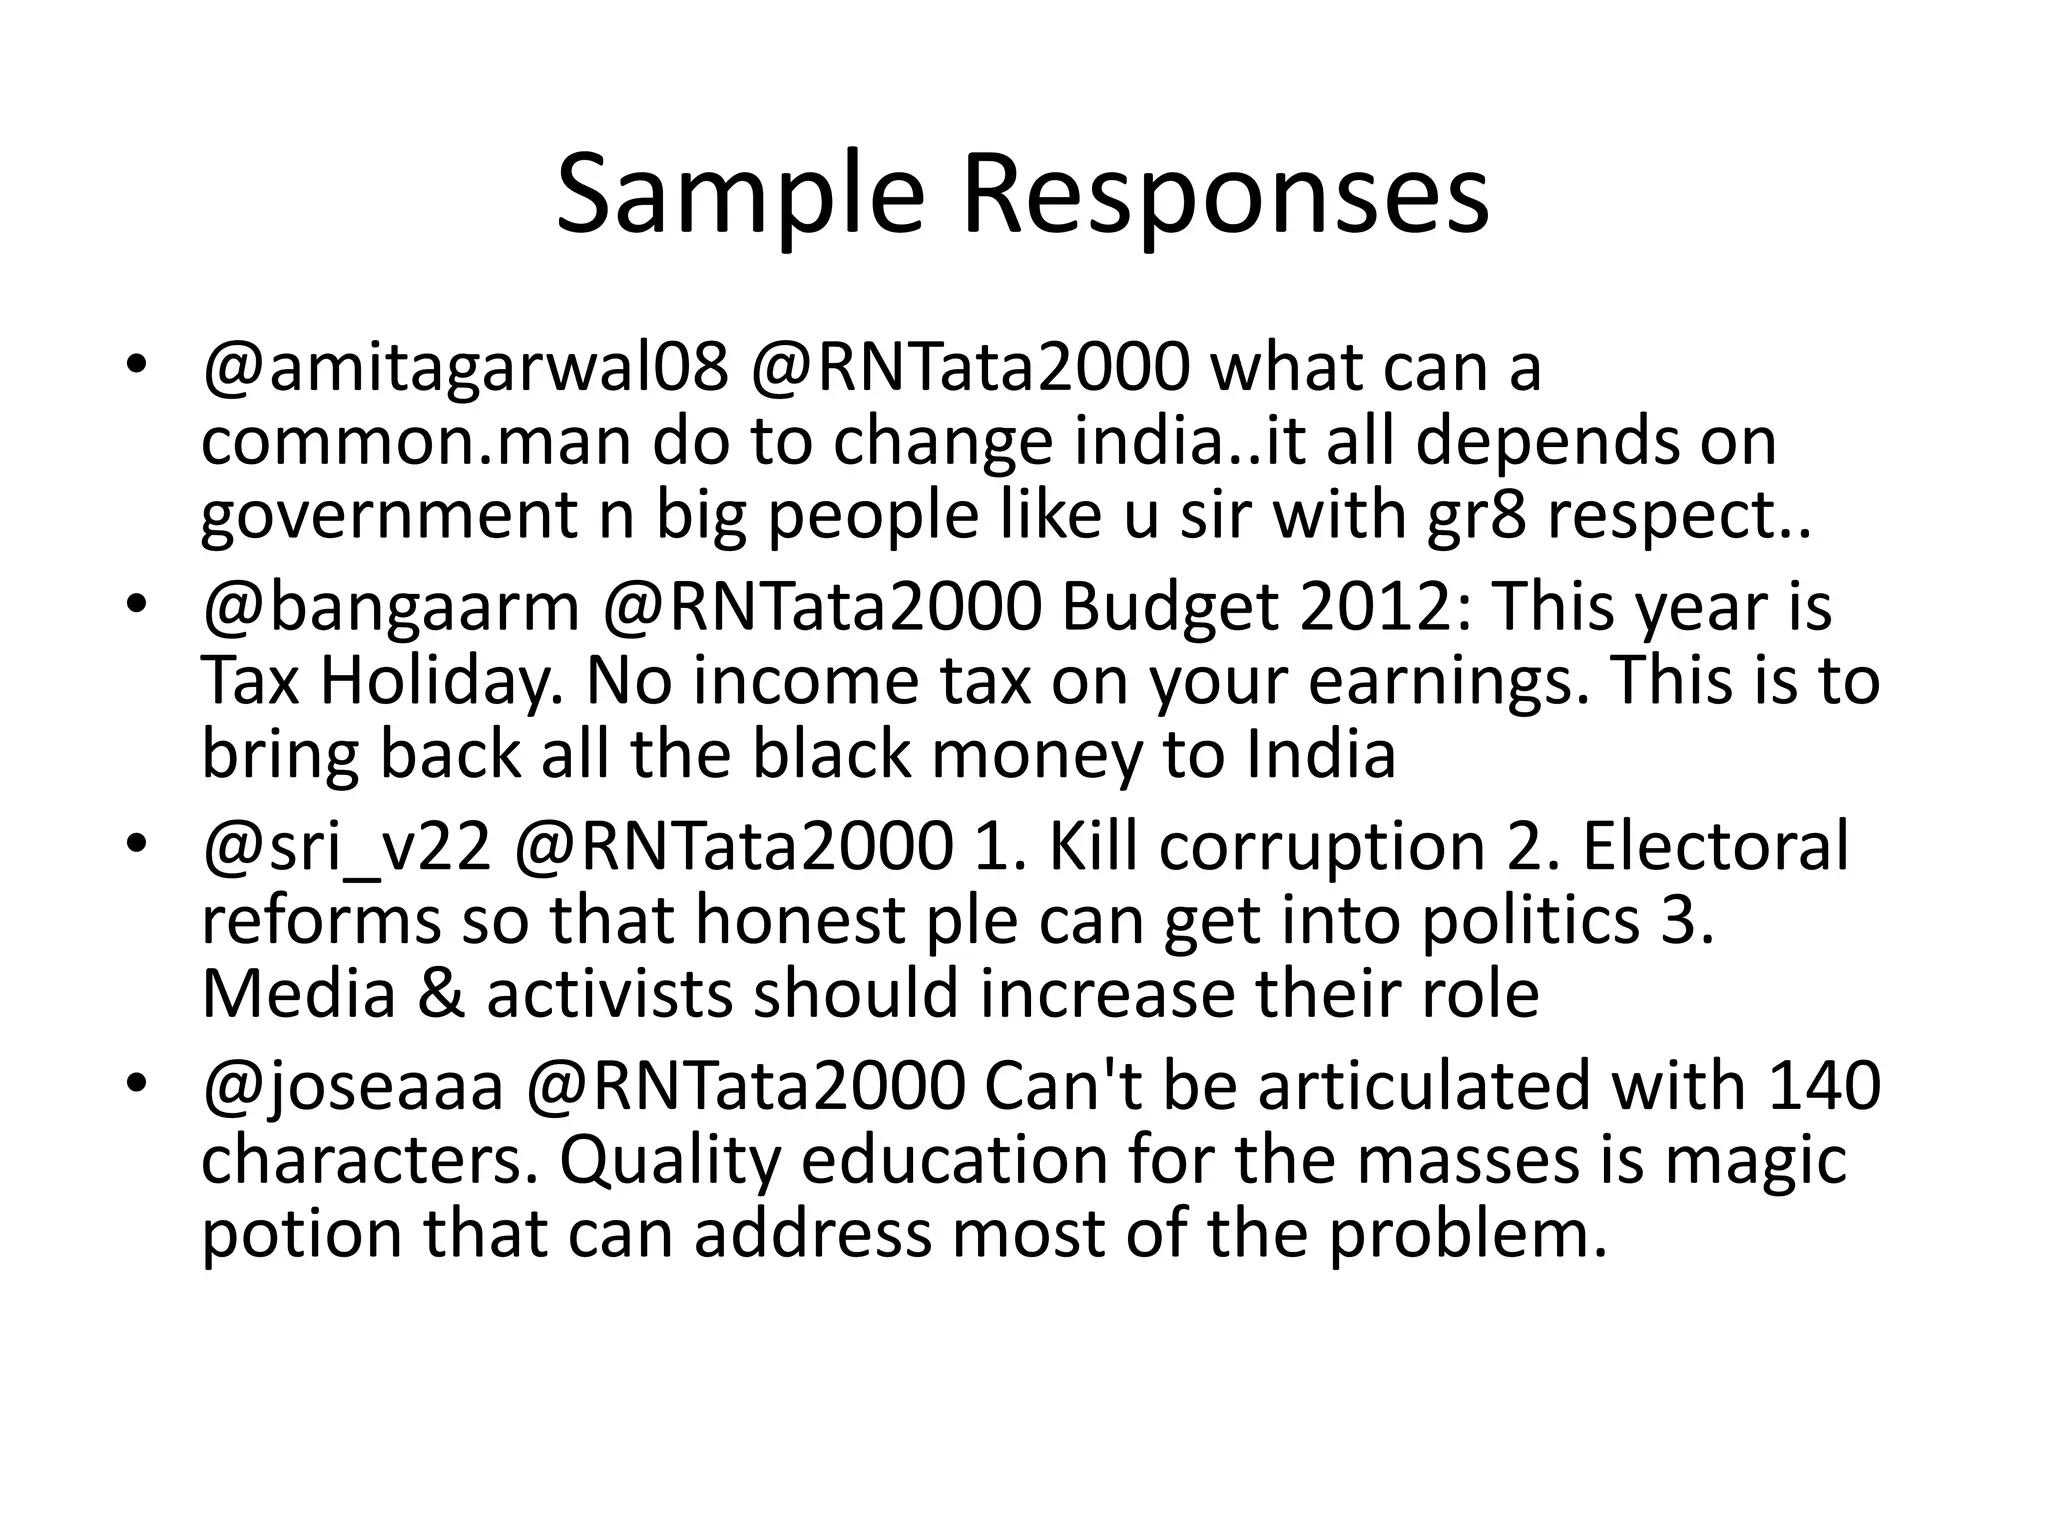
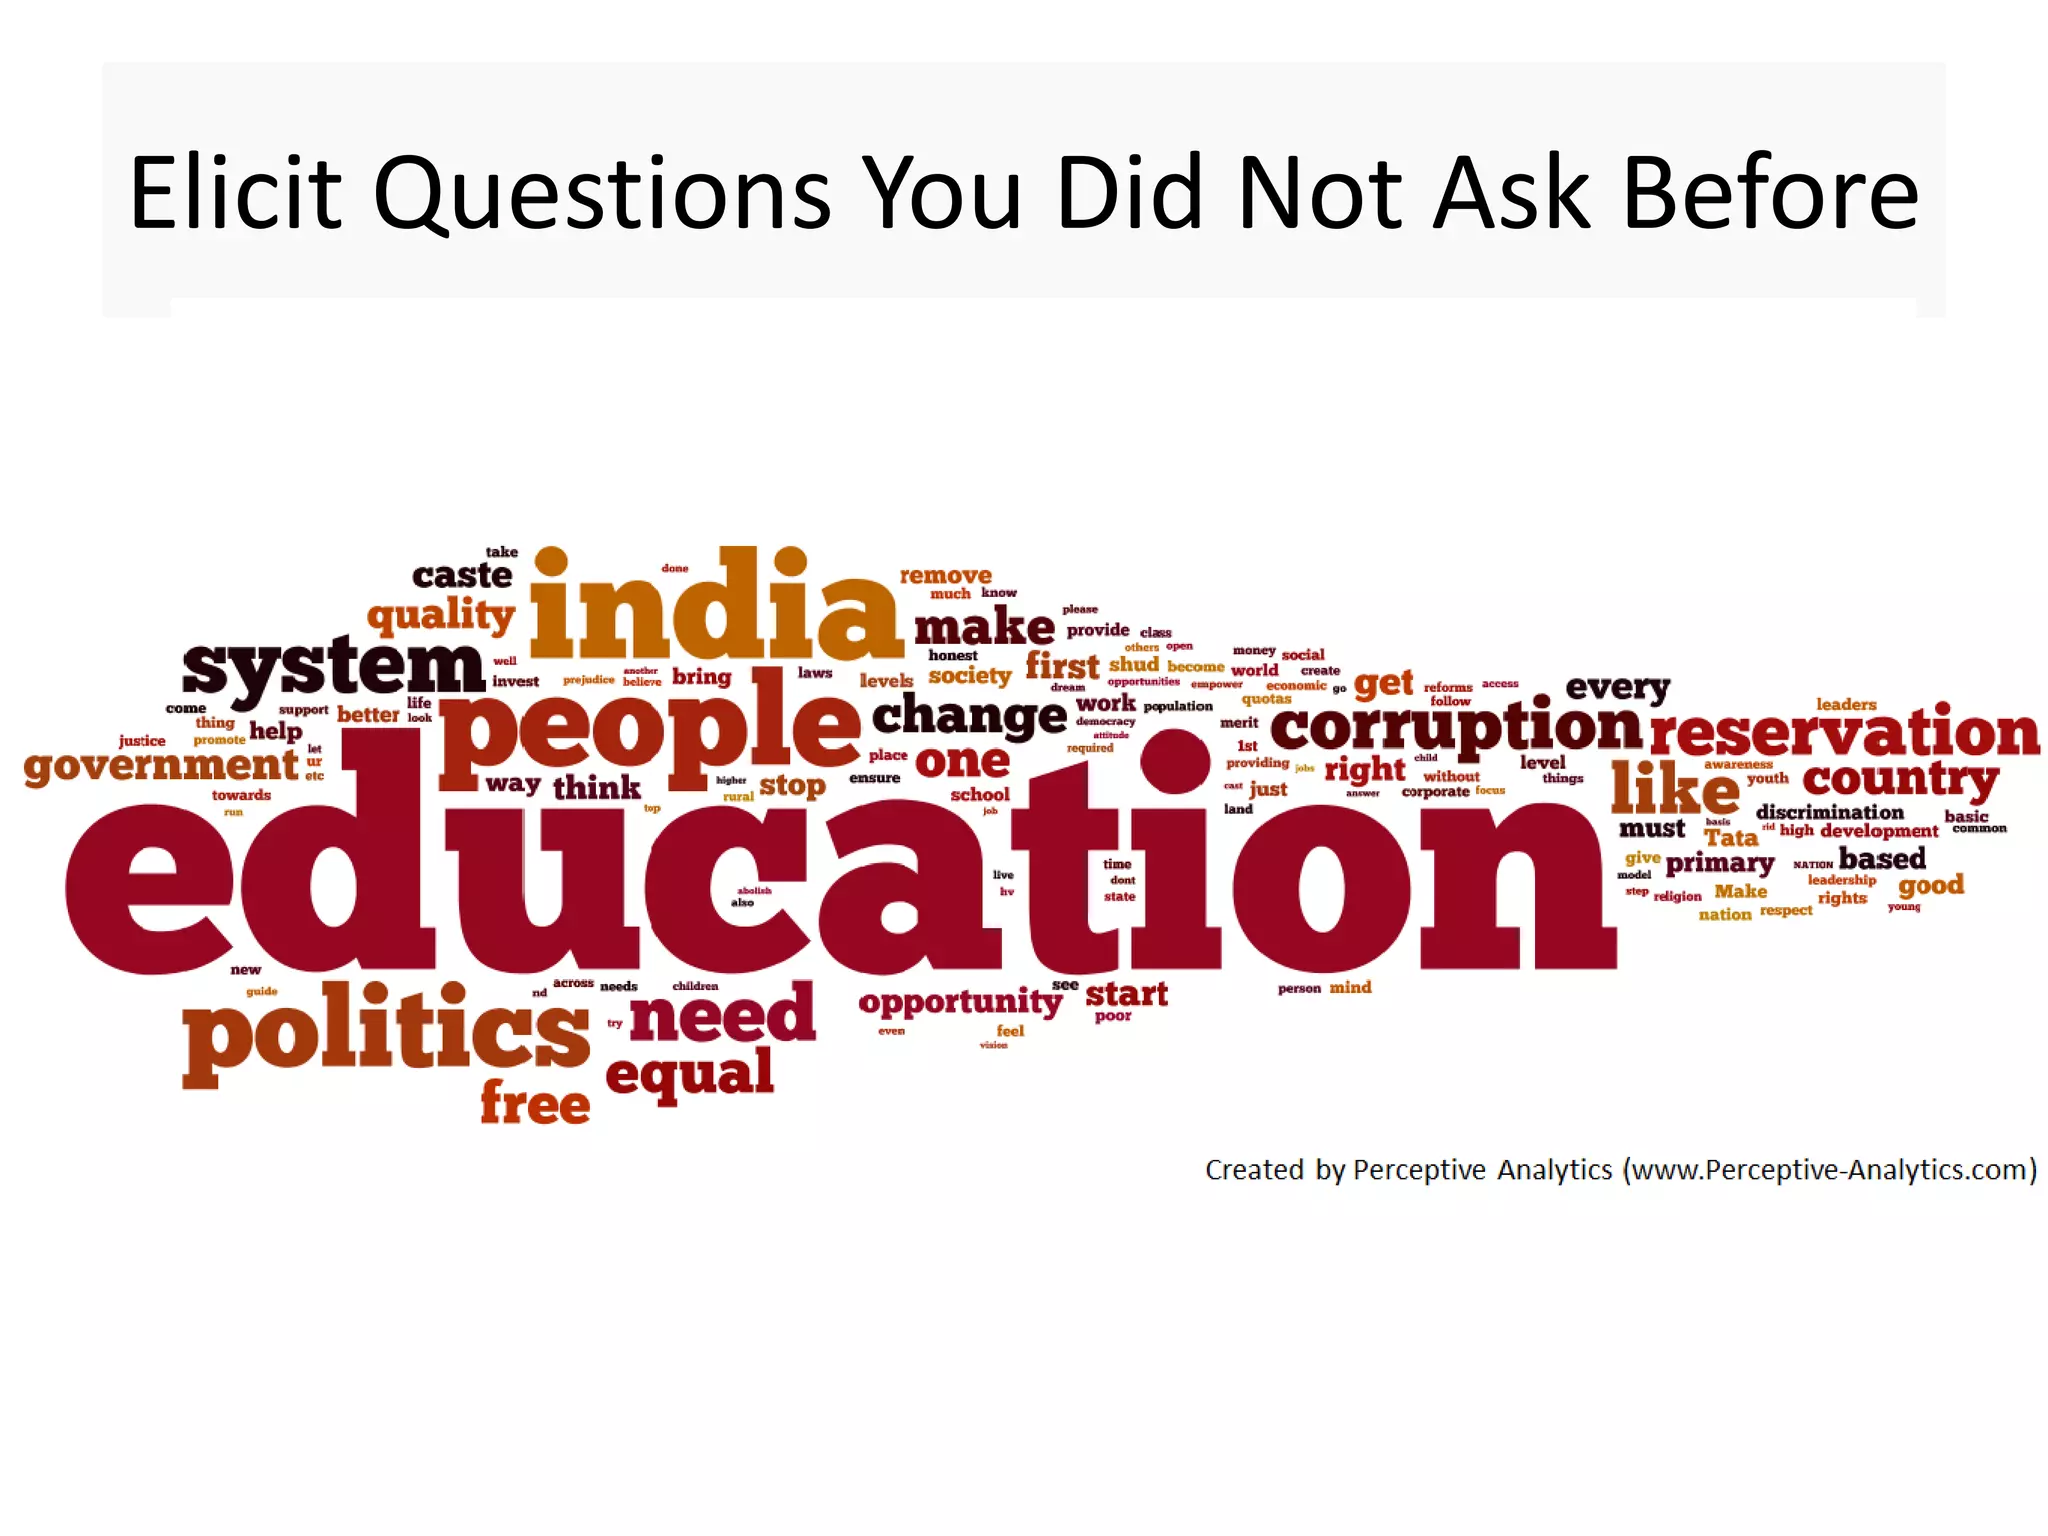
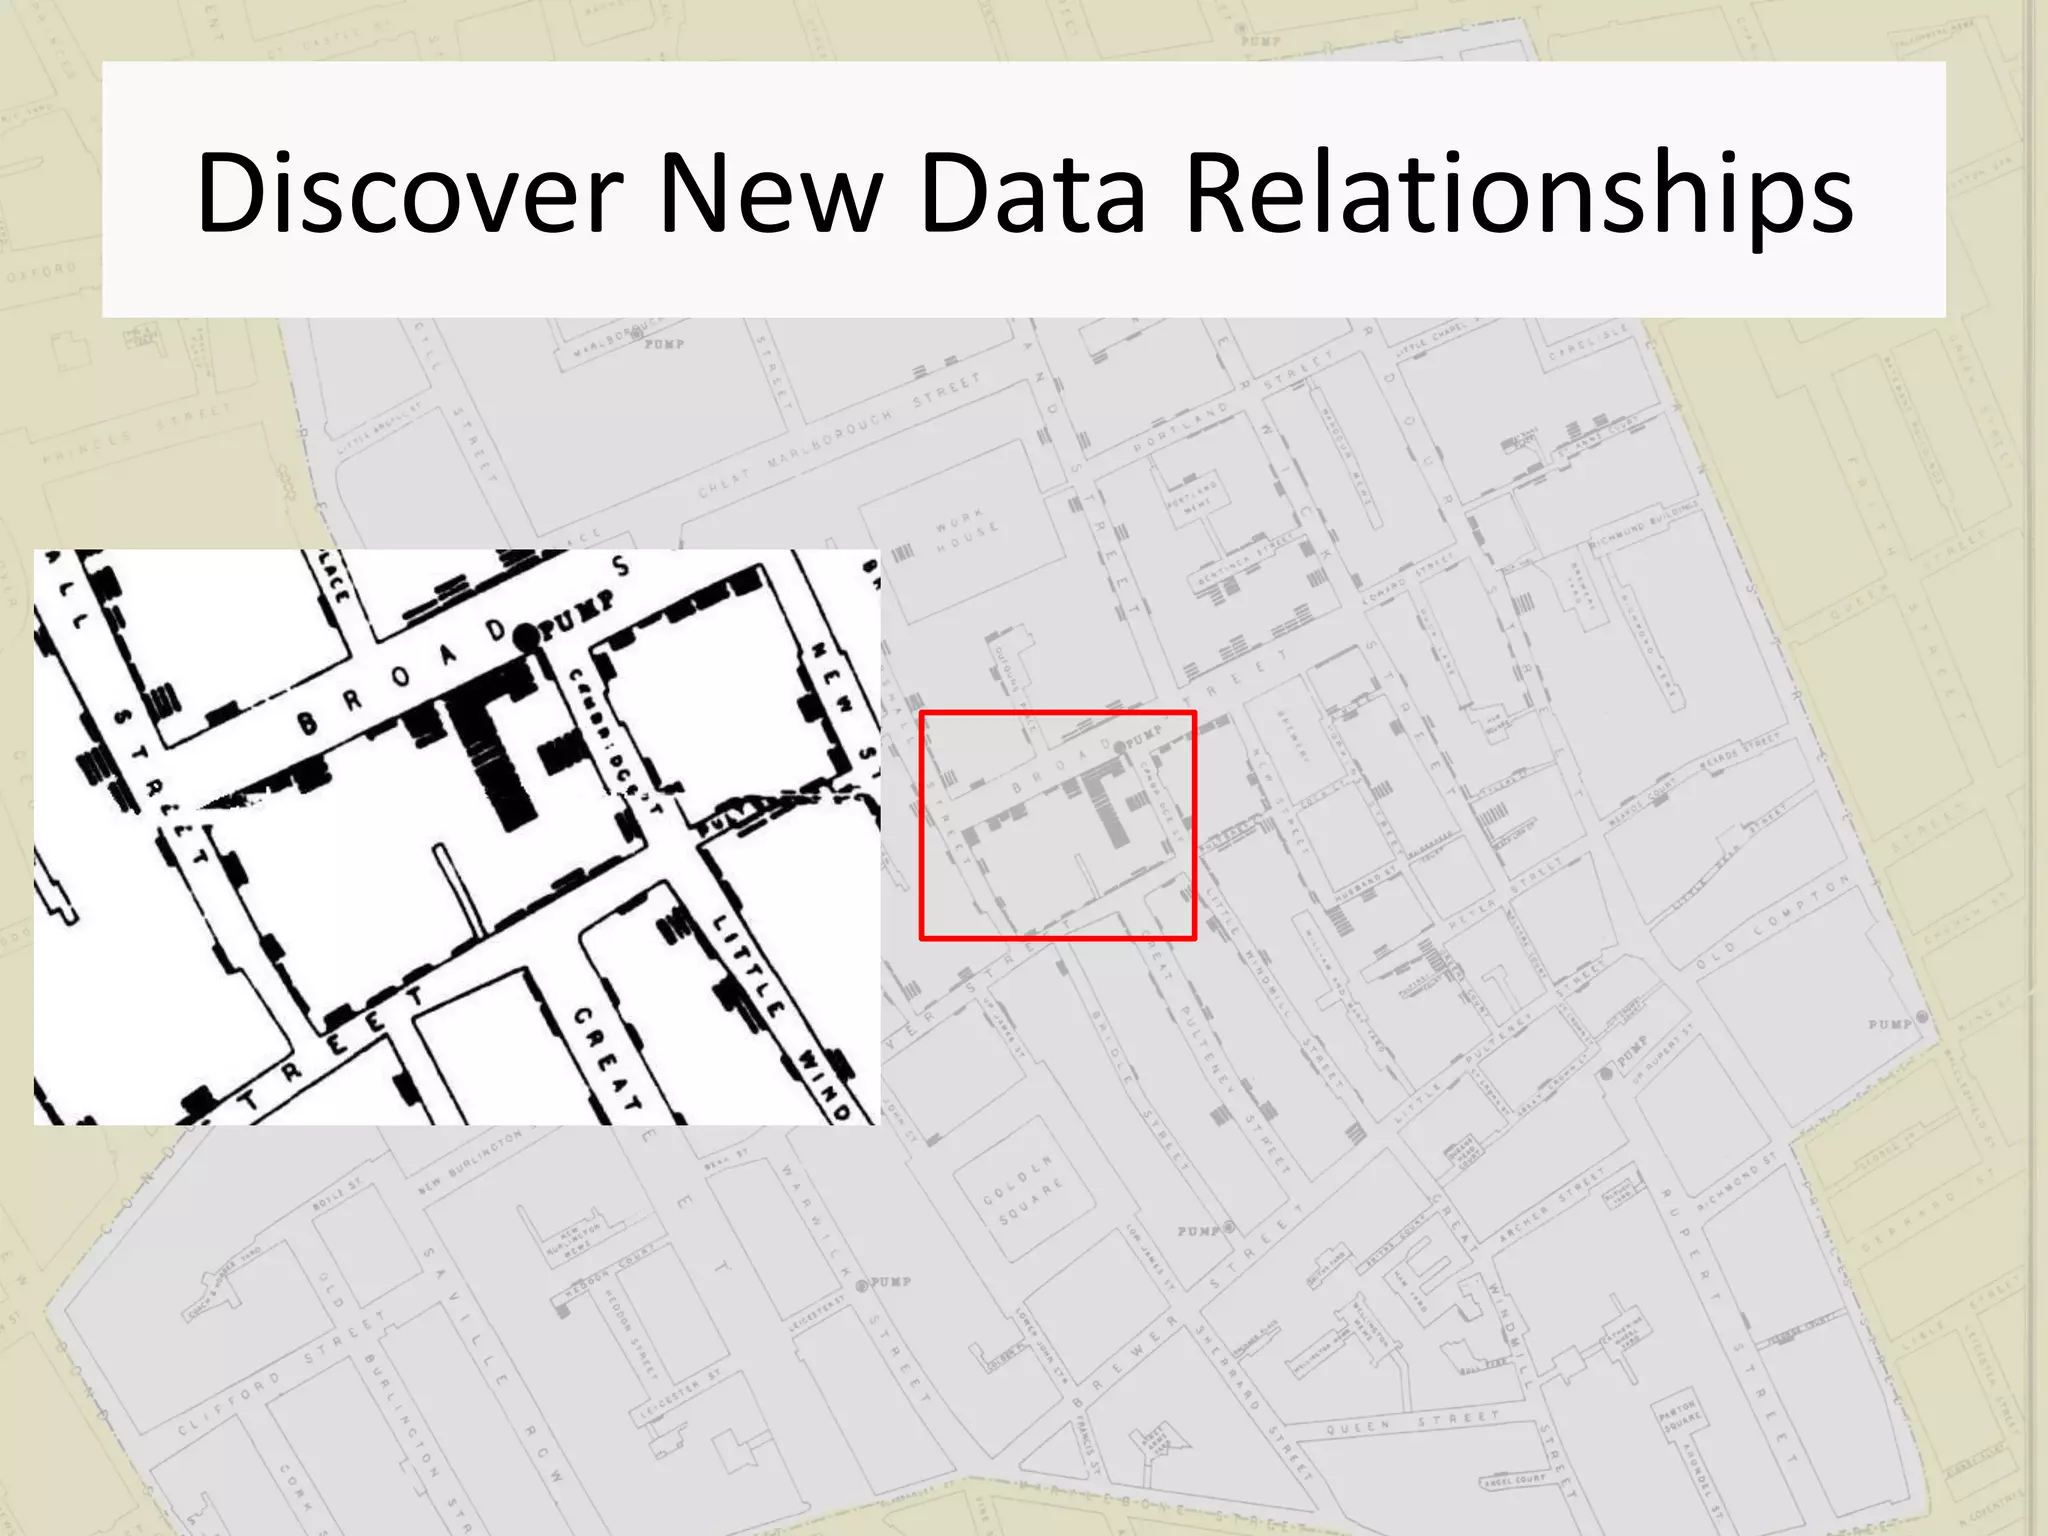
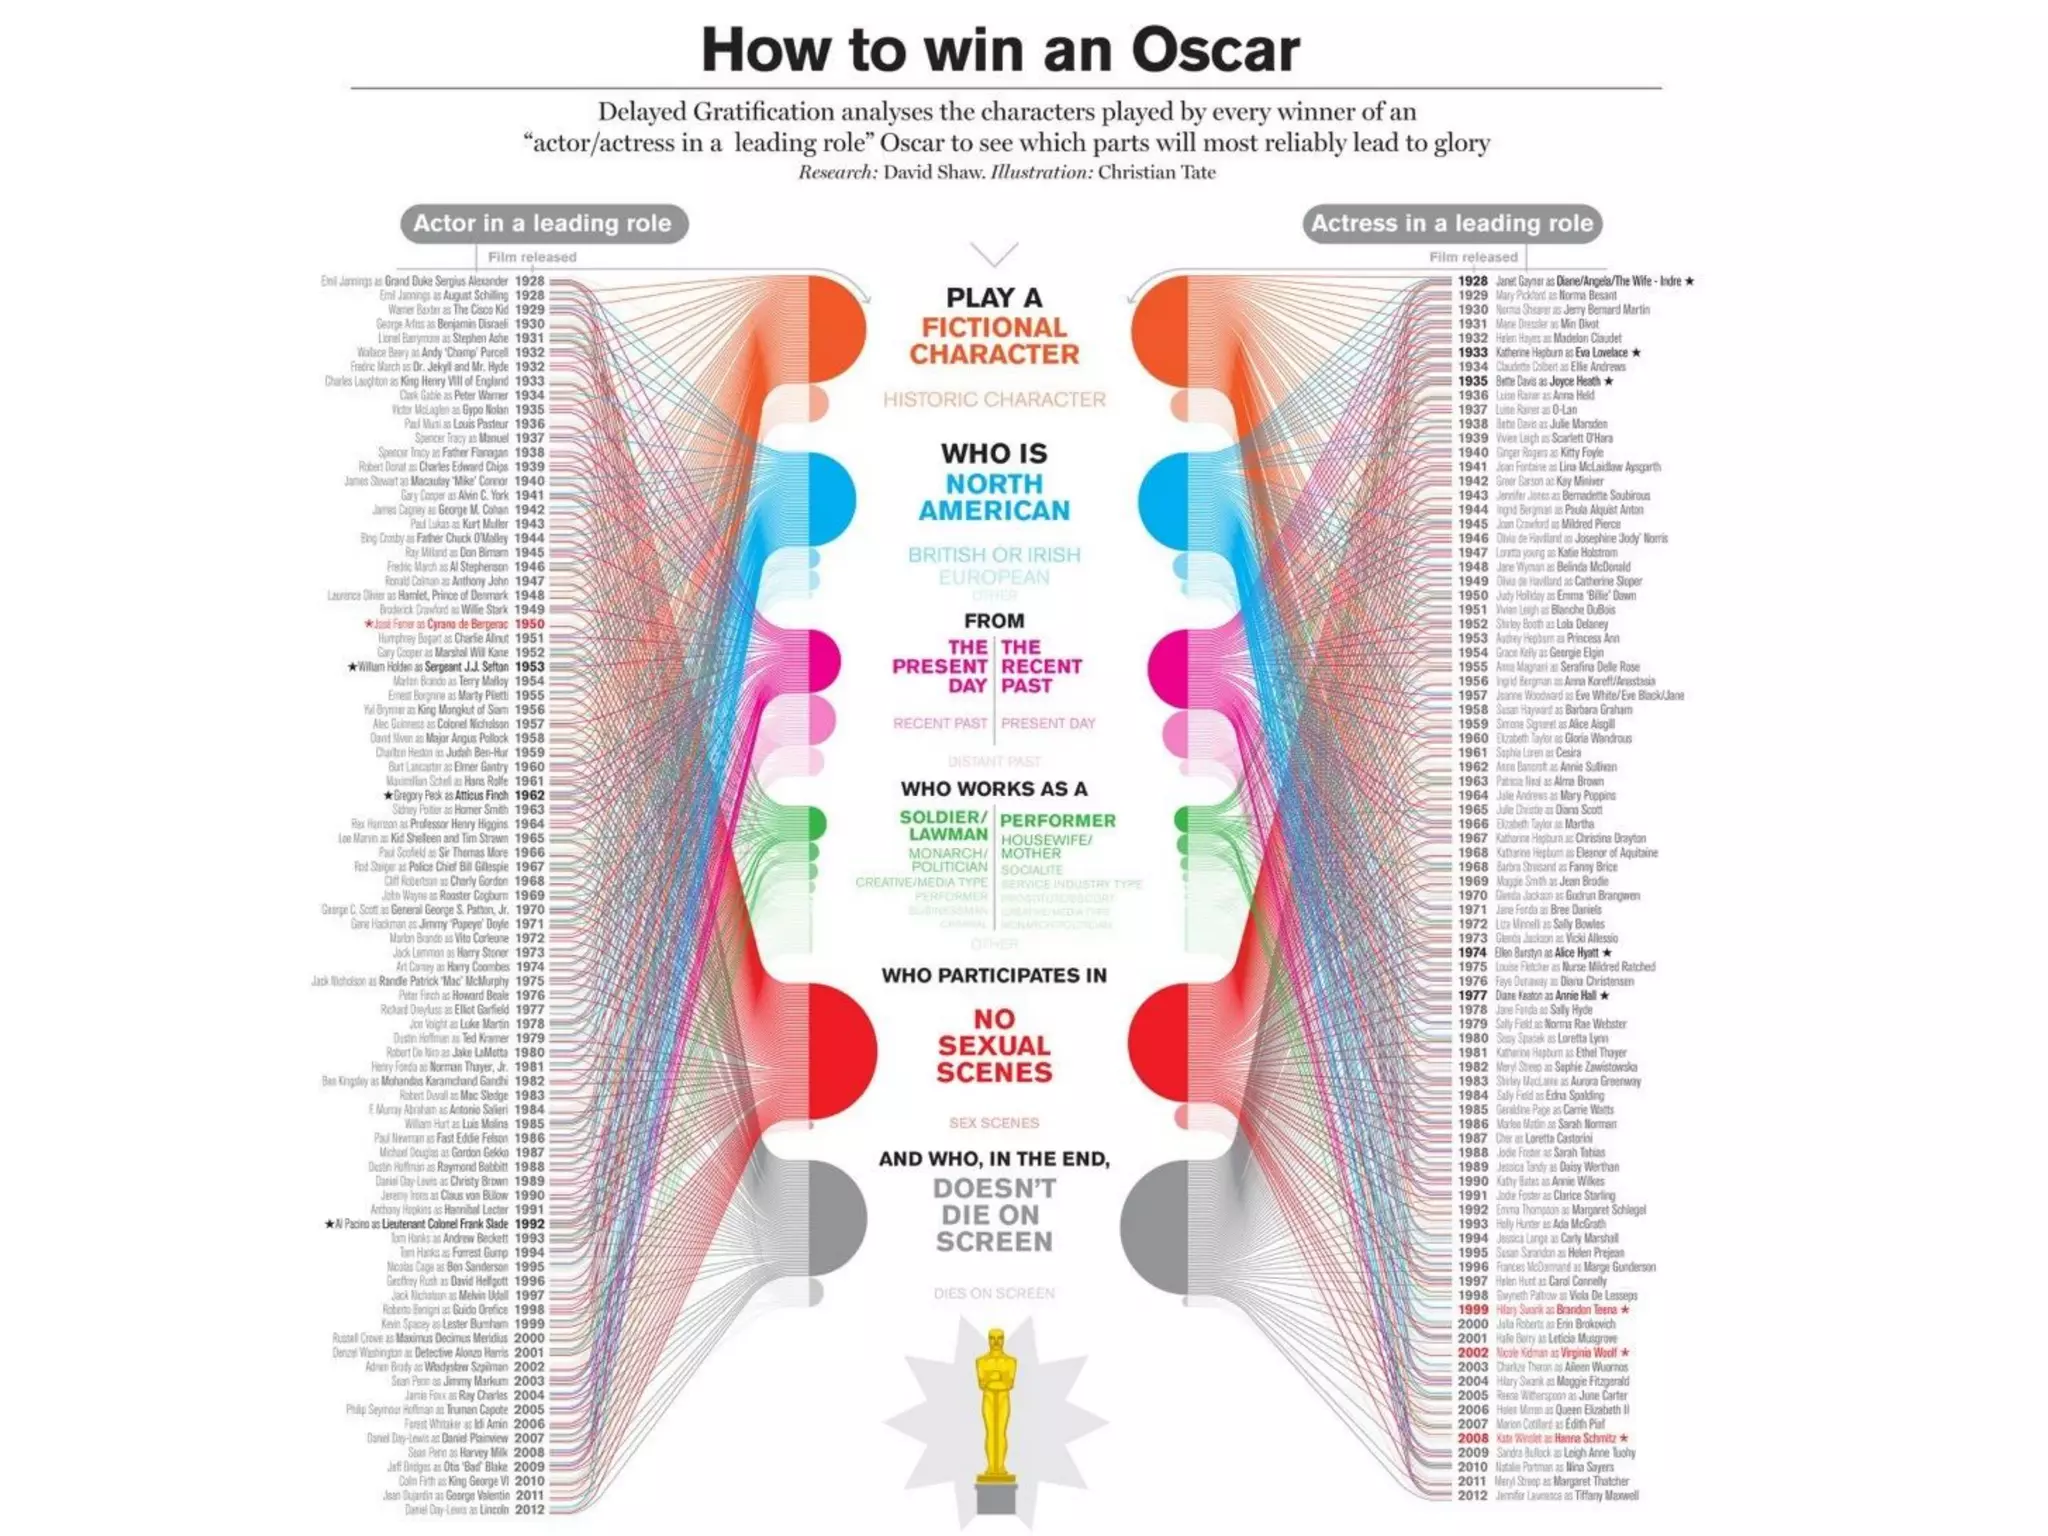
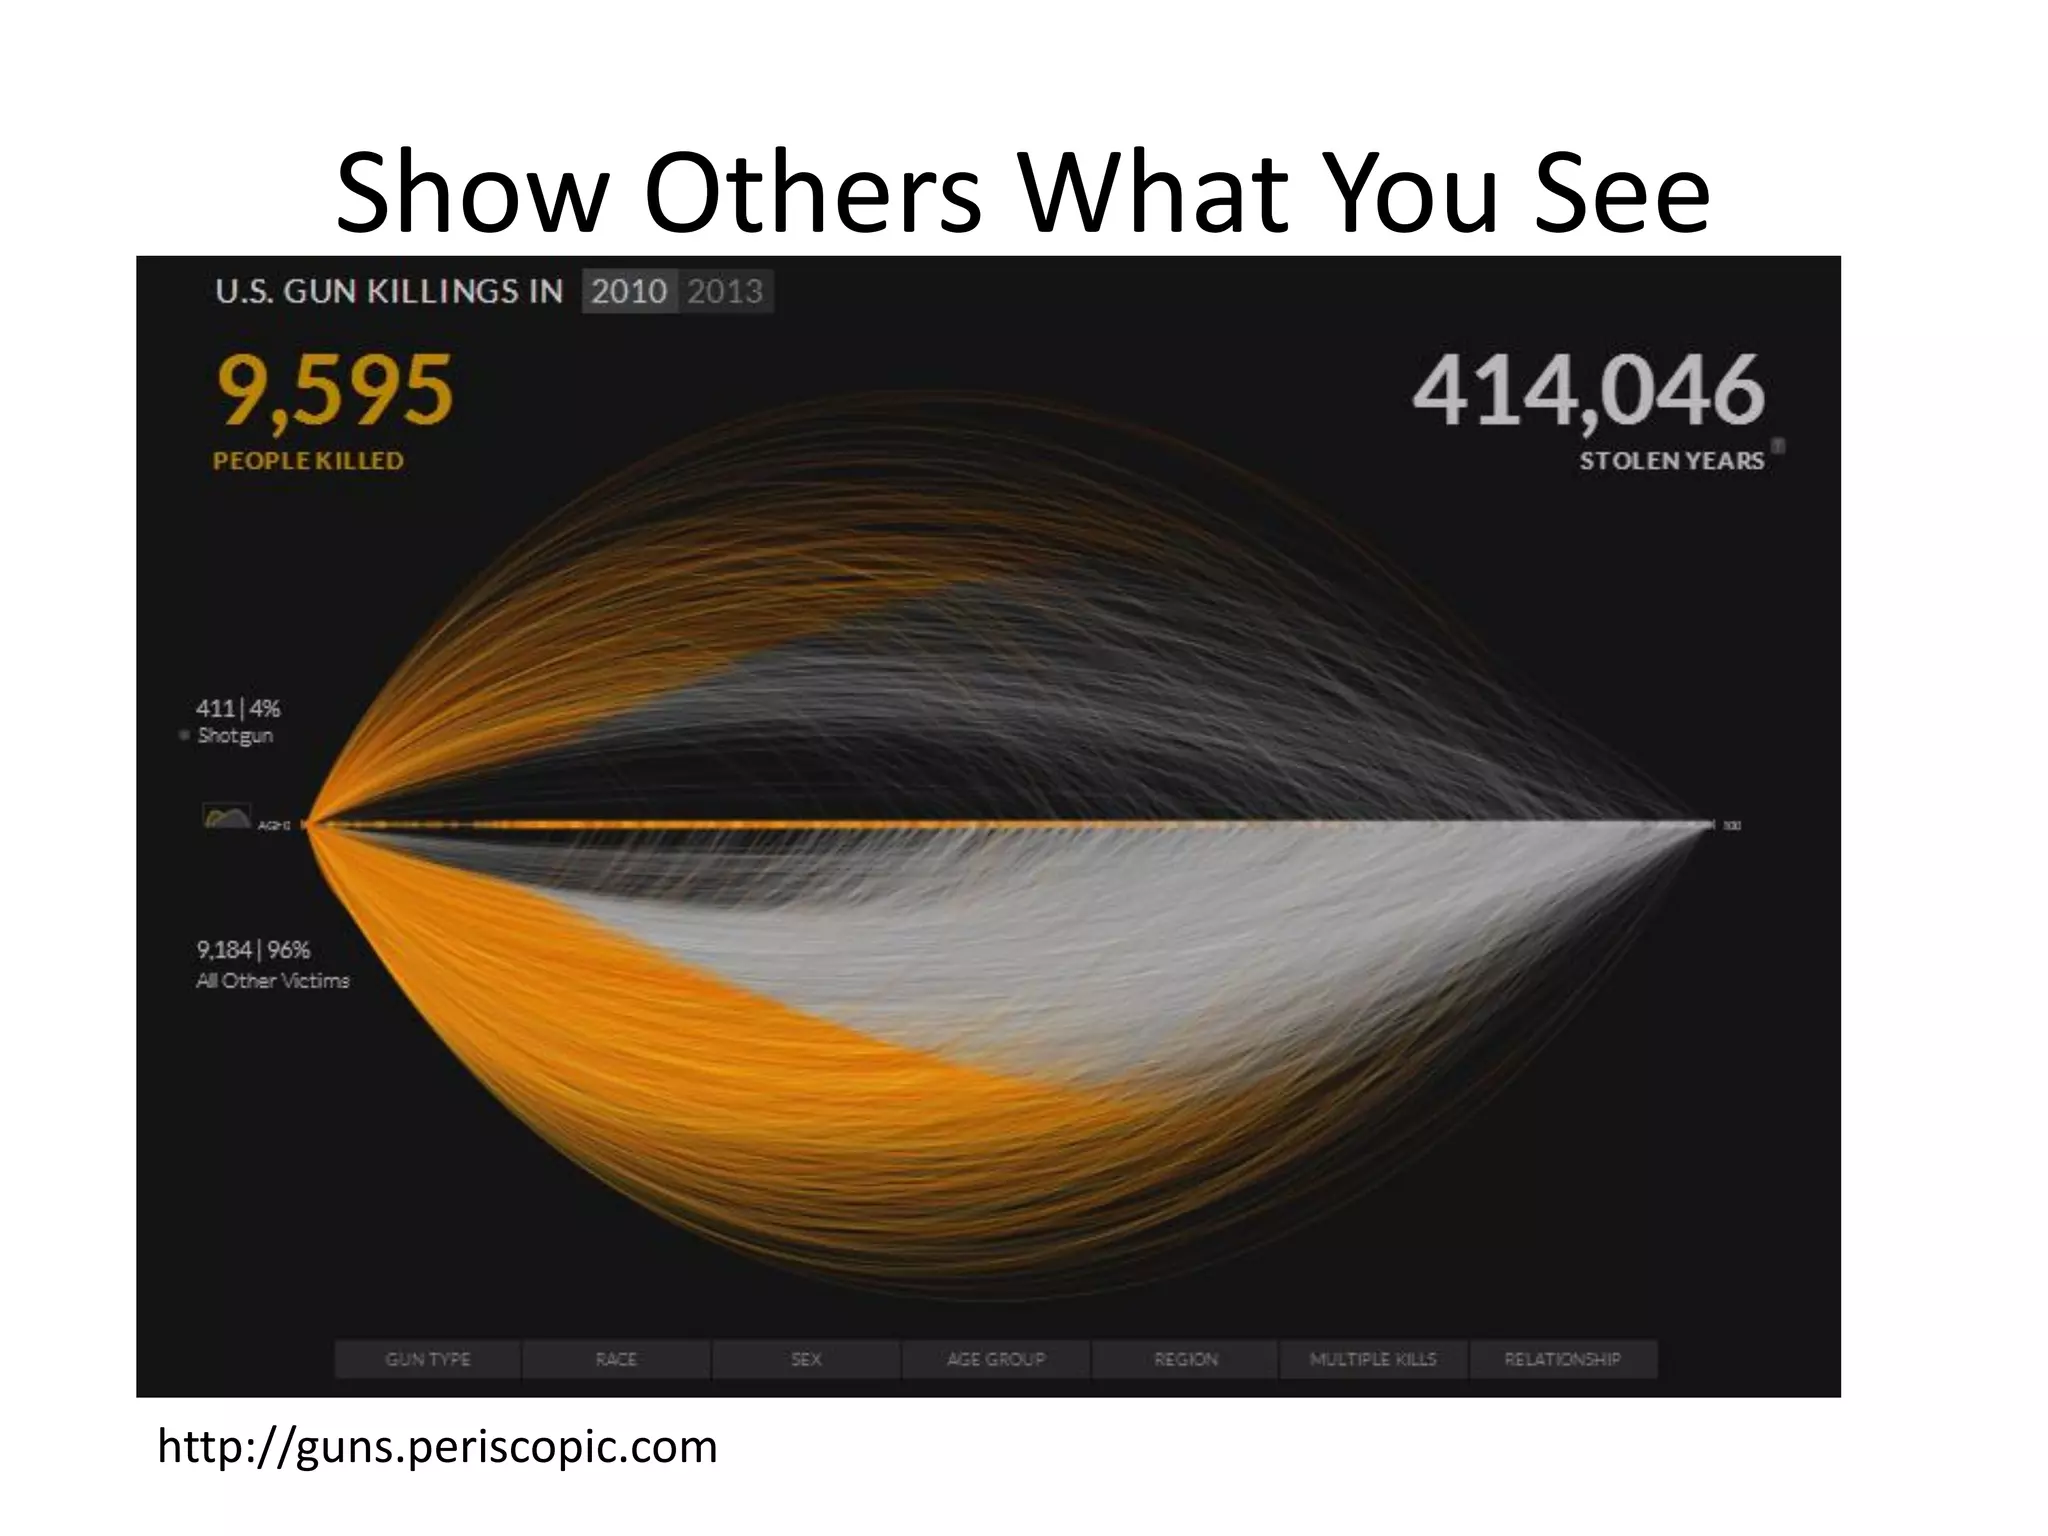
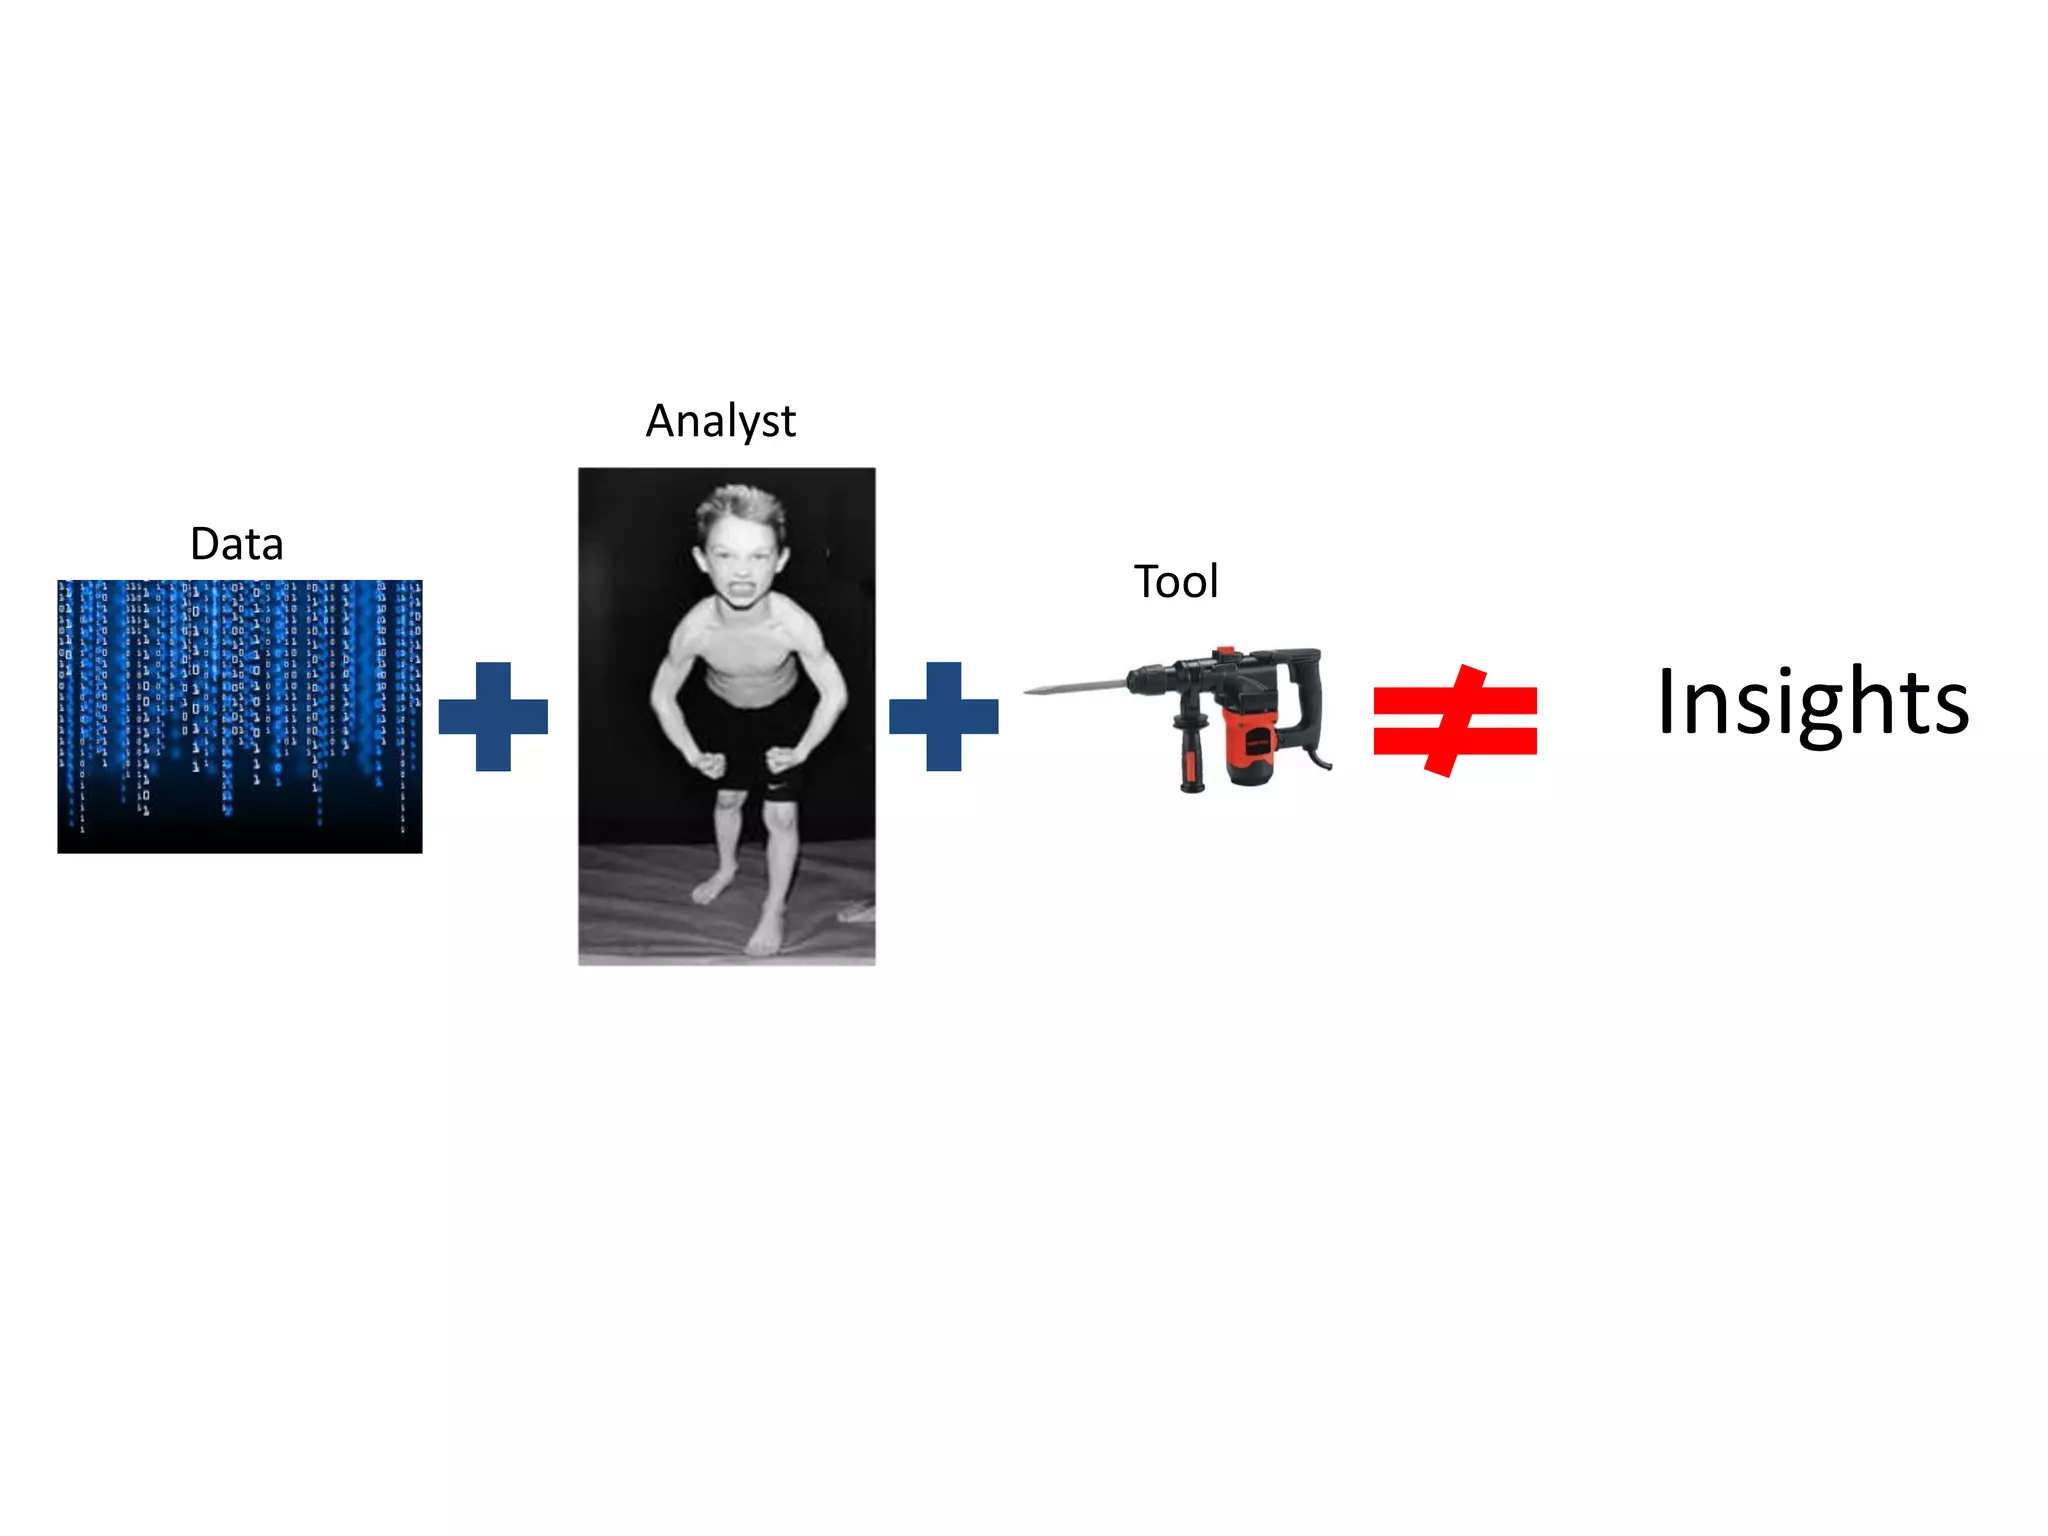
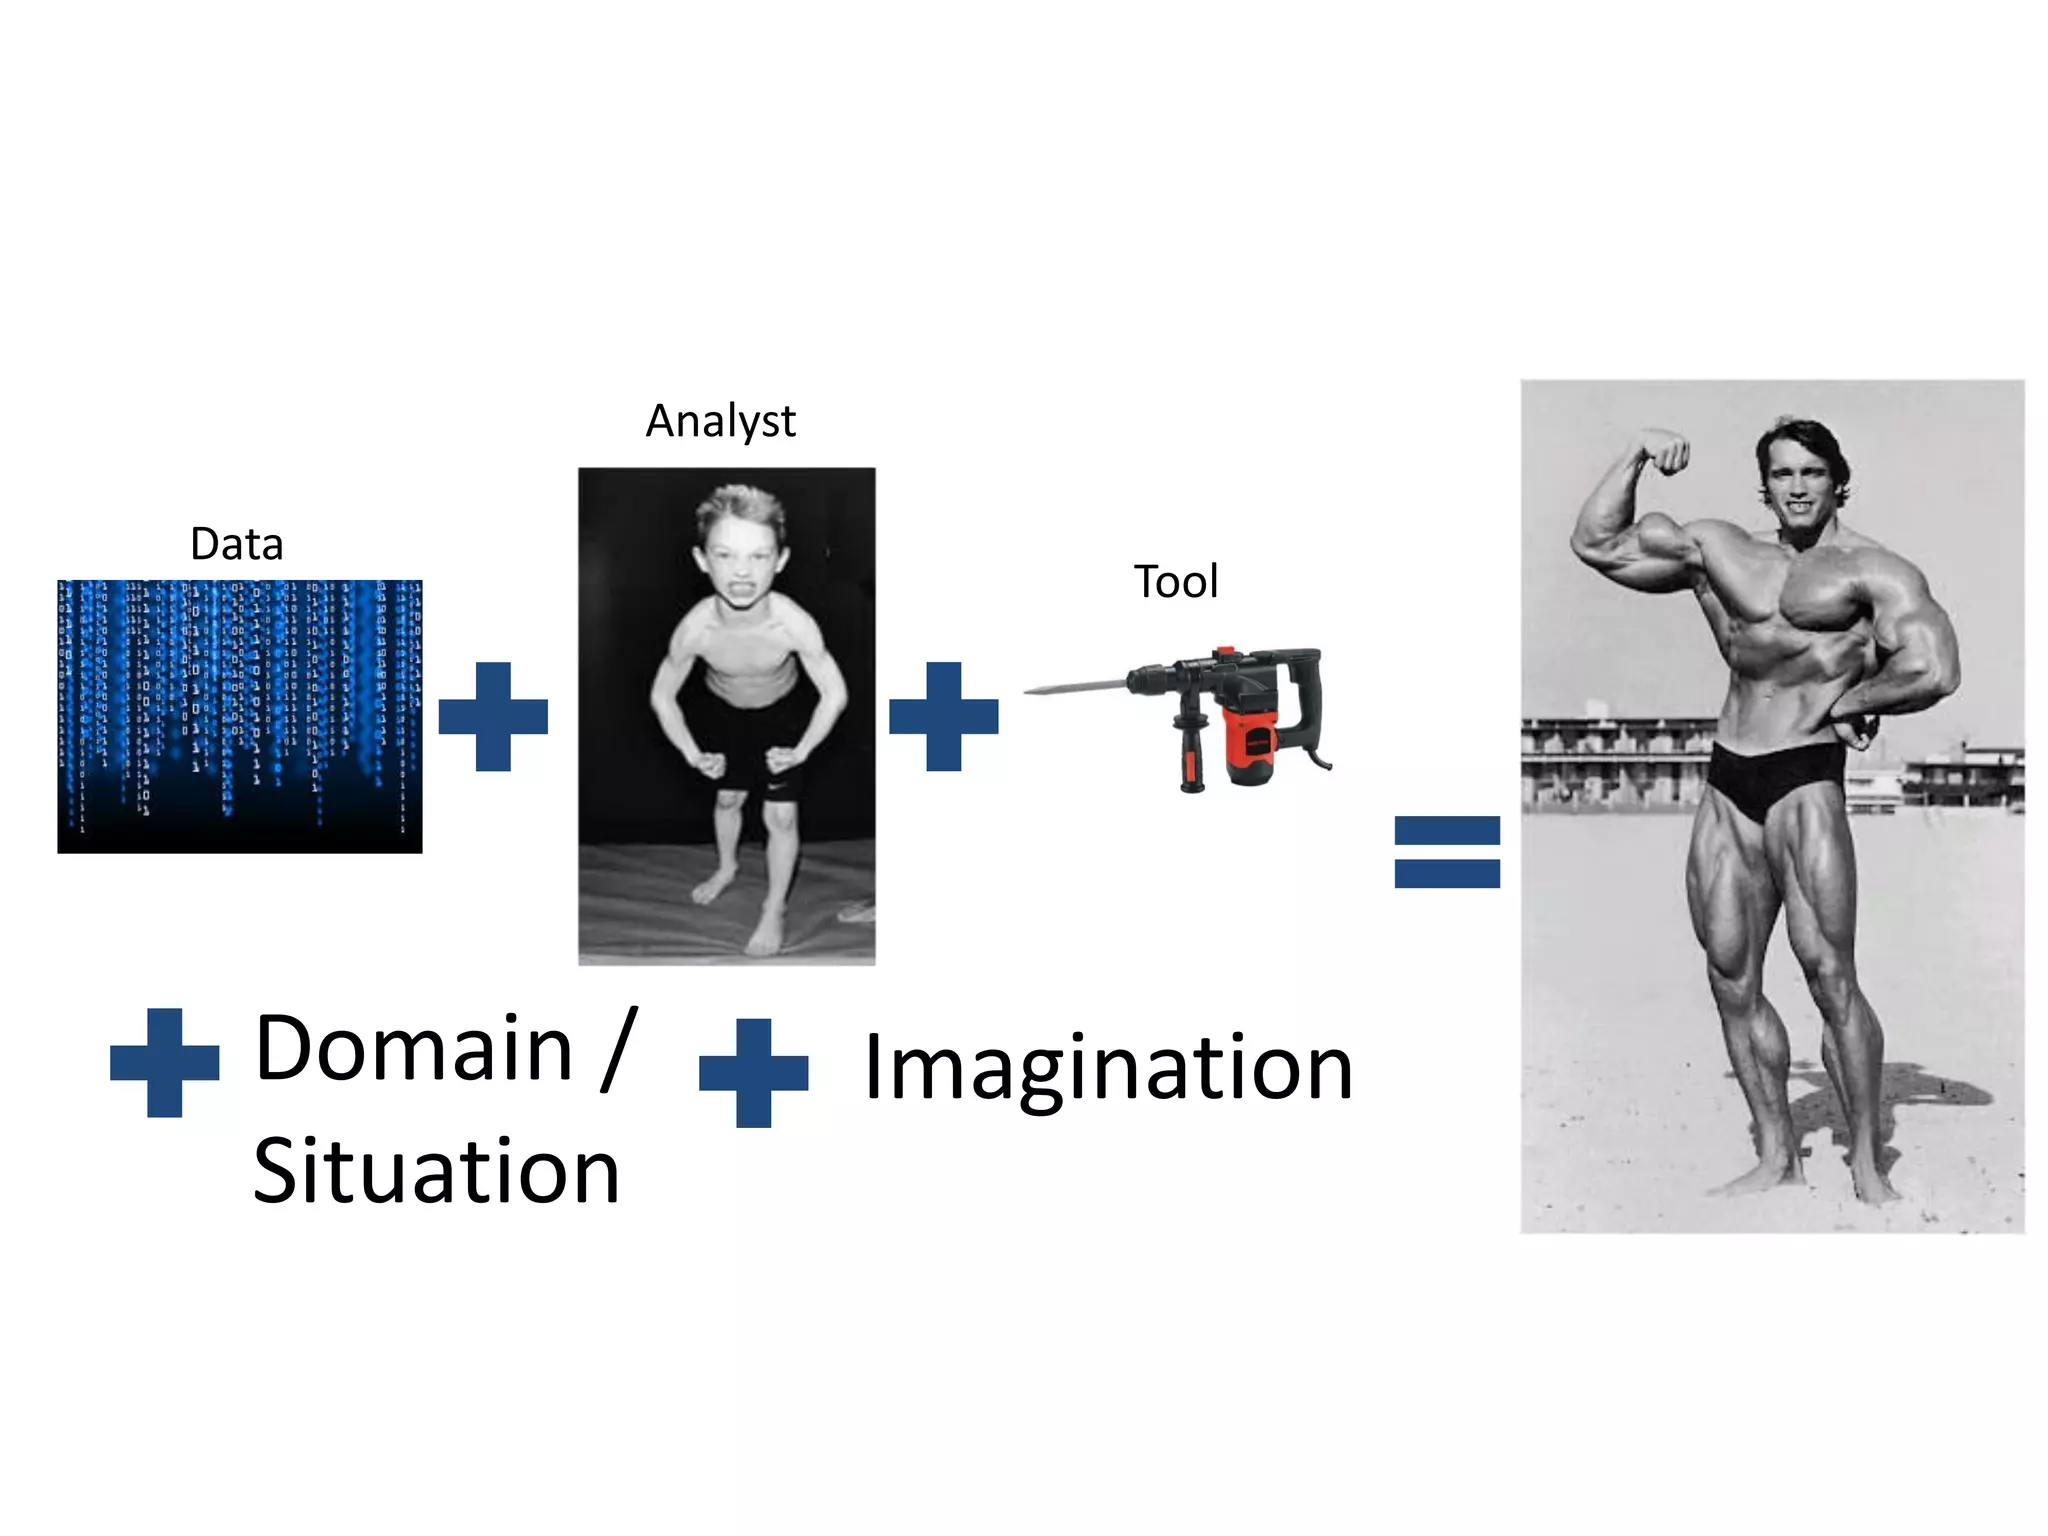
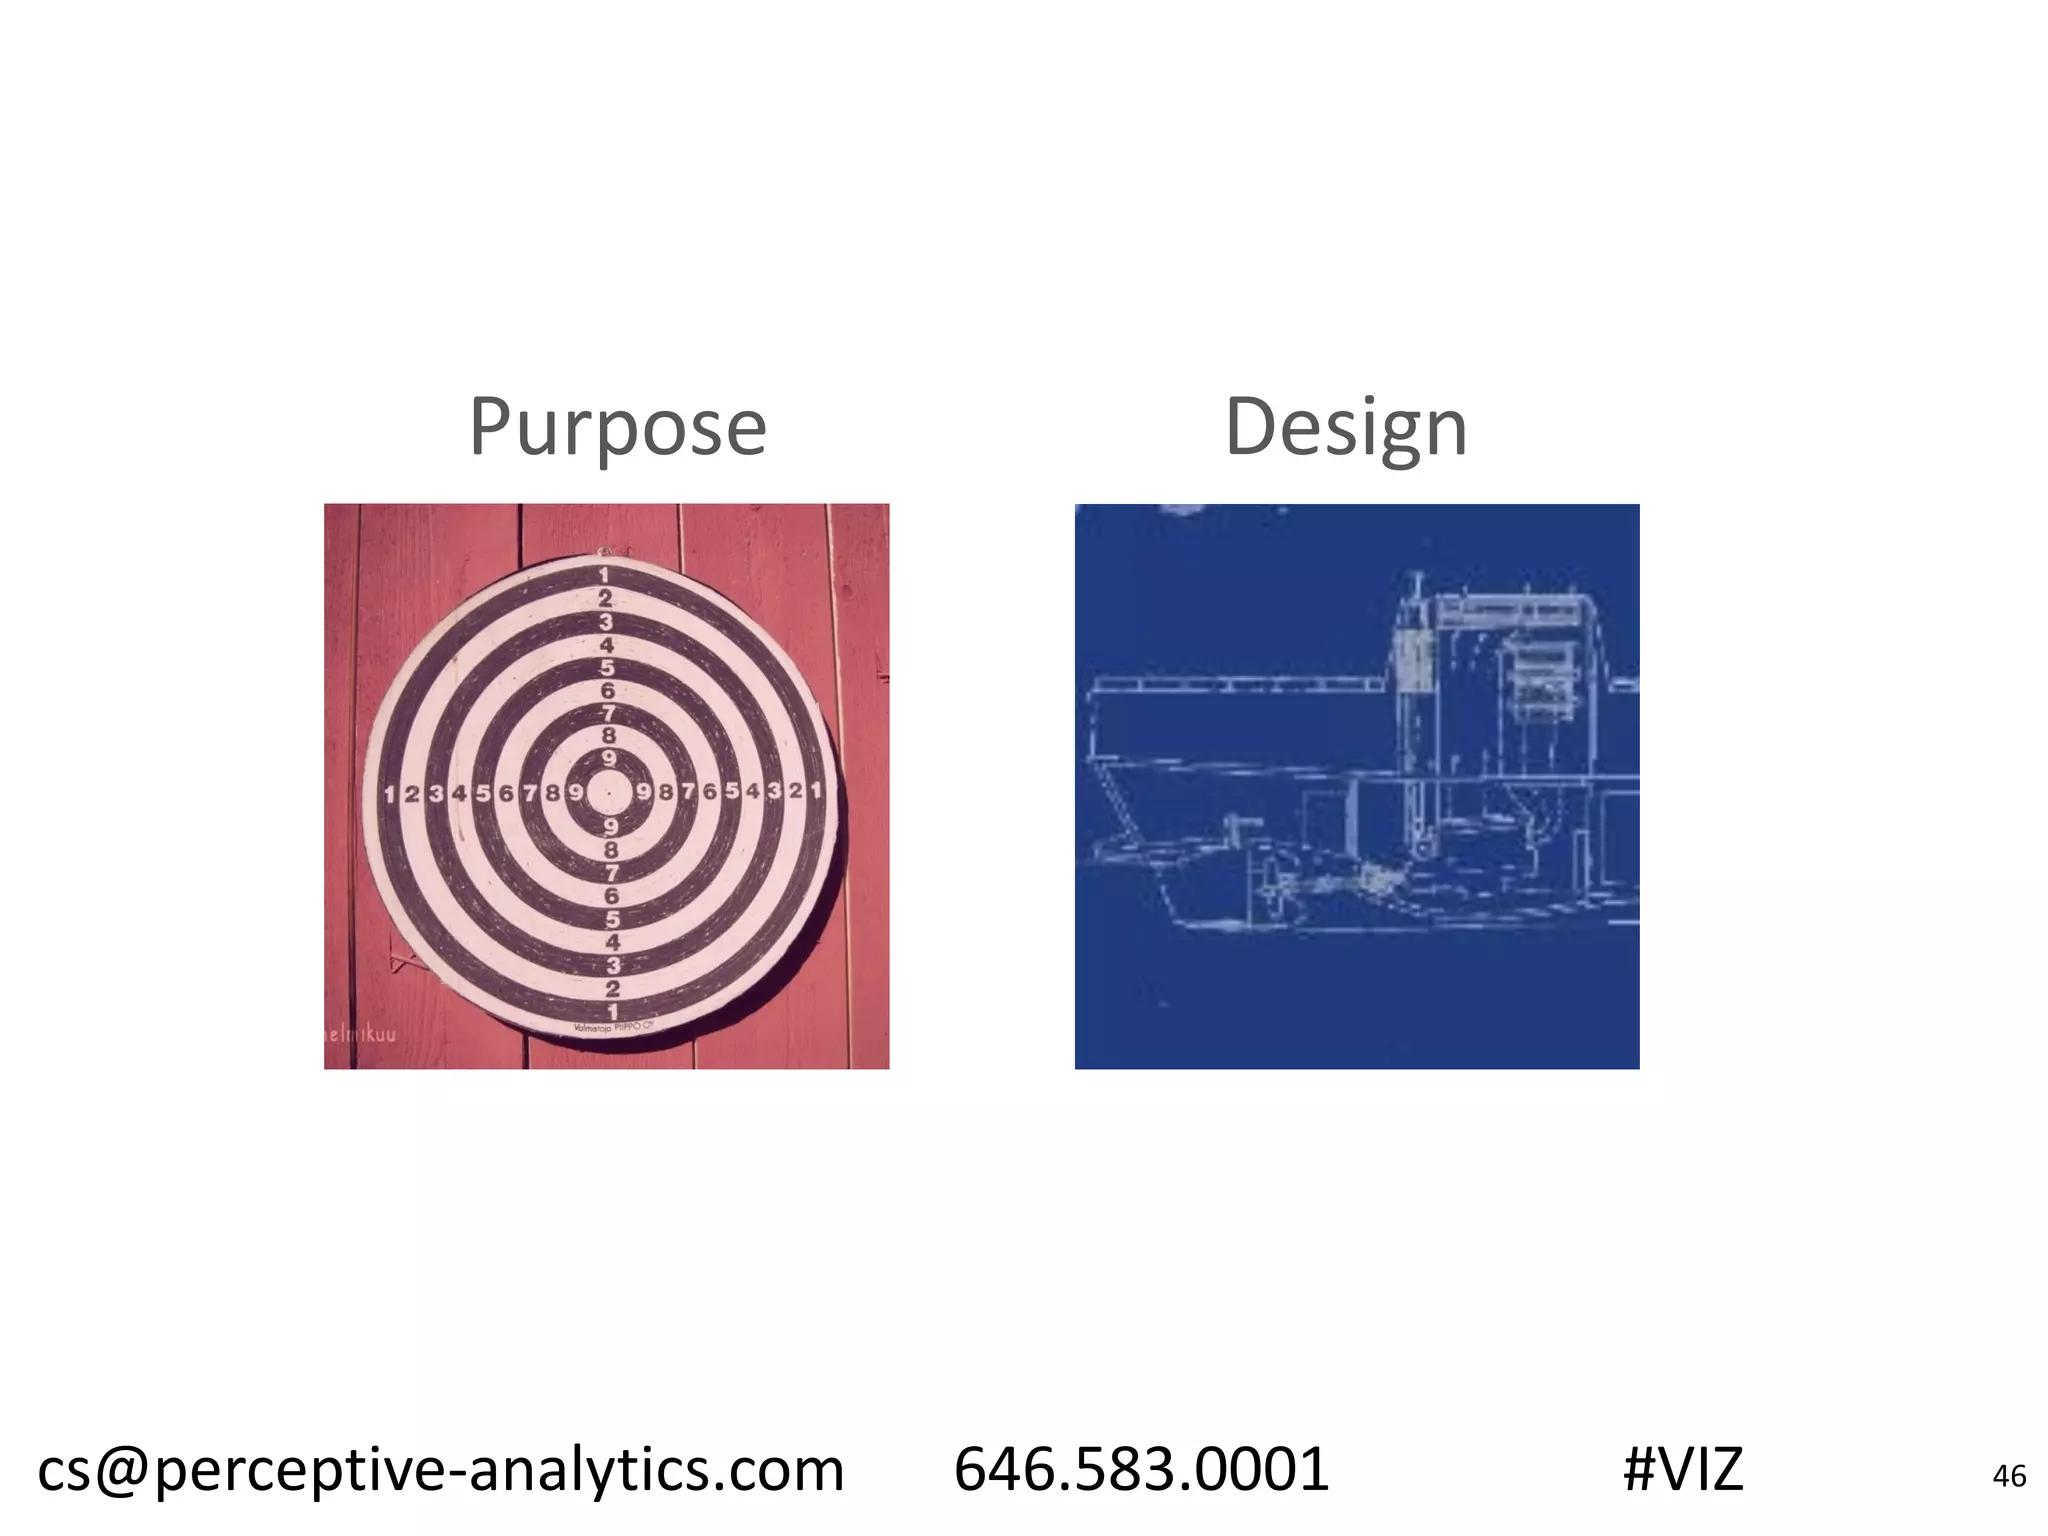
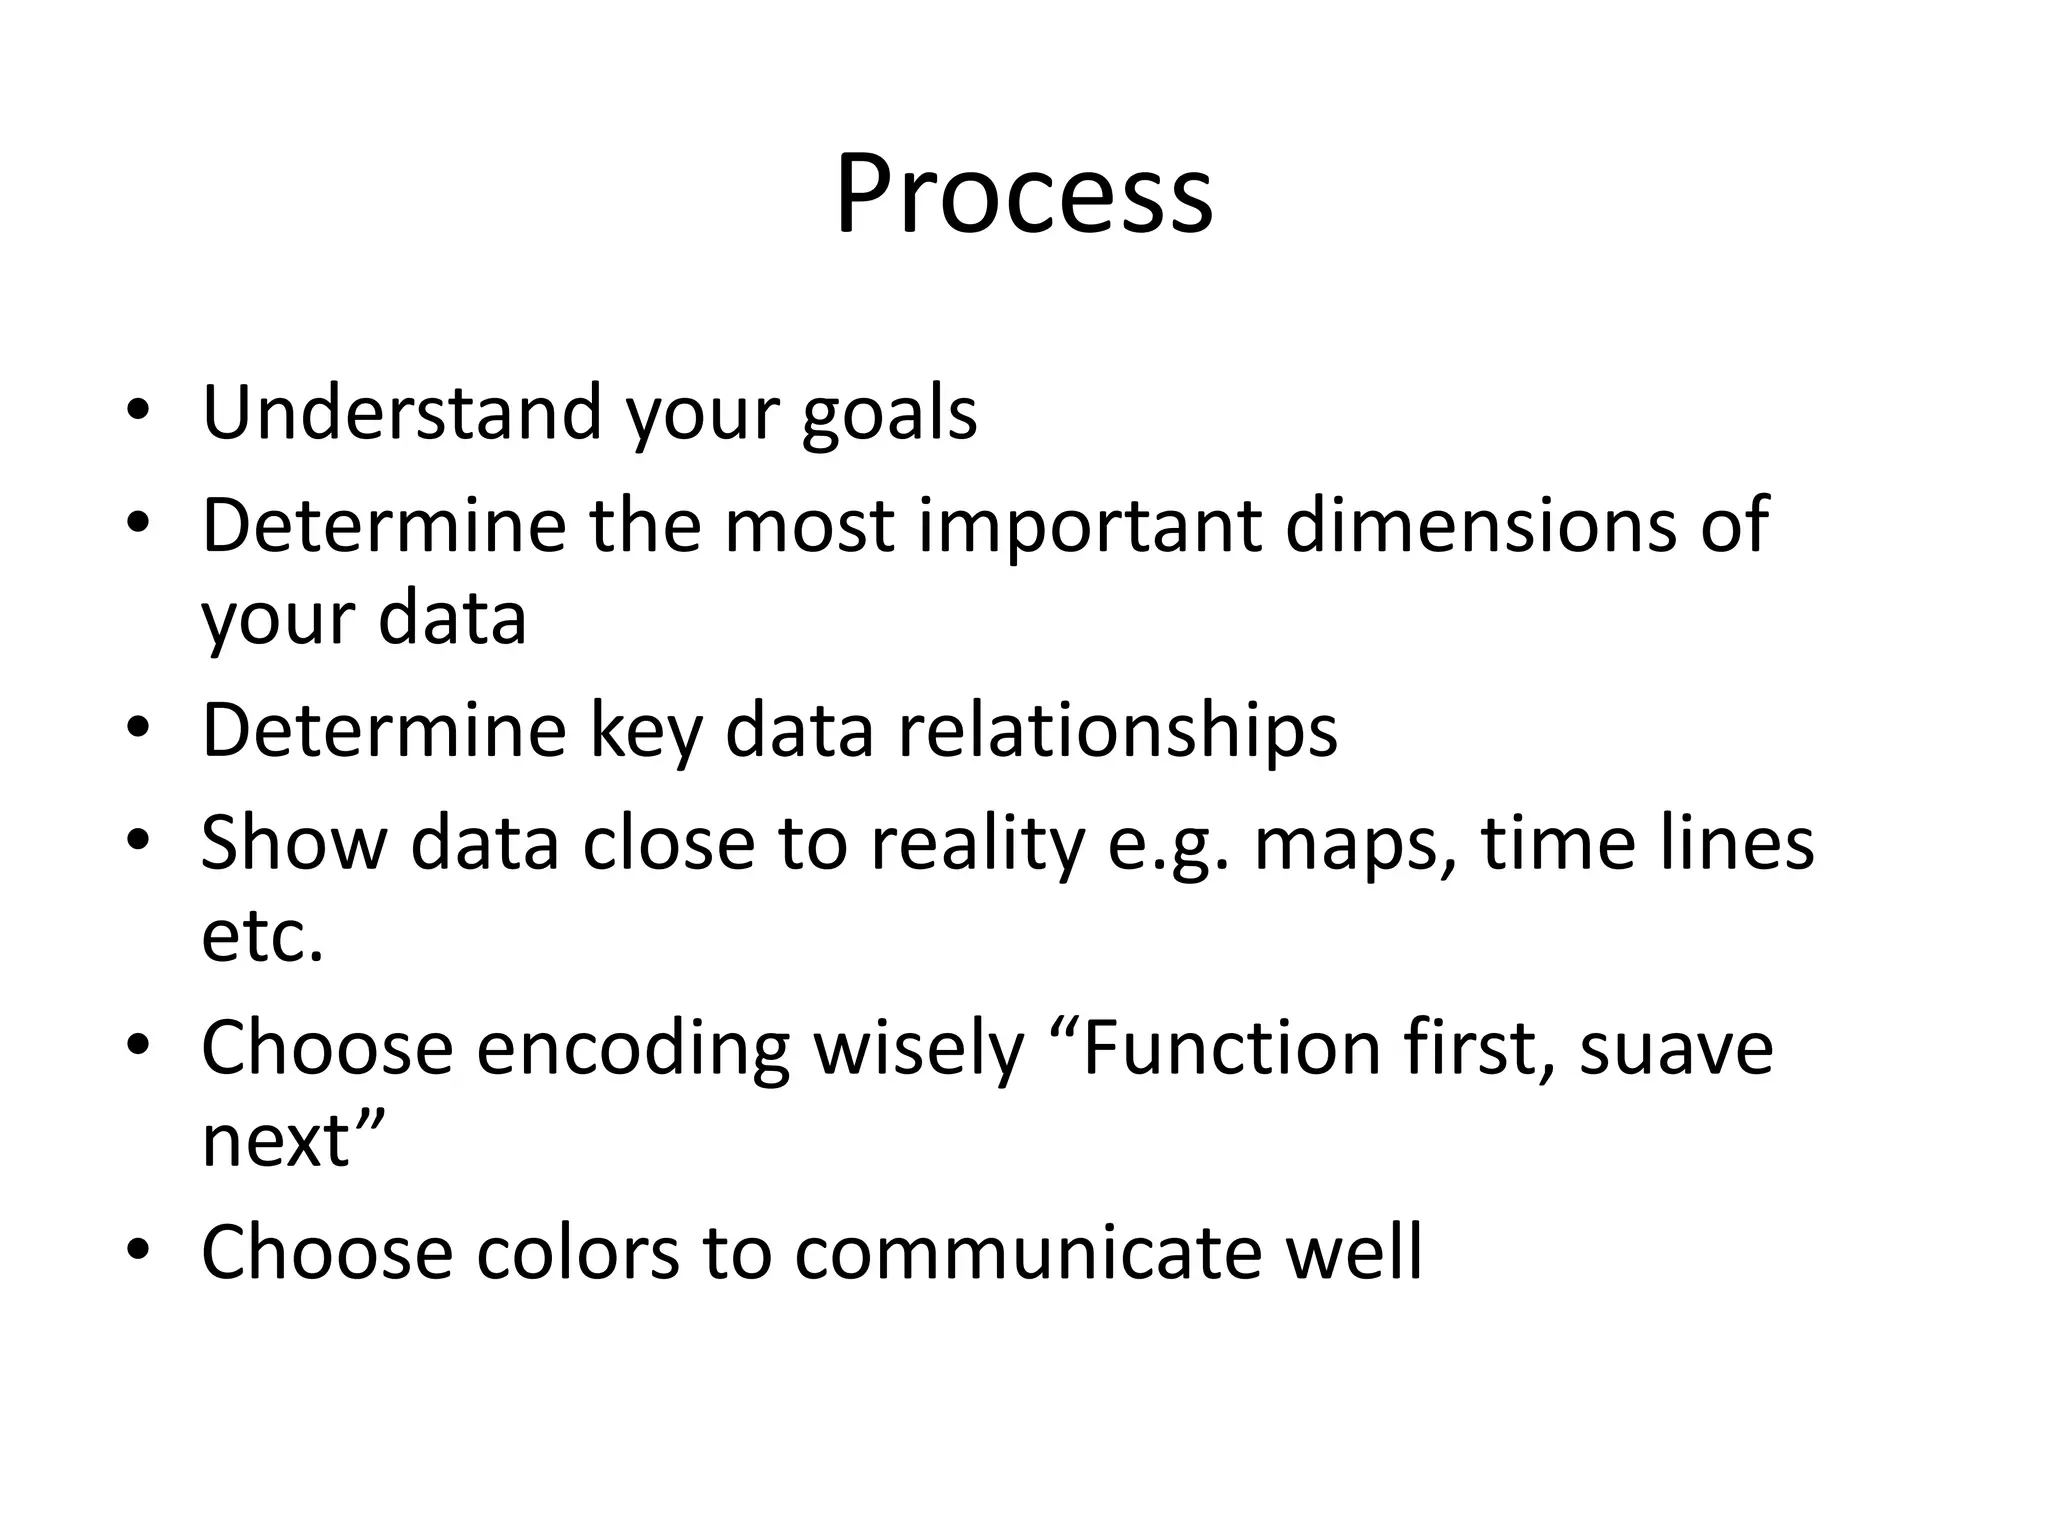
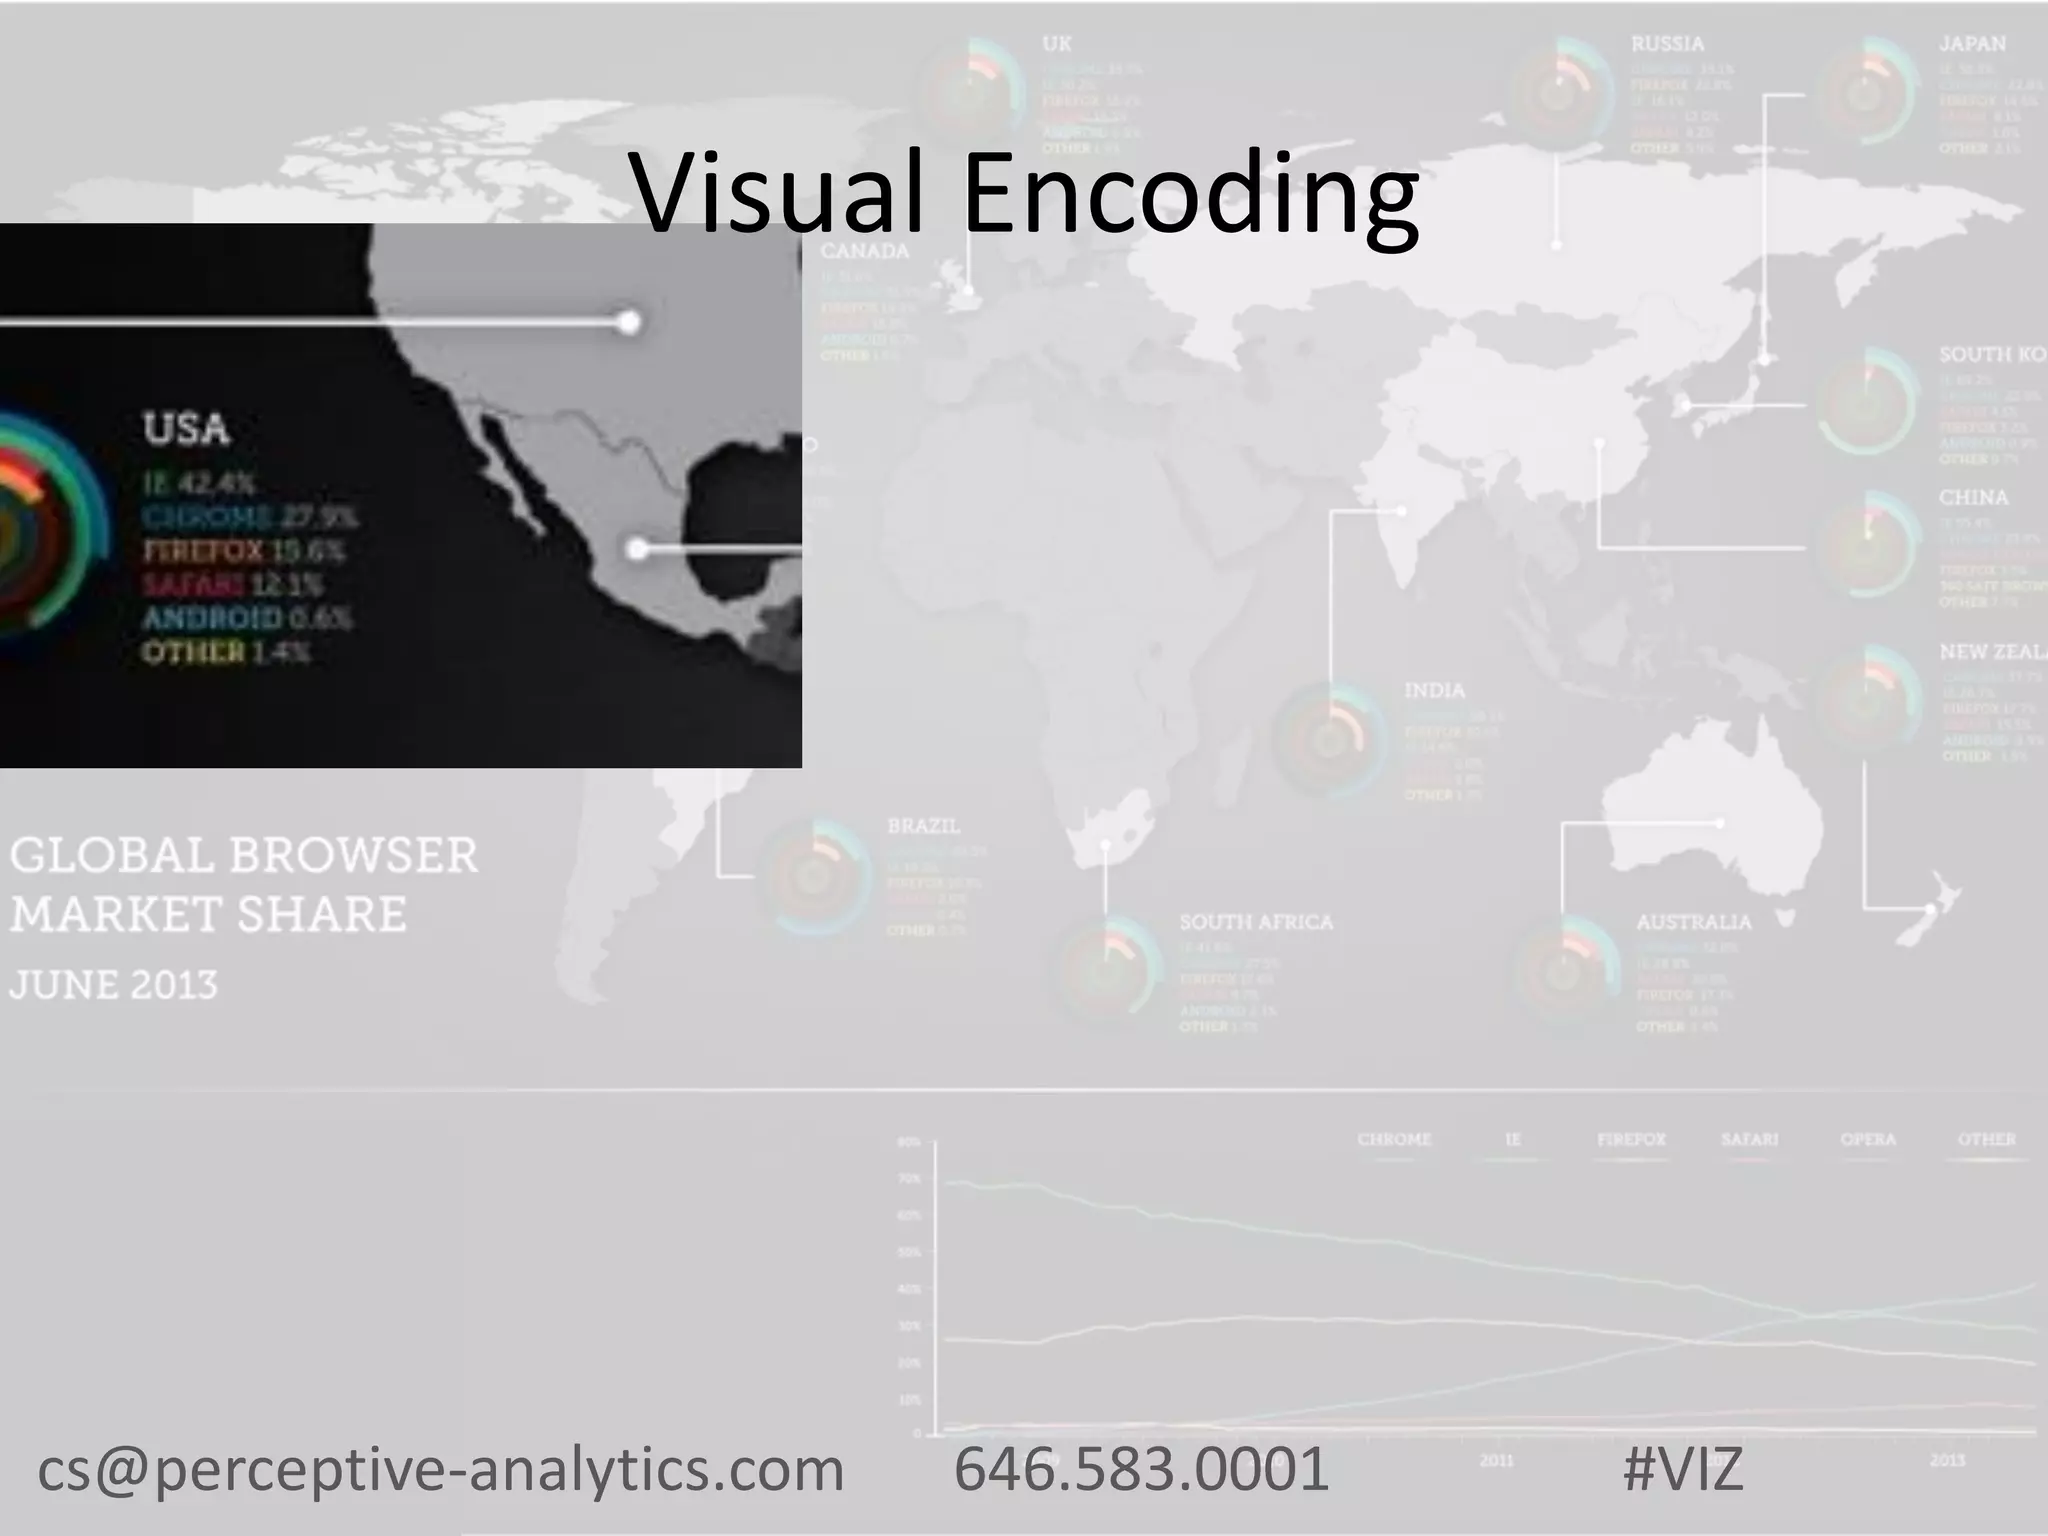
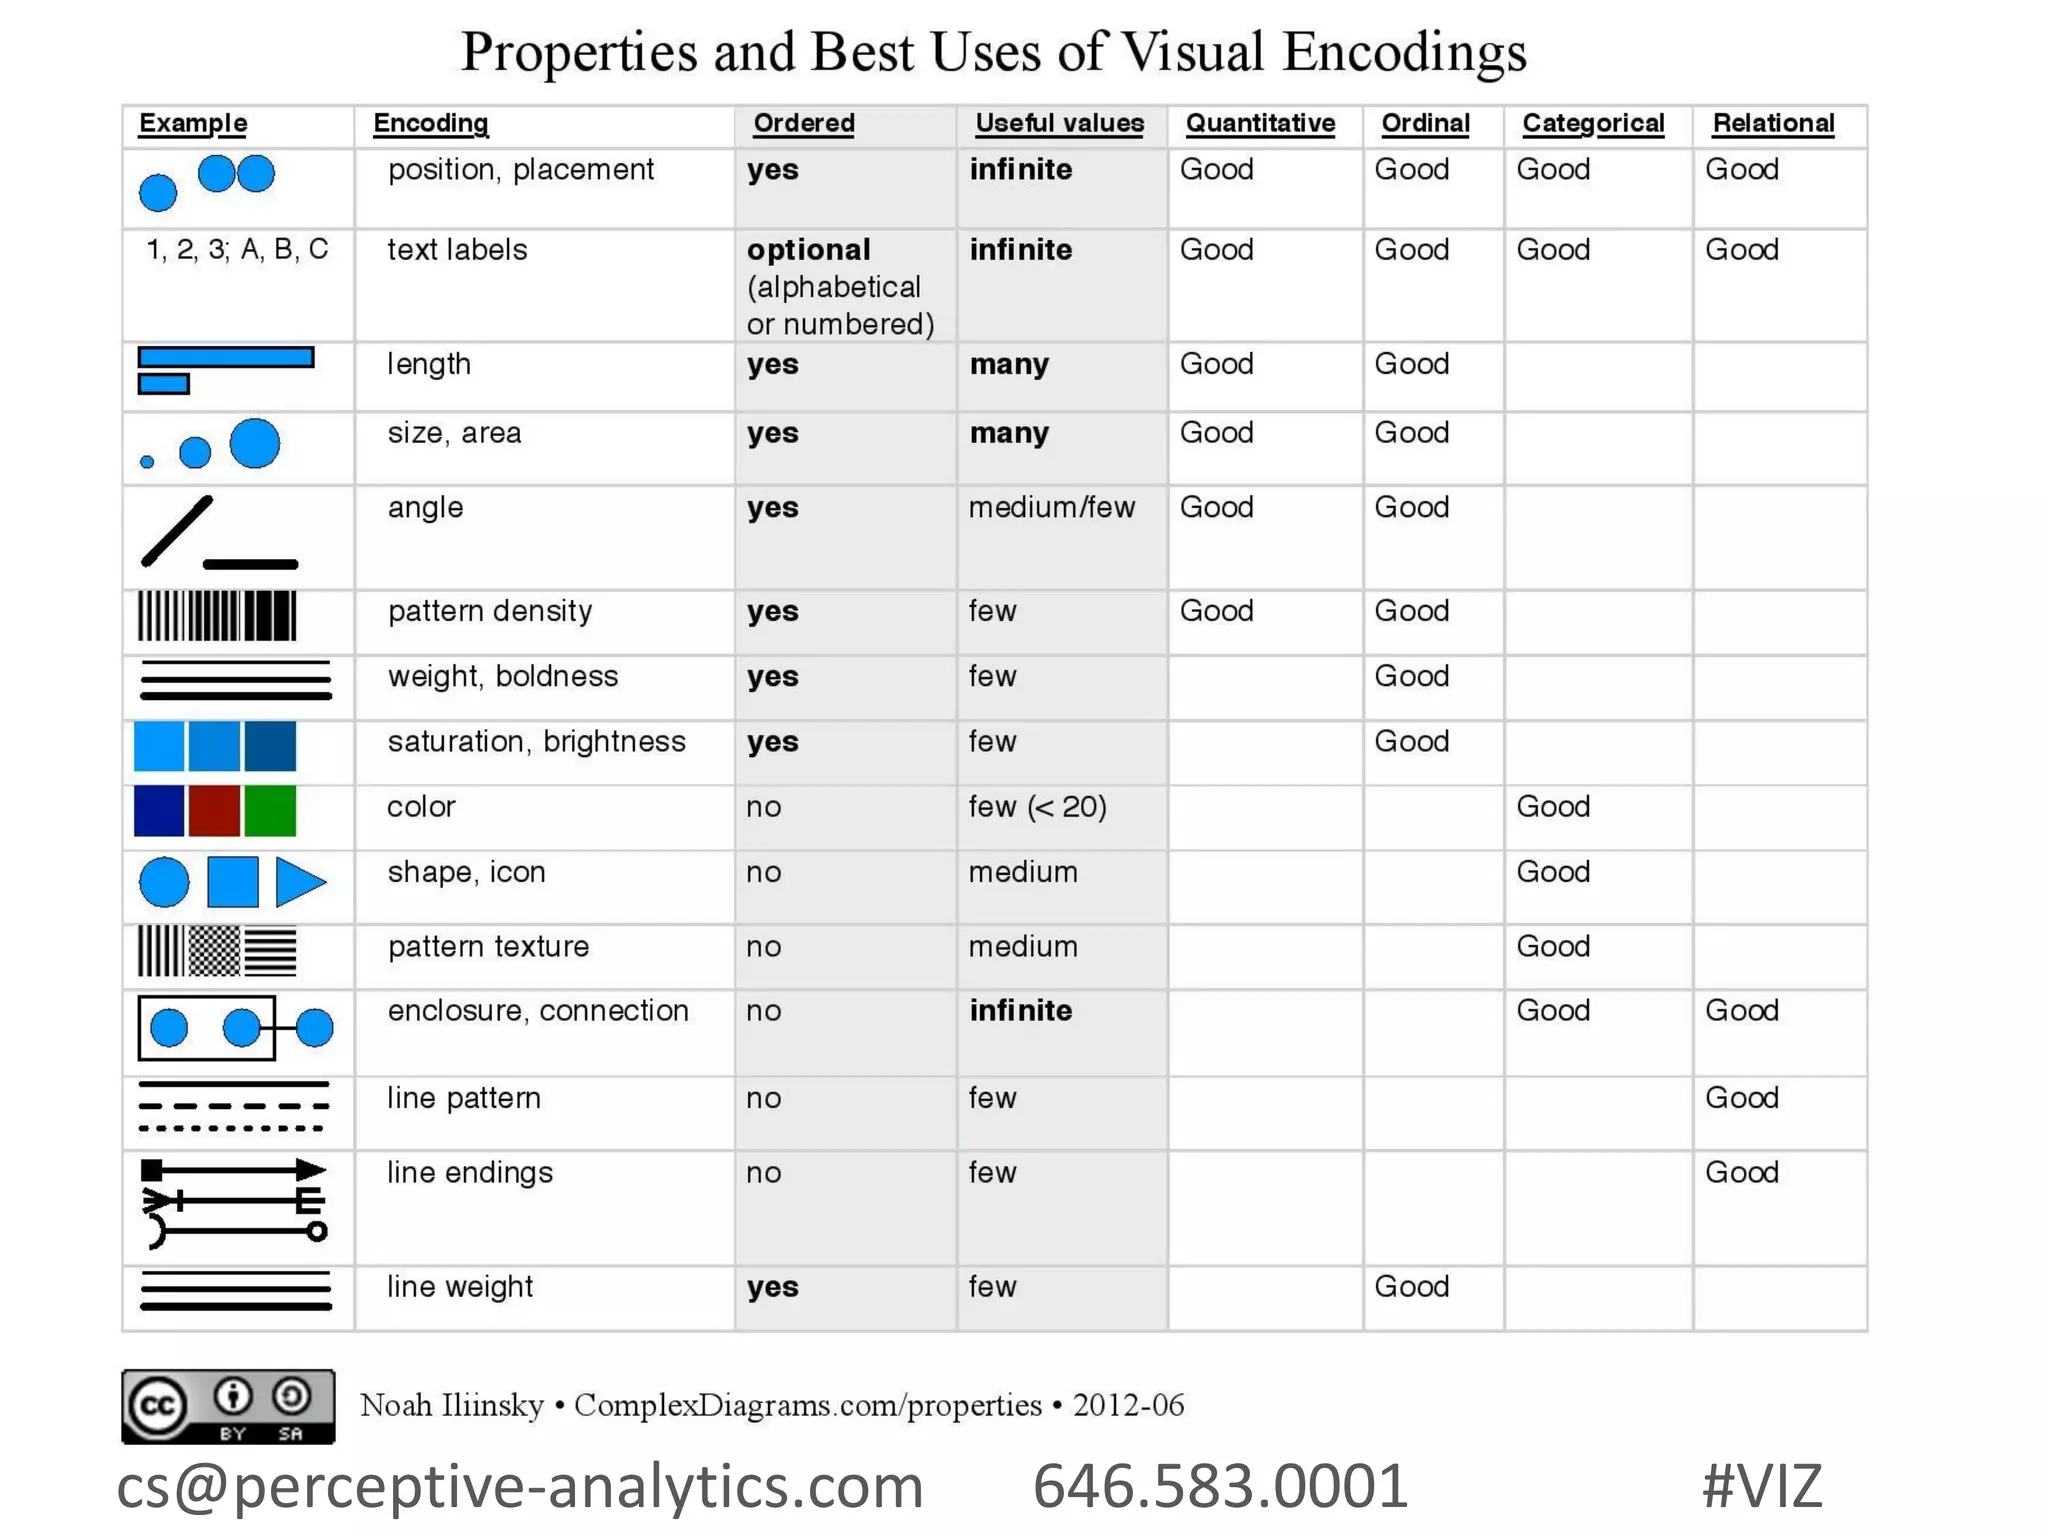
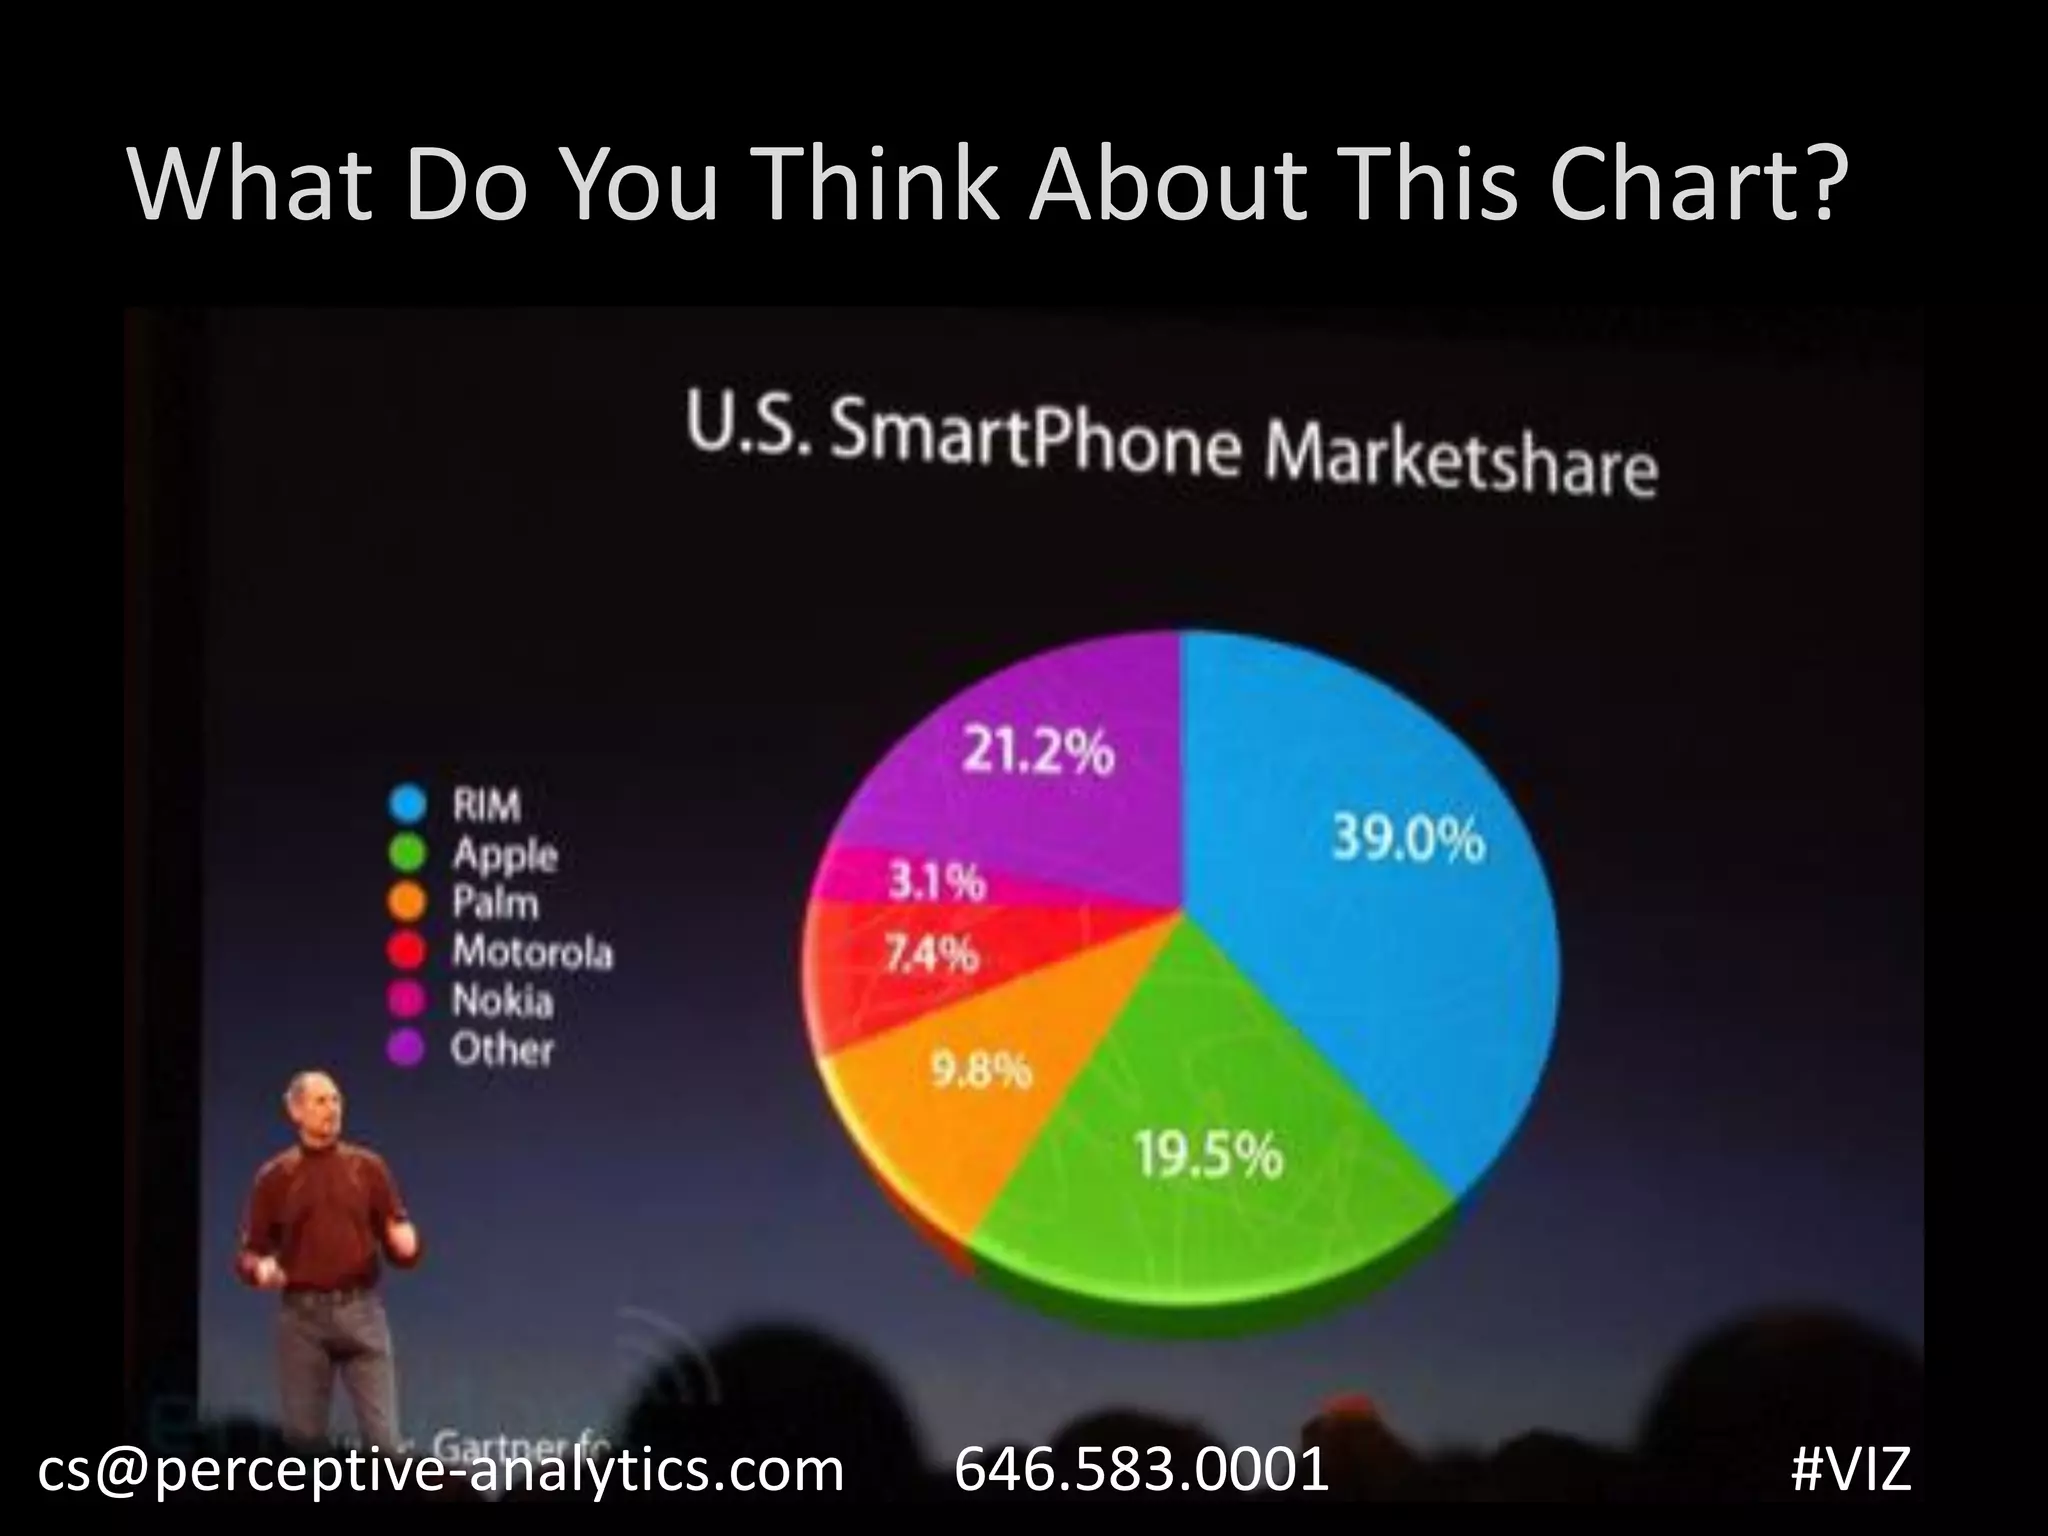
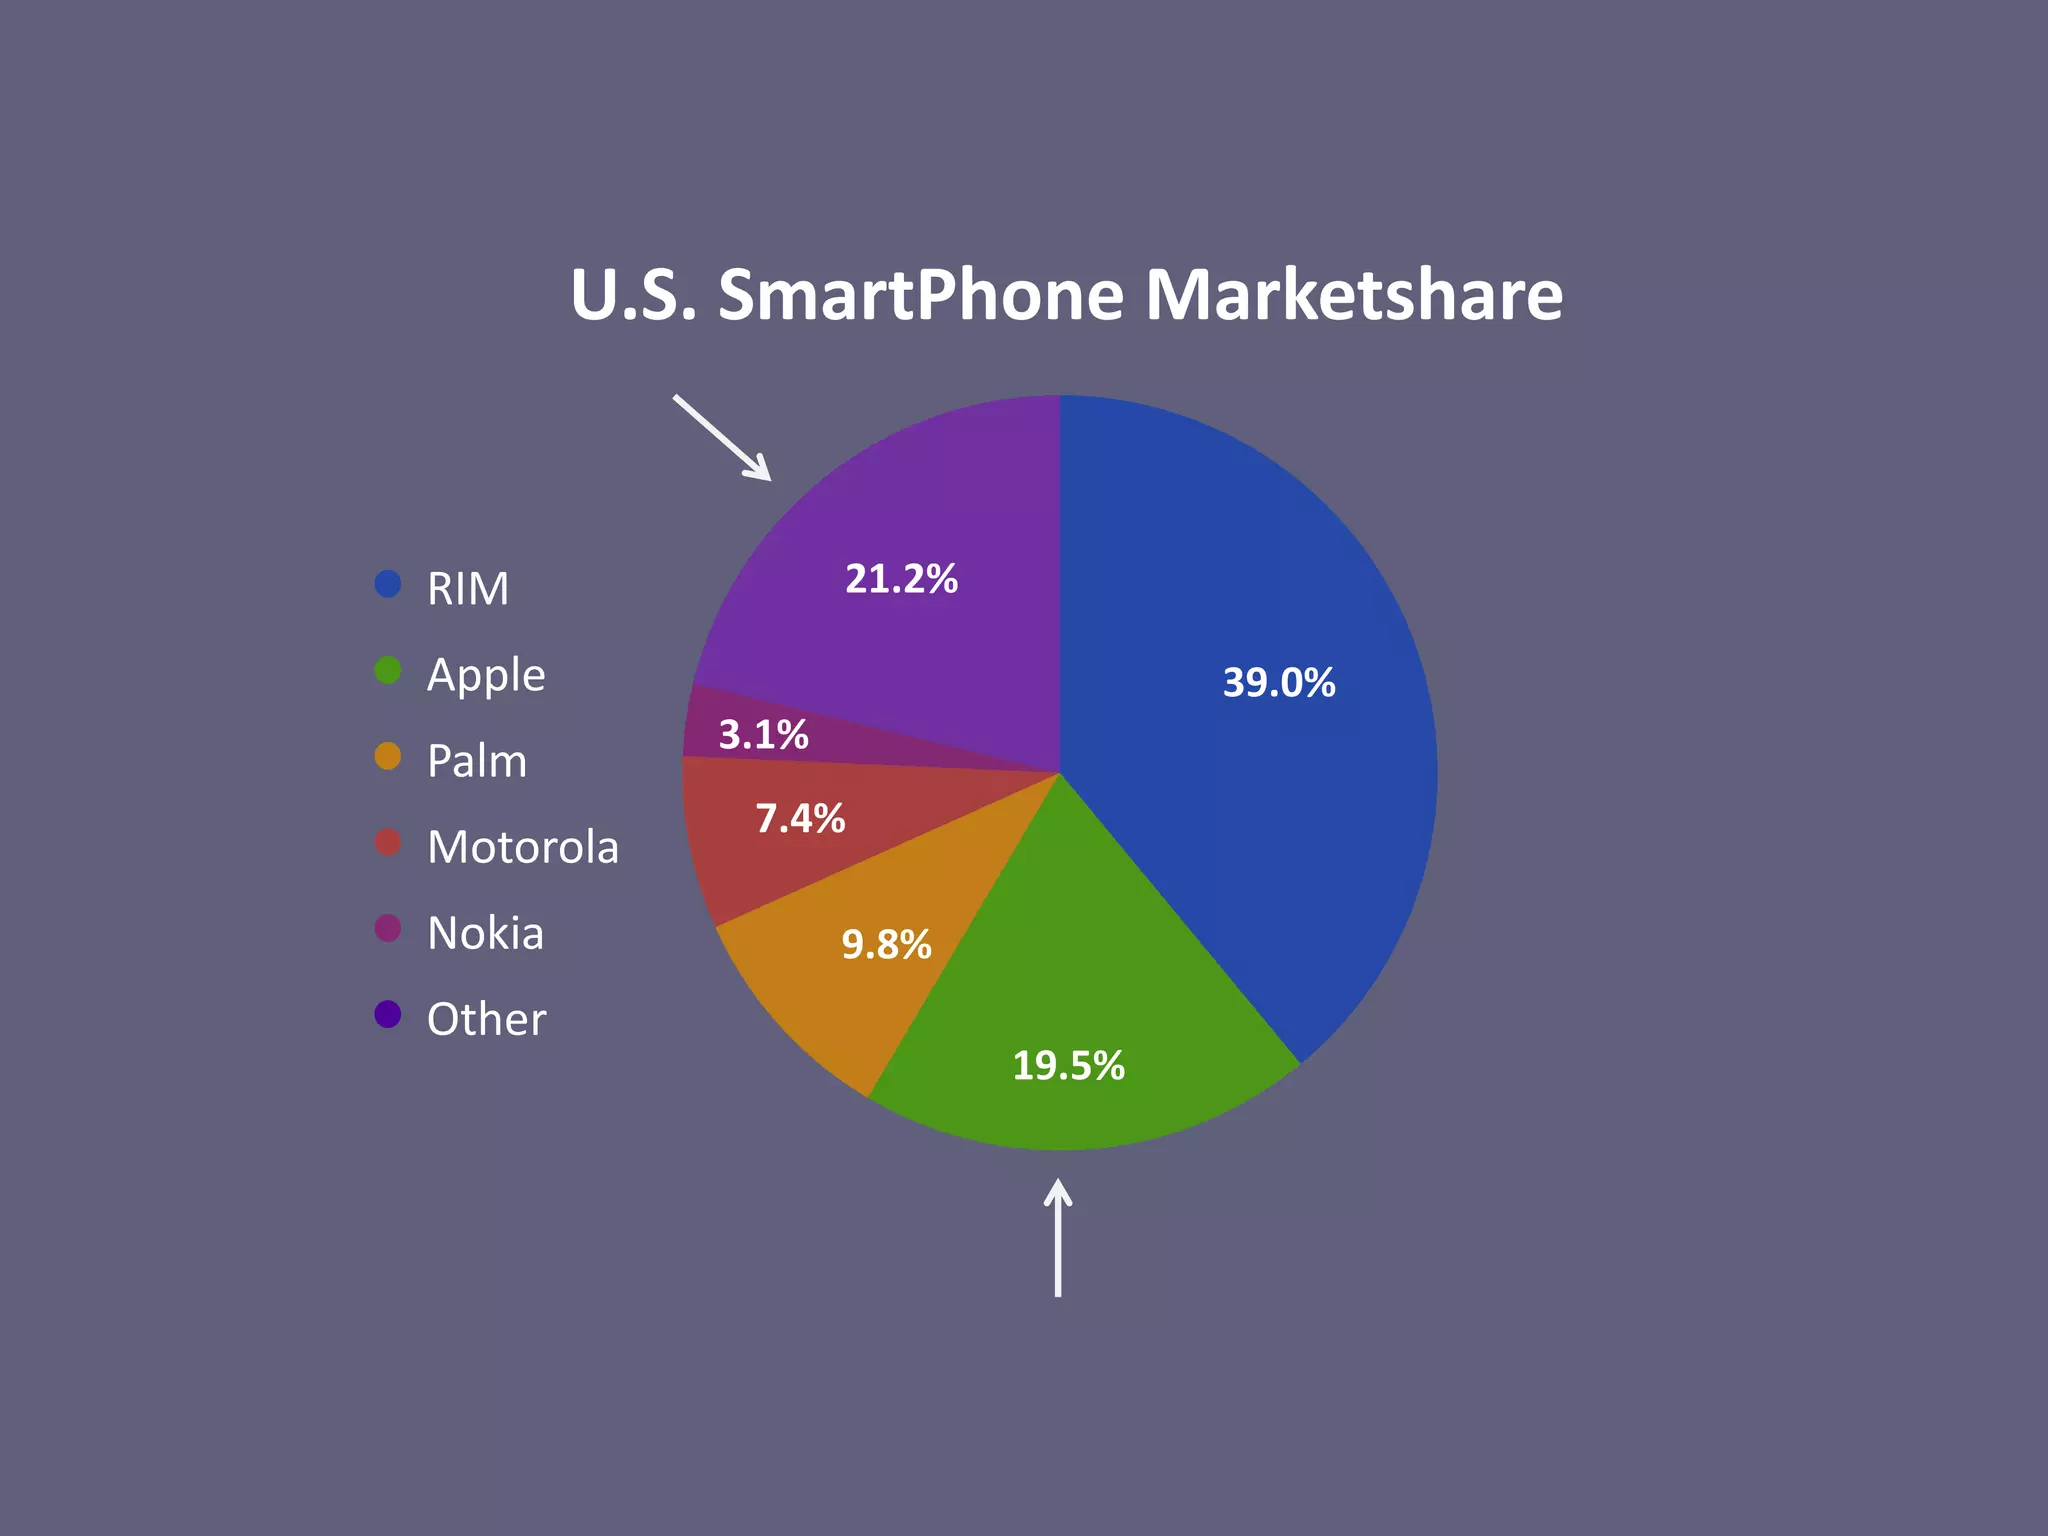
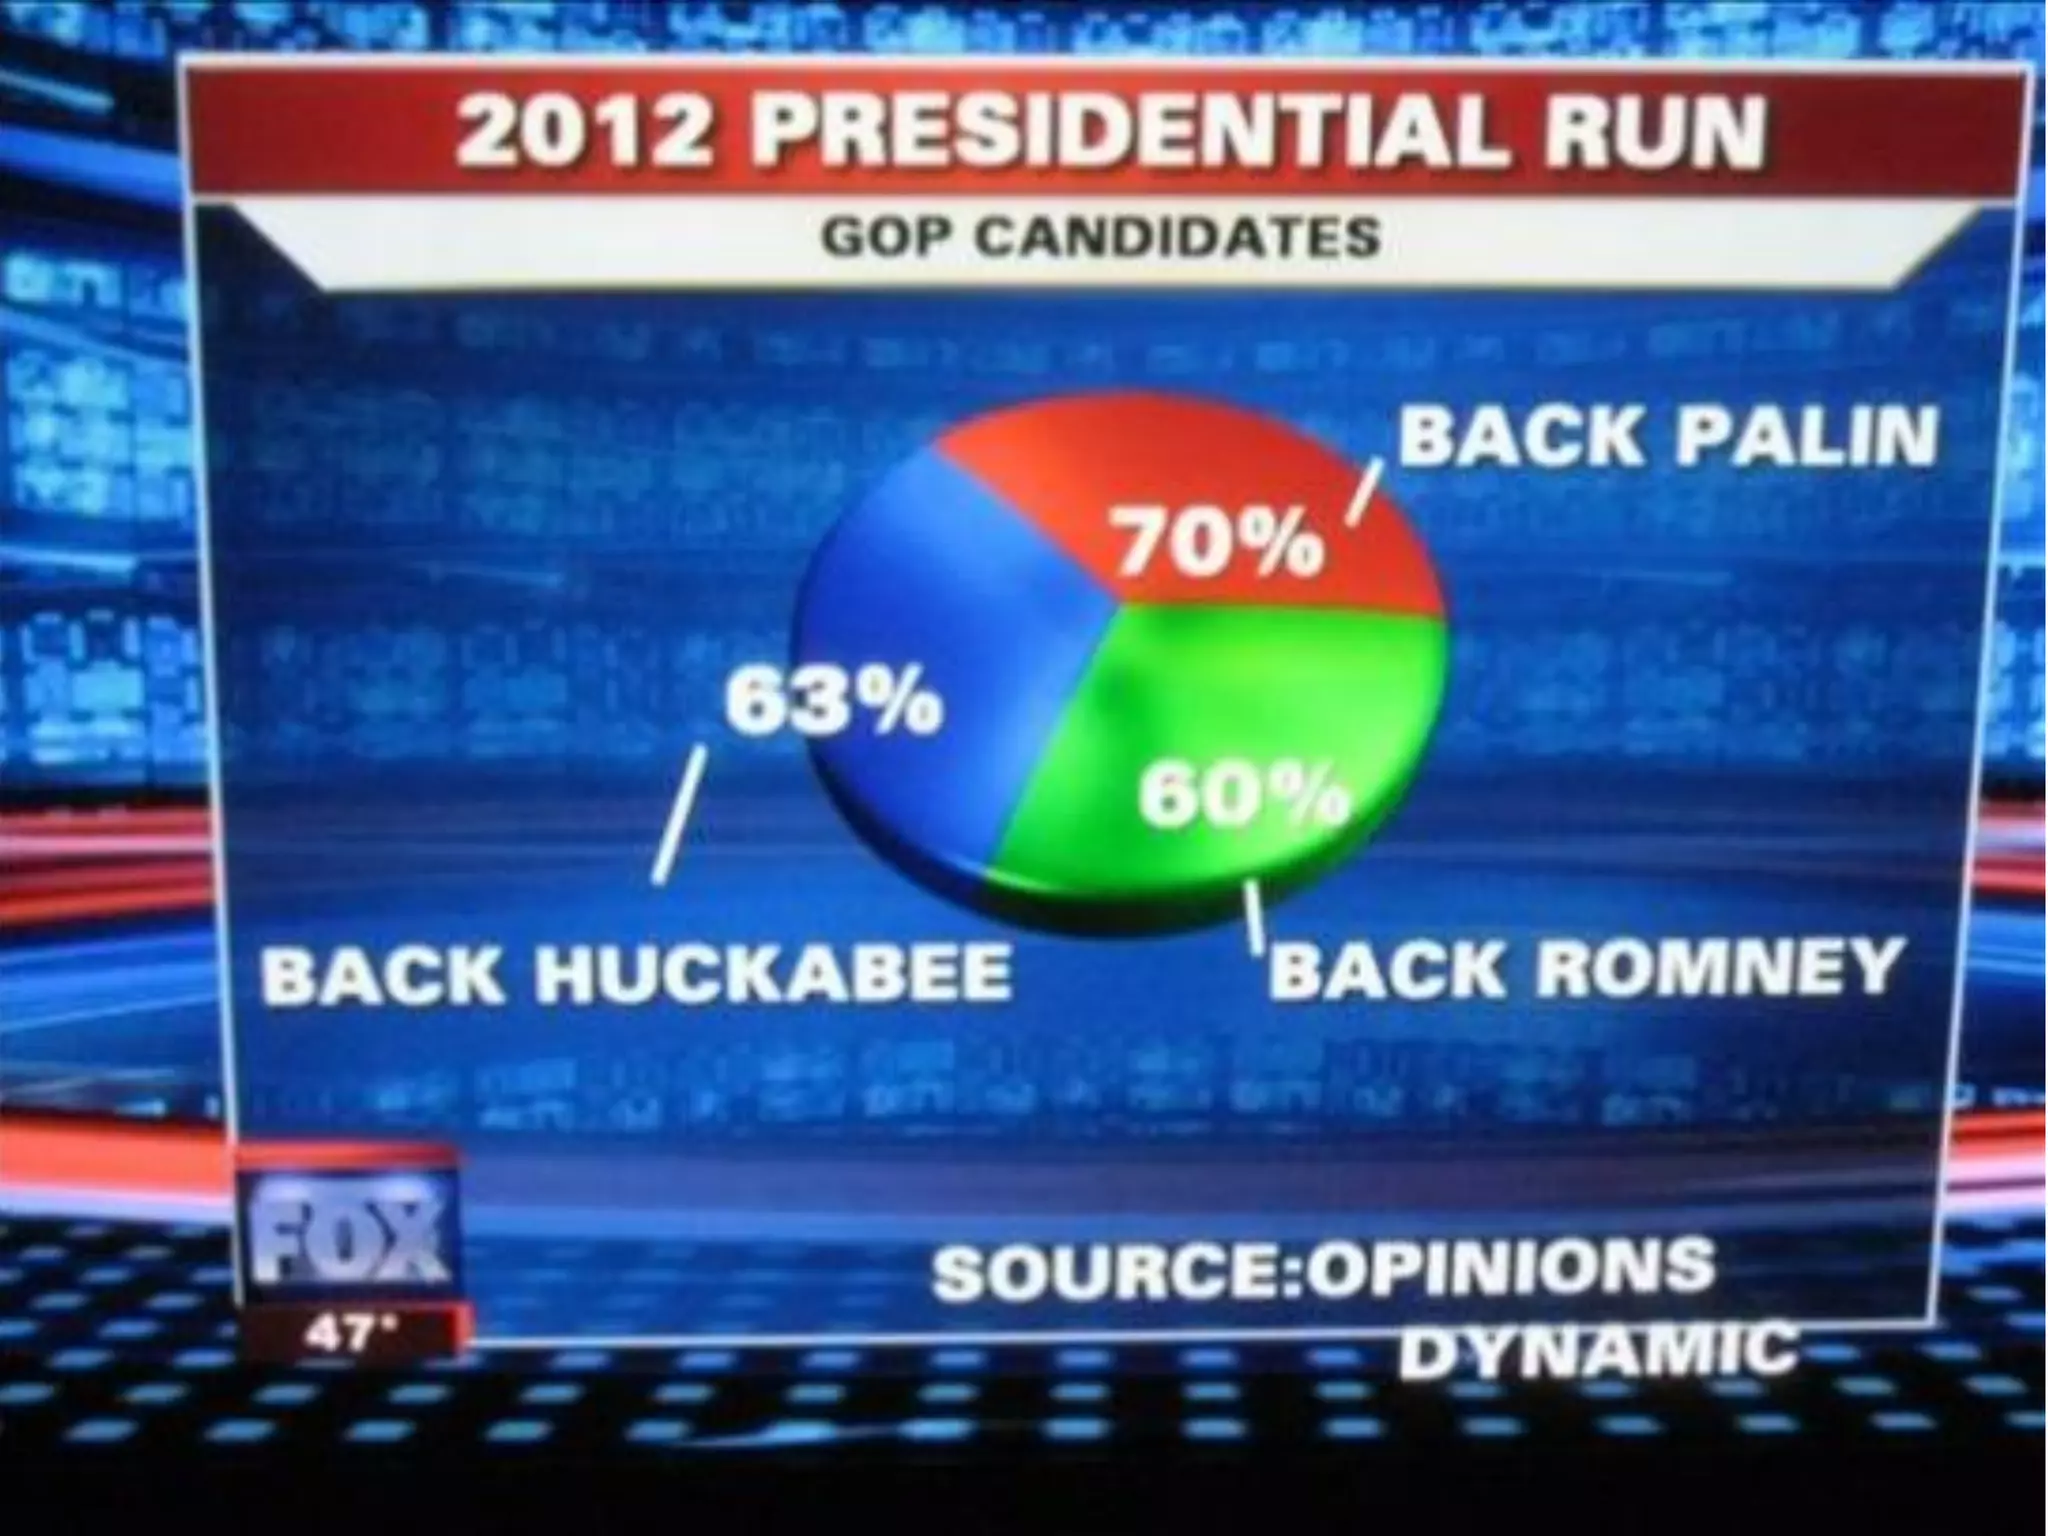
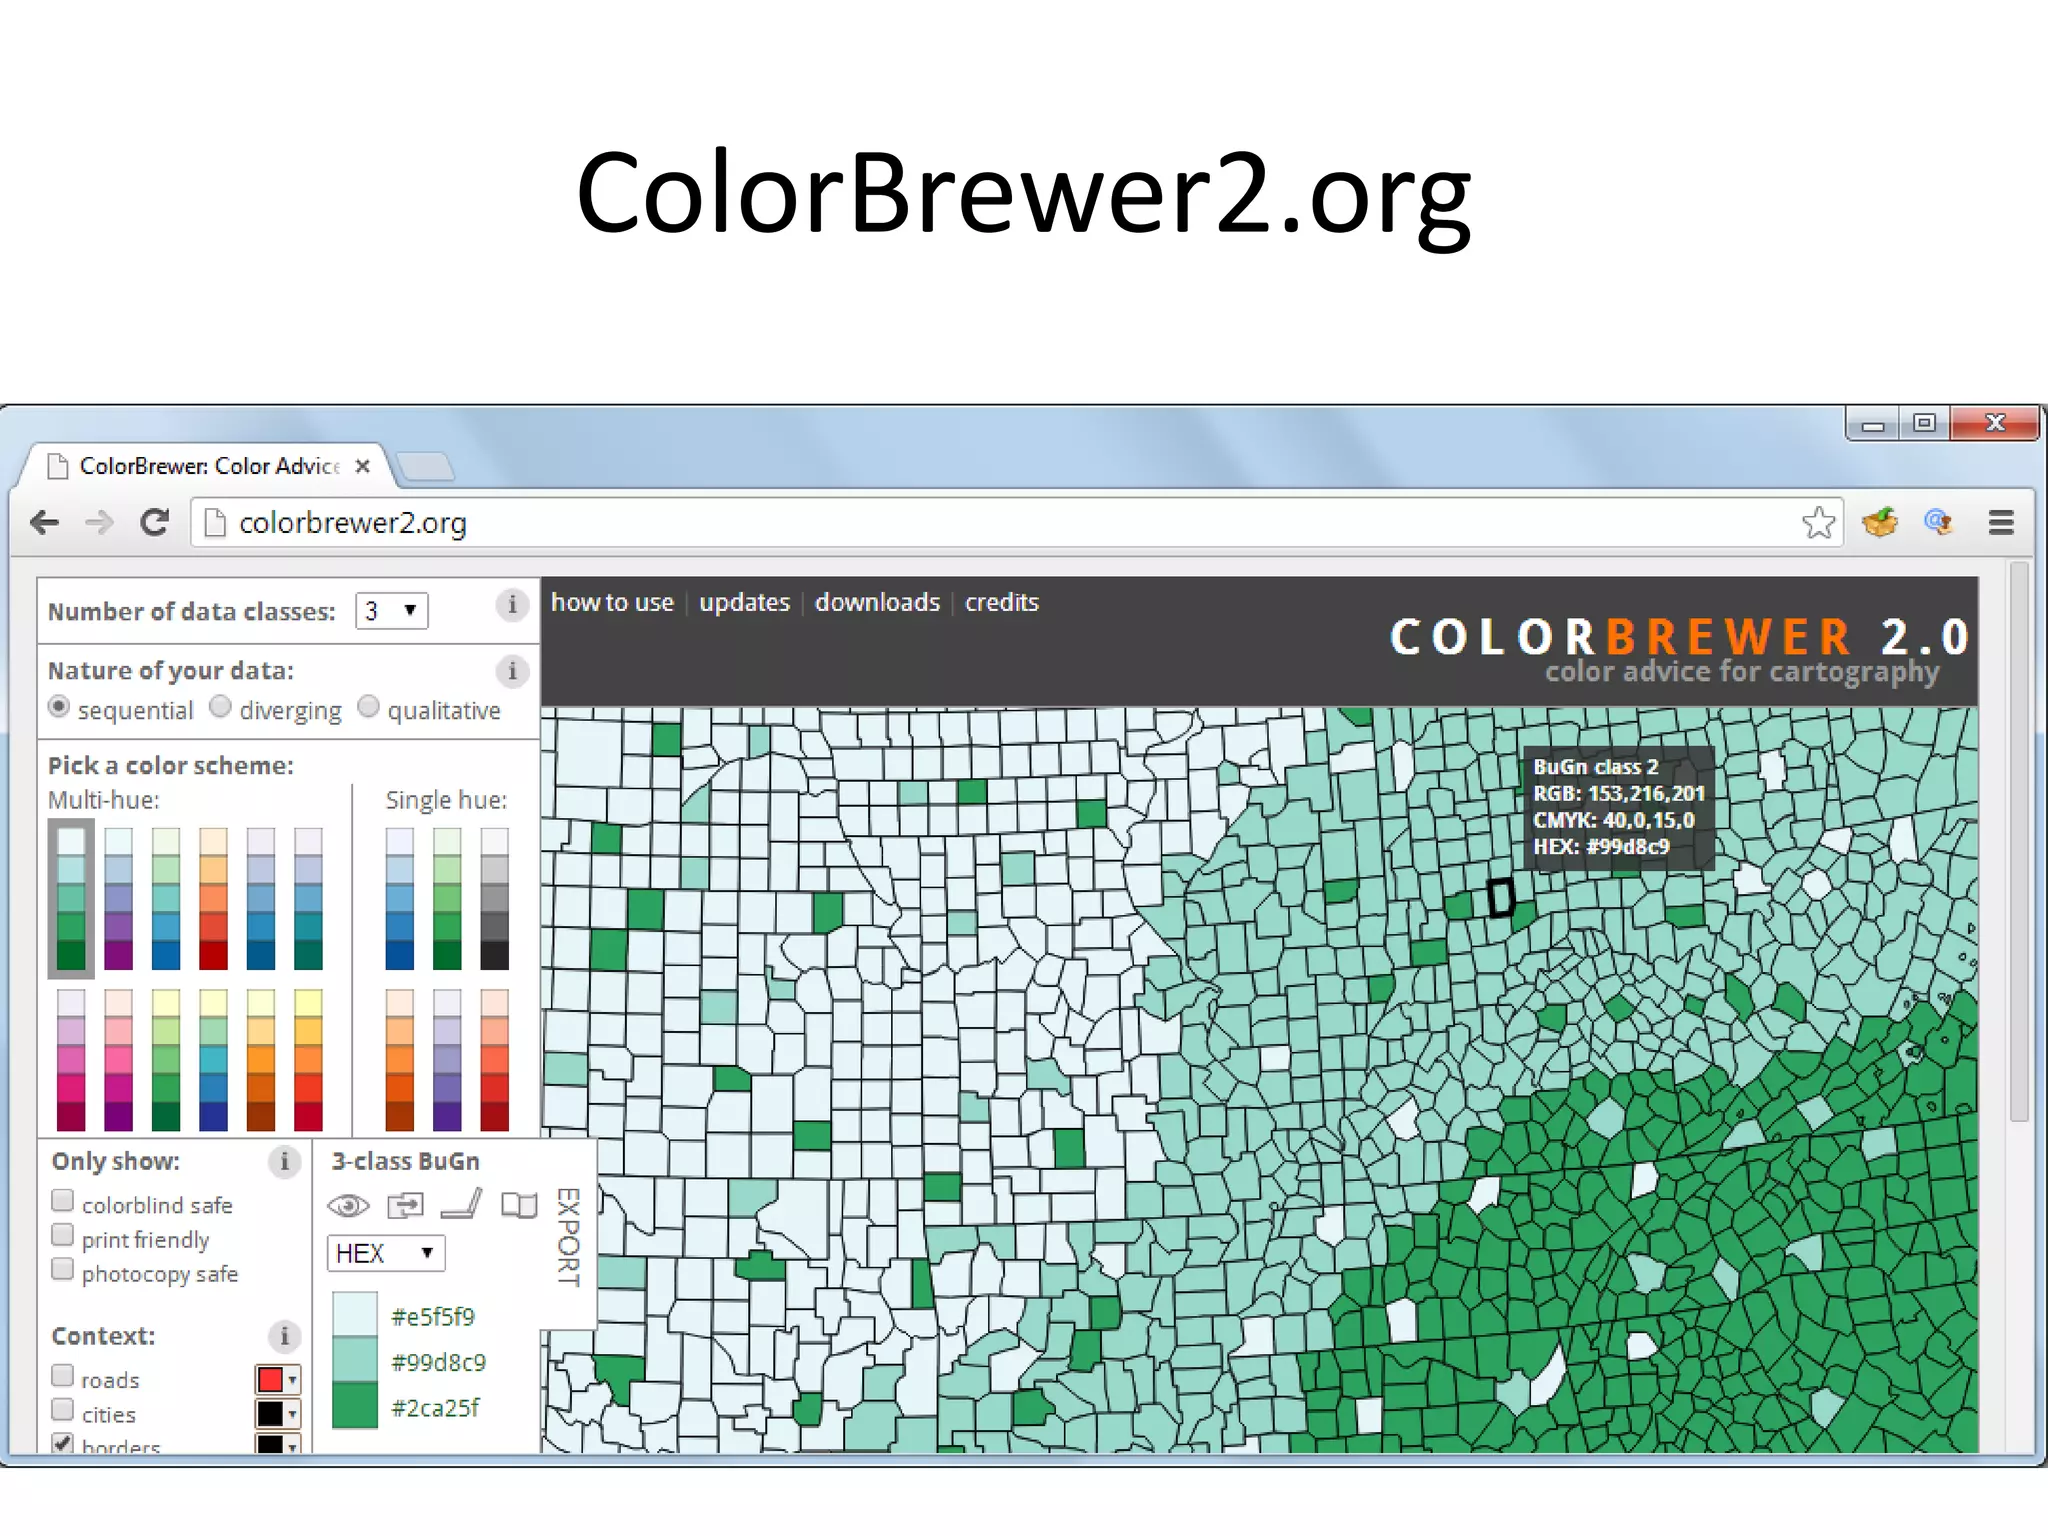
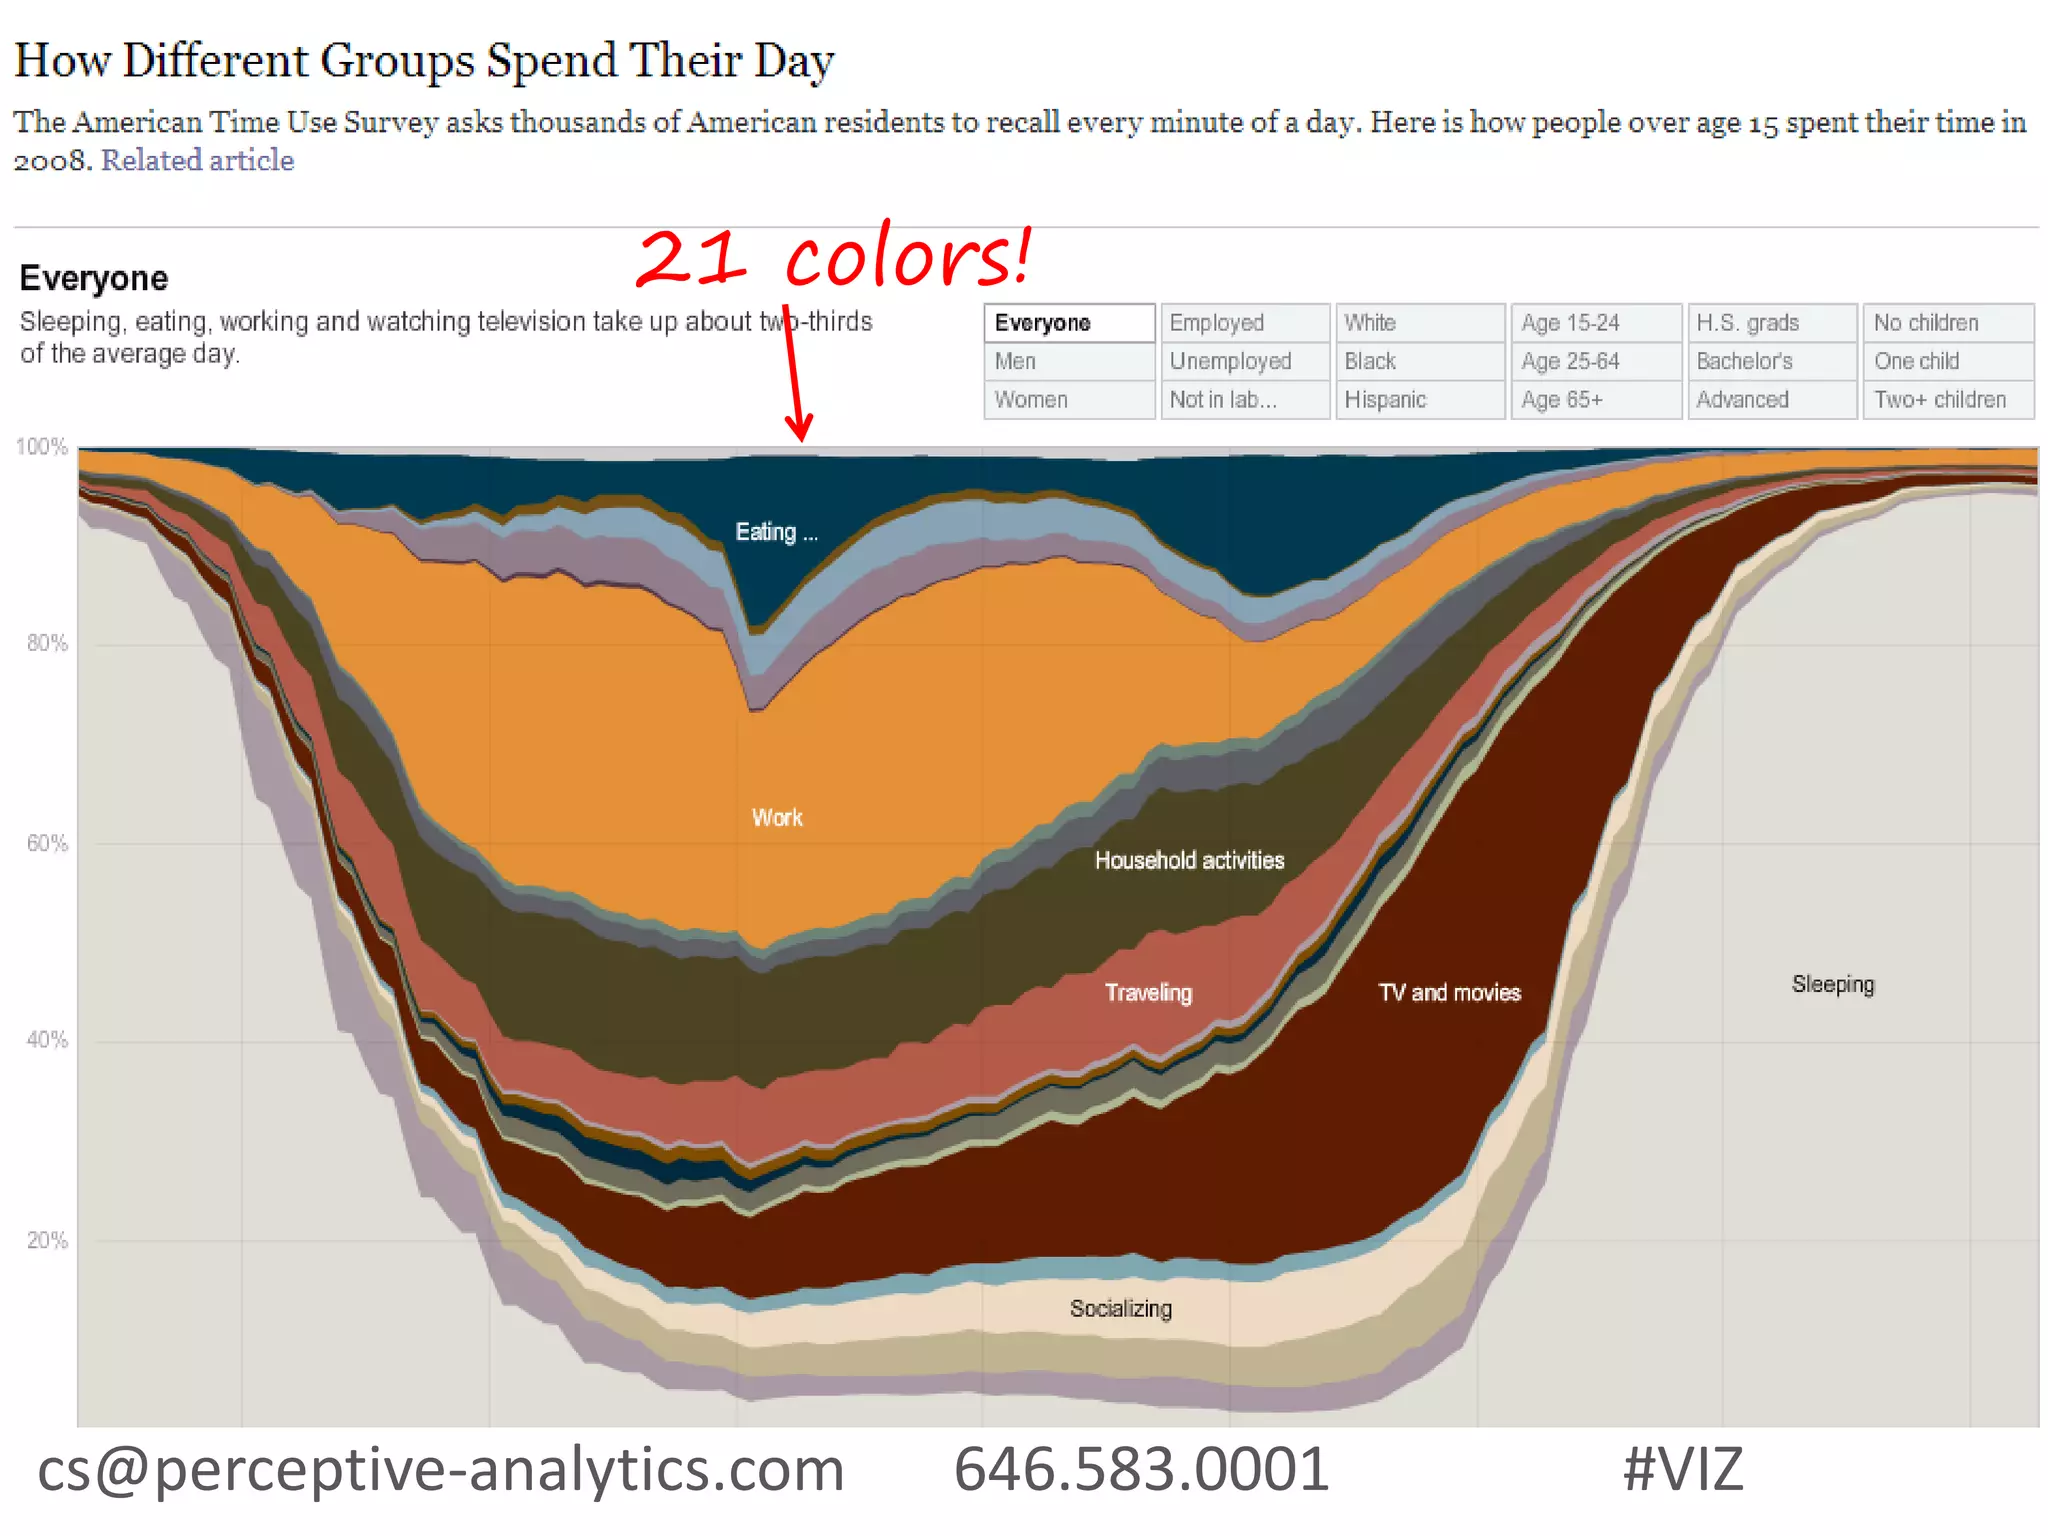
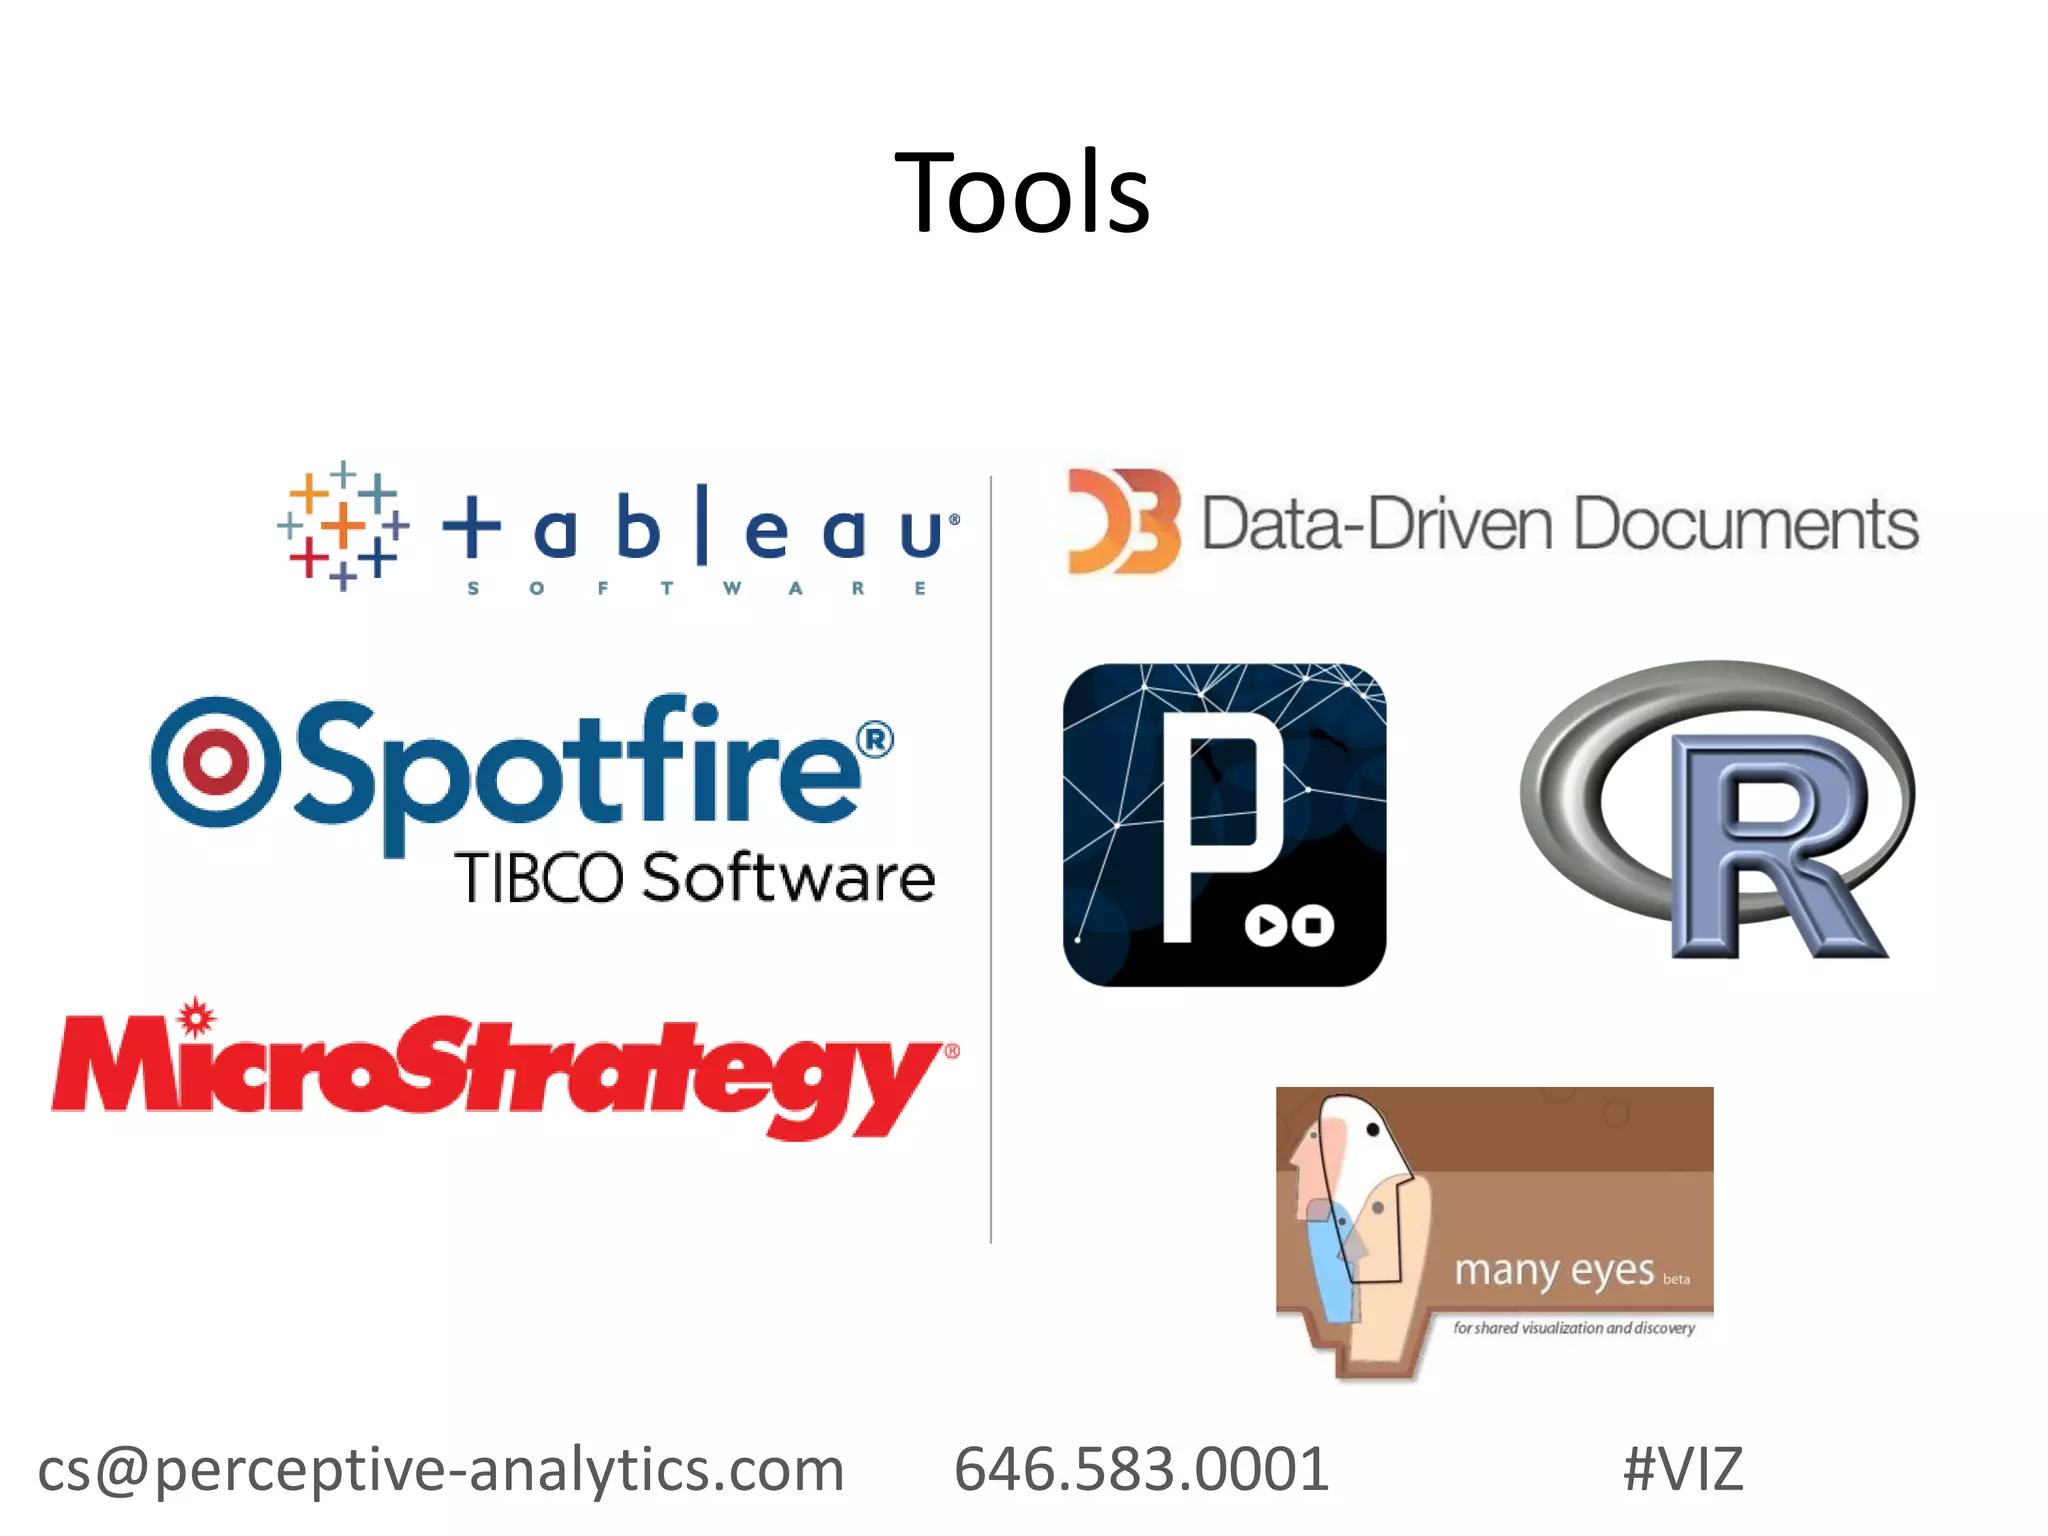
How to Unlock Value in Data Using
Data Visualizations [#VIZ]
Chaitanya Sagar “CS”
cs@perceptive-analytics.com
646.583.0001
Data Analytics Spreadsheet Solutions|
2
New York HyderabadSan Bruno Boston
Analytics
Spreadsheet
Solutions
Our Services
3
Spreadsheet Applications
Contract Negotiation
Litigation Modeling
Decision Support Tools
Dashboards
Reporting
Simulations
Financial Modeling
Analytics
Spreadsheet
Solutions
Data Visualizations
Marketing
Marketing Mix Modeling Price Promotion Analysis Catalogue Optimization
Segmentation Web Analytics Churn Analysis
Risk Management
Credit Risk Management Liquidity Risk Management Capital Allocation Analysis
Collateral Management Fraud Detection
Supply Chain
Inventory Optimization Demand Analytics Distribution Network Optimization
Sourcing Analytics Freight Lane Analytics
Verticals
Banking, Financial Services and Insurance
Consumer Packaged Goods
Retail
Our Services
4
Location Strategy to Improve
Effectiveness of a Branch Network
perceptive-analytics.com/tag/case-study/
Reinventing Coupons: Strategies for
Successful Coupon Campaign
perceptive-analytics.com/tag/case-study/
Data Visualizations
Kina, Inc. is a hi-tech company based in Silicon valley. The company’s operations were growing and wanted to track the
cash flows in end-to-end business process. The CFO of the company wanted to project future cash requirements.
A comprehensive financial model which integrated the working of different departments was built. The model
performed scenario analysis at various levels of sales and inventory investments to estimate the cash requirement. This
model was presented to the executive board of XYZ, Inc.
Financial Forecasting Tool for a Silicon Valley Startup
Cash Position
Is the company investing
or accruing cash?
Net Margin
Is business profitable?
Net Sales
How fast are
revenues increasing?
Avg. Selling Price
Is the average sales price picking
up?
Overview
PicyHoriaVarlan
cs@perceptive-analytics.com 646.583.0001 #VIZ 9
The need for visualizations
How visualizations help unlock value
How to build visualizations
-Purpose
-Design
Tools
Q&A
Which Industry Do You Work In?
• Banking, Financial Services and
Insurance
• Management Consulting
• Retail and CPG
• Information Technology
• Others
cs@perceptive-analytics.com 646.583.0001 #VIZ 10
Which Function Do You Work In?
• Analytics / BI
• Sales and Marketing
• Operations / Human Resources
• Finance
• IT
cs@perceptive-analytics.com 646.583.0001 #VIZ 11
The Need for Visualizations
Our Needs Outgrew Charts
More data!
high dimensional
ˠ
Humans are Visual
Brain can absorb large amounts of information
and find patterns (and deviations!)
PicbyDanFoy
●
X X X X X X X X X
X X X X X X X X X
X X X X X X X X X
X X X X X X X X X
X X X X X X X X X
X X X X X X X X X
X X X X X X X X X
X X X X X X X X X
X X X X X X X X X
X X X X X X X X X
X X X X X X X X X
X X X X X X X X X
X X X X X X X X X
X X X X X X X X X
X X X X X X X X X
X X X X X X X X X
X X X X X X X X X
X X X X X X X X X
X X X X X X X X X
X X X X X X X X X
X X X X X X X X X
X X X X X X X X X
X X X X X X X X X
X X X X X X X X X
X X X X X X X X X
X X X X X X X X X
X X X X X X X X X
X X X X X X X X X
X X X X X X X X X
X X X X X X X X X
X X X X X X X X X
X X X X X X X X X
X X X X X X X X X
X X X X X X X X X
X X X X X X X X X
X X X X X X X X X
X X X X X X X X X
X X X X X X X X X
X X X X X X X X X
X X X X X X X X X
X X X X X X X X X
X X X X X X X X X
“Mind is a Pattern-Matching Machine”
Edward De Bono
Mechanism of the Mind (1969)
x y x y x y x y
10 8.04 10 9.14 10 7.46 8 6.58
8 6.95 8 8.14 8 6.77 8 5.76
13 7.58 13 8.74 13 12.74 8 7.71
9 8.81 9 8.77 9 7.11 8 8.84
11 8.33 11 9.26 11 7.81 8 8.47
14 9.96 14 8.1 14 8.84 8 7.04
6 7.24 6 6.13 6 6.08 8 5.25
4 4.26 4 3.1 4 5.39 19 12.5
12 10.84 12 9.13 12 8.15 8 5.56
7 4.82 7 7.26 7 6.42 8 7.91
5 5.68 5 4.74 5 5.73 8 6.89
Mean 9 7.5 9 7.5 9 7.5 9 7.5
Variance 11 4.122 11 4.122 11 4.122 11 4.122
Correlation
Linear Regression y = 3.00 + 0.500x y = 3.00 + 0.500x y = 3.00 + 0.500x y = 3.00 + 0.500x
Anscombe's Quartet
I II III IV
0.816 0.816 0.816 0.816
Anscombe’s Quartet
How are the Data Sets Different?
• All four data sets are identical
• Distribution could be different
• Median and Mode could be different
• No comment
Statistics May Hide Something
Statistics and bikinis show a lot,
but not everything.
- Toby Harrah
American baseball player
Where do Data Visualizations Fit
in Data Analytics Process?
Acquire Data
Clean Data
Explore Data
Data
Modeling
Insights
Communicate
Where does Data Visualization Fit in Data Analytics
Process?
cs@perceptive-analytics.com 646.583.0001 #VIZ
How Visualizations Help Unlock
Value
Make Sense of Vast Data Quickly
Elicit Questions You Did Not Ask Before
What should we do to
make India a land of equal
opportunity for all, free of
prejudice and
discrimination?
- Ratan Tata
Sample Responses
• @amitagarwal08 @RNTata2000 what can a
common.man do to change india..it all depends on
government n big people like u sir with gr8 respect..
• @bangaarm @RNTata2000 Budget 2012: This year is
Tax Holiday. No income tax on your earnings. This is to
bring back all the black money to India
• @sri_v22 @RNTata2000 1. Kill corruption 2. Electoral
reforms so that honest ple can get into politics 3.
Media & activists should increase their role
• @joseaaa @RNTata2000 Can't be articulated with 140
characters. Quality education for the masses is magic
potion that can address most of the problem.
Better politics?
Corruption?
Family planning?!
Fix capitalism
Fix Education
Fix legal system
Elicit Questions You Did Not Ask Before
Discover New Data Relationships
Show Others What You See
http://guns.periscopic.com
How to Create Visualizations
Data
Analyst
Tool
Insights
Data
Analyst
Tool
Domain /
Situation
Imagination
Purpose Design
cs@perceptive-analytics.com 646.583.0001 #VIZ 46
Purpose
PicbyMerviEskelinen
TasksAudience Answers
cs@perceptive-analytics.com 646.583.0001 #VIZ 47
Process
• Understand your goals
• Determine the most important dimensions of
your data
• Determine key data relationships
• Show data close to reality e.g. maps, time lines
etc.
• Choose encoding wisely “Function first, suave
next”
• Choose colors to communicate well
Visual Encoding
cs@perceptive-analytics.com 646.583.0001 #VIZ
Design
cs@perceptive-analytics.com 646.583.0001 #VIZ 51
What Do You Think About This Chart?
cs@perceptive-analytics.com 646.583.0001 #VIZ
39.0%
19.5%
9.8%
7.4%
3.1%
21.2%
U.S. SmartPhone Marketshare
RIM
Apple
Palm
Motorola
Nokia
Other
Edward Tufte
$450
$650
$850
Jan Feb Mar Apr May Jun Jul Aug Sep Oct Nov Dec
Monthly Revenue
470
900
700
550
800
600
473
610 600
300
500
450
$0
$200
$400
$600
$800
$1,000
Jan Feb Mar Apr May Jun Jul Aug Sep Oct Nov Dec
Monthly Revenue
ThousandsThousands
Avoid Chart Junk
$0
$200
$400
$600
$800
$1,000
Jan Feb Mar Apr May Jun Jul Aug Sep Oct Nov Dec
Month
Monthly Revenue
Thousands
400
900
700
550
800
500
780
610 600
450
500
300
$0
$200
$400
$600
$800
$1,000
Jan Feb Mar Apr May Jun Jul Aug Sep Oct Nov Dec
Month
Monthly Revenue
Avoid Chart Junk
Thousands
400
900
700
550
800
500
780
610 600
450
500
300
J F M A M J J A S O N D
Monthly Revenue
Avoid Chart Junk
$0
$200
$400
$600
$800
$1,000
Jan
Feb
Mar
Apr
May
Jun
Jul
Aug
Sep
Oct
Nov
Dec
Monthly Revenue
Maximize Data Ink Ratio
Data-ink/Total ink used
Maximize Data Density
(# entries in data matrix)/(area of graphic)
Colors
cs@perceptive-analytics.com 646.583.0001 #VIZ 62
Colors
cs@perceptive-analytics.com 646.583.0001 #VIZ 63
Create Color Harmony
cs@perceptive-analytics.com 646.583.0001 #VIZ 64
Analogous
Complementary
Ideas for Color Harmony
Use colorbrewer2.org
ColorBrewer2.org
21 colors!
cs@perceptive-analytics.com 646.583.0001 #VIZ
Tools
cs@perceptive-analytics.com 646.583.0001 #VIZ
Resources
Designing Data Visualizations
Visual Encoding
complexdiagrams.com/properties
richardbrath.wordpress.com
Edward Tufte
edwardtufte.com
D3JS.org
Processing.org
Principles of Visualization Design
Q&A
How to Unlock Value from Your Data
with Visualizations
April 16, 2014
cs@perceptive-analytics.com 646.583.0001 #VIZ 70
Thank you!
71
cs@perceptive-analytics.com
+1.646.583.0001

Perceptive Analytics Unlock Value from Data Visualizations - Informs'14 Boston