
Recommended
More Related Content
What's hot
What's hot (13)
Similar to F474653.pdf
Similar to F474653.pdf (20)
More from aijbm
Recently uploaded
Recently uploaded (20)
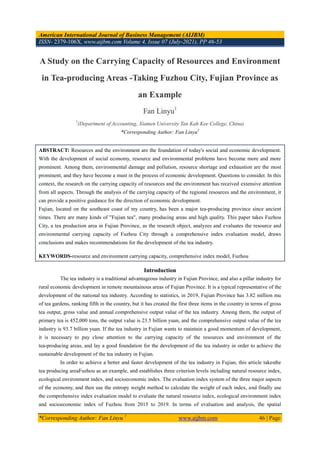
F474653.pdf
- 1. American International Journal of Business Management (AIJBM) ISSN- 2379-106X, www.aijbm.com Volume 4, Issue 07 (July-2021), PP 46-53 *Corresponding Author: Fan Linyu 1 www.aijbm.com 46 | Page A Study on the Carrying Capacity of Resources and Environment in Tea-producing Areas -Taking Fuzhou City, Fujian Province as an Example Fan Linyu1 1 (Department of Accounting, Xiamen University Tan Kah Kee College, China) *Corresponding Author: Fan Linyu1 Introduction The tea industry is a traditional advantageous industry in Fujian Province, and also a pillar industry for rural economic development in remote mountainous areas of Fujian Province. It is a typical representative of the development of the national tea industry. According to statistics, in 2019, Fujian Province has 3.82 million mu of tea gardens, ranking fifth in the country, but it has created the first three items in the country in terms of gross tea output, gross value and annual comprehensive output value of the tea industry. Among them, the output of primary tea is 452,000 tons, the output value is 23.5 billion yuan, and the comprehensive output value of the tea industry is 93.7 billion yuan. If the tea industry in Fujian wants to maintain a good momentum of development, it is necessary to pay close attention to the carrying capacity of the resources and environment of the tea-producing areas, and lay a good foundation for the development of the tea industry in order to achieve the sustainable development of the tea industry in Fujian. In order to achieve a better and faster development of the tea industry in Fujian, this article takesthe tea producing areaFuzhou as an example, and establishes three criterion levels including natural resource index, ecological environment index, and socioeconomic index. The evaluation index system of the three major aspects of the economy, and then use the entropy weight method to calculate the weight of each index, and finally use the comprehensive index evaluation model to evaluate the natural resource index, ecological environment index and socioeconomic index of Fuzhou from 2015 to 2019. In terms of evaluation and analysis, the spatial ABSTRACT: Resources and the environment are the foundation of today's social and economic development. With the development of social economy, resource and environmental problems have become more and more prominent. Among them, environmental damage and pollution, resource shortage and exhaustion are the most prominent, and they have become a must in the process of economic development. Questions to consider. In this context, the research on the carrying capacity of resources and the environment has received extensive attention from all aspects. Through the analysis of the carrying capacity of the regional resources and the environment, it can provide a positive guidance for the direction of economic development. Fujian, located on the southeast coast of my country, has been a major tea-producing province since ancient times. There are many kinds of "Fujian tea", many producing areas and high quality. This paper takes Fuzhou City, a tea production area in Fujian Province, as the research object, analyzes and evaluates the resource and environmental carrying capacity of Fuzhou City through a comprehensive index evaluation model, draws conclusions and makes recommendations for the development of the tea industry. KEYWORDS-resource and environment carrying capacity, comprehensive index model, Fuzhou
- 2. A Study on the Carrying Capacity of Resources and Environment in Tea-producing..... *Corresponding Author: Fan Linyu 1 www.aijbm.com 47 | Page hierarchical distribution map of Fuzhou's resource and environmental carrying capacity was obtained, and relevant suggestions for the development of Fuzhou's tea industry were given based on the analysis results. I. Concept definition 1.1 Environmental carrying capacity Environmental carrying capacity, sometimes also called environmental carrying capacity, environmental carrying capacity, and environmental population capacity. Refers to the number of humans and the total amount of human activities that an environmental system can undertake under certain conditions. It includes not only the various tangible and intangible resources provided by the natural environment, but also the natural environment to accommodate and digest human waste. Ability. When the demand for resources exceeds the carrying capacity of the environment, serious environmental problems will occur, such as famine, decline in land fertility, shortage of water resources, and soil salinization. Similarly, the development of agricultural technology has changed the environmental carrying capacity of mankind in most ecosystems. 1.2Resource carrying capacity Resource carrying capacity refers to the environment in which we live. When human activities are within a certain range, it can continuously meet human needs through self-regulation and improvement. But when a certain limit is exceeded, the entire system will collapse. This maximum is the resource carrying capacity. The definition proposed by the United Nations Educational, Scientific and Cultural Organization: refers to the number of people continuously supported by local resources and other natural resources, intelligence, technology and other conditions in a foreseeable period, while ensuring a material living standard that meets its social and cultural standards. 1.3 Carrying capacity of resources and environment The so-called Resource Environmental Bear Capacity (Resource Environmental Bear Capacity) means that in a certain period and within a certain area, under the condition that the regional resource structure meets the needs of sustainable development, the regional environmental function still has the ability to maintain its steady-state effect. The ability of the resource environment system to withstand various social and economic activities of mankind. Resource and environmental carrying capacity is a comprehensive carrying capacity concept that includes resources and environmental elements. Among them, the carrying body, carrying object and carrying rate are the three basic elements of the research on the carrying capacity of resources and environment. The proposal of carrying capacity of resources and environment is closely related to carrying capacity of resources and environment. II. Construction of Fuzhou City's Resource and Environmental Carrying Capacity Index By consulting the literature and related materials on the carrying capacity of resources and environment, and summarizing, it can be divided into three main categories, namely the carrying capacity of natural resources, the carrying capacity of ecological environment and the carrying capacity of social economy. The index factors are shown as followed. 2.1 Natural Resources Index In this study, the natural resource index index selected three indicators: average precipitation, average temperature, and per capita arable land area as the natural resource index of resource and environmental endurance. According to the actual situation of tea planting and production in Fuzhou, tea trees need a lot of water during their growth. Water is an important part of tea plants. The new shoots of tea are constantly sprouting during the picking process. Therefore, it is necessary to continuously add water to maintain its growth.
- 3. A Study on the Carrying Capacity of Resources and Environment in Tea-producing..... *Corresponding Author: Fan Linyu 1 www.aijbm.com 48 | Page Therefore, the more abundant the rainfall, the more suitable for planting tea. The production of tea has great requirements for the temperature in the climate. The cultivation of tea is generally more suitable for areas with moderate temperature. Therefore, the temperature factor is also an important factor affecting the production of tea. The per capita arable land area can also reflect the status of resources related to tea planting and production, so it is also considered as an important factor for analysis. 2.2 Ecological environment index The eco-environmental index of this study selected four indicators: industrial waste-water discharge, sewage treatment rate, average fertilizer application, and agricultural pesticide application as the ecological environment index of resource and environment tolerance. Industrial waste-water will have a certain degree of impact on the ecological environment, and the sewage treatment rate can be used to indicate the degree of impact on the ecological environment to a certain extent, so it is selected as an ecological environmental indicator of resource and environmental carrying capacity. In the process of tea production and planting, the use of pesticides and fertilizers not only affects the planting and production of tea, but also has varying degrees of impact on the ecological environment, so it is used as an indicator of the ecological environment index of the carrying capacity of resources and environment. 2.3 Socioeconomic index The socioeconomic index indicators of this study selected population density, per capita gross regional product, and farmers’ per capita disposable income as the socioeconomic index of resource and environmental sustainability. Population density reflects the concentration of registered population in Fuzhou, but at the same time it is inseparable from the socioeconomic status of Fuzhou; GDP per capita is an important indicator reflecting the social economy, so it is analyzed as an important influencing factor; farmers can be allocated Income reflects the economic strength of farmers. The higher the farmers' disposable income, the higher the regional resource and environmental carrying capacity, so it is selected as a social and economic indicator of resource and environmental carrying capacity. III. Analysis of Fuzhou Resources and Environment Carrying Capacity Index 3.1 Standardization of evaluation indicators Through the calculation of the original data by the standardization method, the standardization will be compressed between [0,1], the optimal value is 1, and the worst value is 0. Regardless of whether the original data is positive or negative, it will be converted to a positive value. The result of the standardization process has a good correlation with the original data. Therefore, this study uses the range transformation method to non-dimensionalize the index system. Suppose a target U to be evaluated has m decision indicators and a decision made up of n options n m ij X ) x ( (i=1,2,...m; j=1,2,...n). For the matrix X, the method of range transformation can be used to perform non-dimensional processing on a single index. Calculation formula of positive correlation index: ij ij ij ij ij x x x x x f min max min ) ( (1≤i≤n,i≤j≤m) Negative correlation index calculation formula:
- 4. A Study on the Carrying Capacity of Resources and Environment in Tea-producing..... *Corresponding Author: Fan Linyu 1 www.aijbm.com 49 | Page ij ij ij ij ij x x x x x f min max max ) ( (1≤i≤n,i≤j≤m) Among them, the formula ) ( ij x f is the data value after the indicator data is dimensionless; xij is the data value before the indicator data is infinite tempered; min xij is the minimum value of an indicator data before the indicator data is dimensionless; max xij is an indicator before the indicator data is dimensionless The maximum value of the data. 3.2 Calculation of inter-annual change data of Fuzhou's resource and environmental carrying capacity Based on the actual situation and specific problems of the development of the main tea producing areas in Fuzhou, this study selected the inter-annual changes in Fuzhou in the past five years for analysis and evaluation. Among the data sources of this study, socioeconomic data mainly comes from Fuzhou City Yearbook and National Statistical Yearbook (2015-2019); natural resource data mainly comes from Fuzhou Meteorological Bureau and Fuzhou Statistical Yearbook (2020); ecological data mainly comes from Fuzhou Environmental Protection Bureau, Fuzhou Statistical Yearbook (2020). By summarizing and sorting out various indicators of Fuzhou City, and analyzing and calculating the data, the original data are obtained as follows: Table1 Resource and environment carrying capacity index data Index 2015 2016 2017 2018 2019 C1 1137.5 1628.0 1778.2 2263.4 1478.0 C2 20.4 20.8 20.7 21.0 21.2 C3 0.0700 0.0701 0.0701 0.0614 0.0622 C4 4682 4681 4439 3696 4390 C5 86.4 86.5 90.0 93.2 89.7 C6 0.2719 0.2756 0.2755 0.3192 0.2986 C7 0.0256 0.0263 0.0246 0.0288 0.0266 C8 2206 2264 2322 2390 2304 C9 64134 69995 75259 82251 93047 C10 12910 14012 15203 16346 17865 Source is from "Fuzhou Statistical Yearbook 2020", "Fujian Statistical Yearbook" The range transformation method is used to standardize the indicators of positive and negative trends in a dimensionless manner. The results of the standardization are as follows:
- 5. A Study on the Carrying Capacity of Resources and Environment in Tea-producing..... *Corresponding Author: Fan Linyu 1 www.aijbm.com 50 | Page Table2 Carrying capacity index value after standardization Index 2015 2016 2017 2018 2019 C1 0.000 0.436 0.569 1.000 0.302 C2 0.000 0.500 0.375 0.750 1.000 C3 0.989 1.000 1.000 0.000 0.092 C4 0.000 0.001 0.247 1.000 0.296 C5 0.000 0.015 0.529 1.000 0.485 C6 1.000 0.526 0.280 0.000 0.436 C7 0.762 0.595 1.000 0.000 0.524 C8 0.000 0.315 0.630 1.000 0.533 C9 0.000 0.203 0.385 0.627 1.000 C10 0.000 0.222 0.463 0.693 1.000 3.3 Weight calculation For the weight of each secondary index, this paper uses the principle of entropy method to assign the value, and the results are as follows. Table3 The weight of each index obtained by entropy method Criterion layer Index layer Code Weights Natural Resources Index(NRI) Average precipitation C1 0.073 Average temperature C2 0.001 Per capita arable land area C3 0.005 Ecological Environment Index(EEI) Industrial waste-water discharge C4 0.010 Sewage treatment rate C5 0.001 Average fertilizer application rate C6 0.006 Pesticide use per area C7 0.004 Socio-economic index (SEI) Population density C8 0.150 GDP per capita C9 0.025
- 6. A Study on the Carrying Capacity of Resources and Environment in Tea-producing..... *Corresponding Author: Fan Linyu 1 www.aijbm.com 51 | Page Per capita disposable income of farmers C10 0.725 3.4 resource and environmental carrying capacity calculation of Fuzhou2015-2019 The resource and environmental carrying capacity of Fuzhou is calculated through the comprehensive index evaluation model, as shown in the following table: Table4 Adjusted index value Year NRI EEI SEI CI 2015 0.0049 0.0078 0.0000 0.0127 2016 0.0373 0.0032 0.2136 0.2541 2017 0.0469 0.0070 0.4397 0.2668 2018 0.0738 0.0123 0.6684 0.7545 2019 0.0235 0.0129 0.8299 0.8663 3.5 Analysis of changes in the carrying capacity of resources and environment of Fuzhou 2015-2019 According to the inter-annual change table4 data of the natural resource index, ecological environment index, and socio-economic index of Fuzhou City, a comparative analysis can be carried out, and the inter-annual change trend chart of Fuzhou City Comprehensive Index can be obtained as follows. Figure1 Resource and environmental carrying capacity index value From 2015 to 2016, precipitation continued to increase, reducing the pressure on the resources and environment in Fuzhou's agricultural areas. However, from 2017 to 2019, precipitation decreased significantly, which led to a decline in Fuzhou's natural resource index. The overall carrying capacity of Fuzhou's natural resource index showed an upward trend, with 2017 as the turning point in the middle and a slight downward trend. From 2016 to 2019, the amount of industrial waste-water discharge has been greatly reduced, and with the development of science and technology and the enhancement of environmental protection awareness, the sewage treatment rate has continued to increase. Although the use of fertilizers and pesticides on the average has 0 0.2 0.4 0.6 0.8 1 2015 2016 2017 2018 2019 NRI EEI SEI CI
- 7. A Study on the Carrying Capacity of Resources and Environment in Tea-producing..... *Corresponding Author: Fan Linyu 1 www.aijbm.com 52 | Page increased, the increase is very small, so the overall slowdown Under the pressure of the ecological environment, the ecological environment index keeps rising at this stage. It can be seen from the table that the carrying capacity of the natural resource index of Fuzhou City has shown an upward trend as a whole, and has risen steadily. Although the population density of Fuzhou City is increasing, the per capita GDP is still increasing, and the per capita disposable income is also increasing. The people's living standards continue to improve and the socio-economic index is significantly improved. The comprehensive index is the most intuitive experience of the changes in Fuzhou's resource and environmental carrying capacity. It can be seen that the comprehensive index of Fuzhou's resource and environmental carrying capacity from 2015 to 2019 shows an overall upward trend. It shows that Fuzhou pays more and more attention to protecting the ecological environment, and in the process of protecting the ecological environment, develops Fuzhou's tea agriculture in a green way, so as to realize the sustainable development of social economy and ecological environment. IV. Measures to improve Fuzhou's resource carrying capacity 4.1 Prevent and control land pollution and protect the ecological environment Looking at the "Fuzhou Statistical Yearbook" over the years, we can see that the primary factor that reduces the sustainability of land is the unreasonable discharge of human production and domestic waste. Start to reduce waste discharge, use land resources sparingly, and gradually increase awareness of land protection, so as to achieve the goal of improving the sustainability of land ecological resources. 4.2Establish a sound early warning mechanism for the carrying capacity of resources and environment The early warning mechanism is an organic combination of monitoring, tracking, and early warning. It is a protective umbrella to protect ecological resources and reduce damage while rationally developing the land resource economy. By collecting complete and objective index data, forming an efficient and unified data processing mechanism, scientifically and rationally analyzing the changes in Fuzhou’s annual resource and environmental carrying capacity, it provides a theoretical basis and practical significance for the resource and environmental carrying capacity of the main producing area ofFuzhou jasmine tea . 4.3 Establish an excellent demonstration site for resource and environmental carrying capacity The land resources of Fuzhou should be developed rationally and effectively used, especially in the development and construction of tea gardens. It is the key to improve the awareness of land resources protection of tea farmers. However, based on the uneven education level of tea farmers, it is particularly important to create excellent demonstration sites. important. 4.4 Reasonably control the use of pesticides and fertilizers to improve the quality of the ecological environment In the process of tea production and planting, the use of chemical fertilizers and pesticides will seriously affect the quality of tea production and the ecological environment of planting. For the current ecological environmental problems of tea, the use of chemical fertilizers in tea gardens should be reduced, ecological organic chemical fertilizers should be used instead of ordinary chemical fertilizers, and ecological insecticides should be used. Weeding mode, establishing a simple sustainable recycling ecosystem, building ecological tea gardens, and improving the quality of tea production. V. Deficiencies The research on the carrying capacity of resources and environment has always been a complex task, and it belongs to a multi-disciplinary and multi-field intersecting research category. As students of accounting, we are limited by our knowledge level and some data acquisition when we study and comb the literature. There
- 8. A Study on the Carrying Capacity of Resources and Environment in Tea-producing..... *Corresponding Author: Fan Linyu 1 www.aijbm.com 53 | Page are still shortcomings in this research, and further research and exploration are needed: The research plan is limited by professional time and knowledge level, and it is difficult to obtain data and information. Therefore, it only conducts an overall evaluation and analysis for the Fuzhou area; it cannot be comprehensive and comprehensive in the index selection process, and it lacks some corresponding indicators. stand by. Therefore, it is necessary to strengthen the improvement of the index system and the acquisition of data in the future research process to make the research more comprehensive, comprehensive, scientific and reasonable. References [1] Feng Zhiming,Sun Tong,Yang Yanzhao,Yan Huimin. The Progress of Resources and Environment Carrying Capacity: from Single-factor Carrying Capacity Research to Comprehensive Research[J]. Journal of Resources and Ecology,2018,9(2). [2] 吕 一 河 , 傅 微 , 李 婷 , 刘 源 鑫 . 区 域 资 源 环 境 综 合 承 载 力 研 究 进 展 与 展 望 [J]. 地 理 科 学 进 展,2018,37(01):130-138. [3] Jingyao Cheng,Kan Zhou,Dong Chen,Jie Fan. Evaluation and analysis of provincial differences in resources and environment carrying capacity in China[J]. Chinese Geographical Science,2016,26(4). [4] Ran Wang,Jinhua Cheng,Yali Zhu,Weiwei Xiong. Research on diversity of mineral resources carrying capacity in Chinese mining cities[J]. Resources Policy,2016,47. [5] 孙茜 ,张 捍 卫,张 小 虎. 河 南省 资 源环 境 承载 力 测 度及 障 碍因 素 诊断 [J]. 干 旱区 资 源与 环 境,2015,29(07):33-38. [6] 宋 艳 春 , 余 敦 . 鄱 阳 湖 生 态 经 济 区 资 源 环 境 综 合 承 载 力 评 价 [J]. 应 用 生 态 学 报,2014,25(10):2975-2984. [7] Kampeng Lei,Shaoqi Zhou. Per capita resource consumption and resource carrying capacity: A comparison of the sustainability of 17 mainstream countries[J]. Energy Policy,2012,42. *Corresponding Author: Fan Linyu1 1 (Department of Accounting, Xiamen University Tan Kah Kee College, China)