Labour Force Survey, April 2014
•
1 like•452 views

11.7% unemployment rate: Belize's Labour Force data is released for April and September each year.

Recommended
More Related Content
Viewers also liked
Viewers also liked (20)
Similar to Labour Force Survey, April 2014
Similar to Labour Force Survey, April 2014 (20)
More from Adele Ramos
More from Adele Ramos (20)
Recently uploaded
Recently uploaded (20)
Labour Force Survey, April 2014
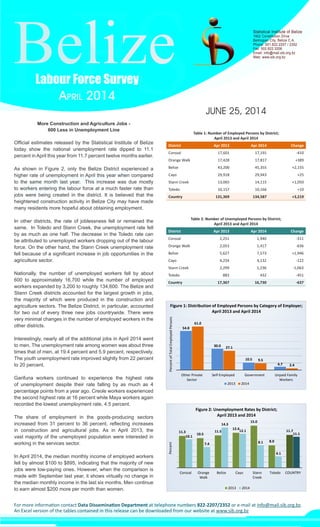
- 1. LFSBelizeLabour Force Survey Statistical Institute of Belize 1902 Constitution Drive Belmopan City, Belize C.A. Phone: 501.822.2207 / 2352 Fax: 502.822.3206 Email: info@mail.sib.org.bz Web: www.sib.org.bz April 2014 JUNE 25, 2014 Table 1: Number of Employed Persons by District; April 2013 and April 2014 District Apr 2013 Apr 2014 Change Corozal 17,601 17,191 -410 Orange Walk 17,428 17,817 +389 Belize 43,200 45,355 +2,155 Cayo 29,918 29,943 +25 Stann Creek 13,065 14,115 +1,050 Toledo 10,157 10,166 +10 Country 131,369 134,587 +3,219 More Construction and Agriculture Jobs - 600 Less in Unemployment Line Official estimates released by the Statistical Institute of Belize today show the national unemployment rate dipped to 11.1 percent in April this year from 11.7 percent twelve months earlier. As shown in Figure 2, only the Belize District experienced a higher rate of unemployment in April this year when compared to the same month last year. This increase was due mostly to workers entering the labour force at a much faster rate than jobs were being created in the district. It is believed that the heightened construction activity in Belize City may have made many residents more hopeful about obtaining employment. In other districts, the rate of joblessness fell or remained the same. In Toledo and Stann Creek, the unemployment rate fell by as much as one half. The decrease in the Toledo rate can be attributed to unemployed workers dropping out of the labour force. On the other hand, the Stann Creek unemployment rate fell because of a significant increase in job opportunities in the agriculture sector. Nationally, the number of unemployed workers fell by about 600 to approximately 16,700 while the number of employed workers expanded by 3,200 to roughly 134,600. The Belize and Stann Creek districts accounted for the largest growth in jobs, the majority of which were produced in the construction and agriculture sectors. The Belize District, in particular, accounted for two out of every three new jobs countrywide. There were very minimal changes in the number of employed workers in the other districts. Interestingly, nearly all of the additional jobs in April 2014 went to men. The unemployment rate among women was about three times that of men, at 19.4 percent and 5.9 percent, respectively. The youth unemployment rate improved slightly from 22 percent to 20 percent. Garifuna workers continued to experience the highest rate of unemployment despite their rate falling by as much as 4 percentage points from a year ago. Creole workers experienced the second highest rate at 16 percent while Maya workers again recorded the lowest unemployment rate, 4.5 percent. The share of employment in the goods-producing sectors increased from 31 percent to 36 percent, reflecting increases in construction and agricultural jobs. As in April 2013, the vast majority of the unemployed population were interested in working in the services sector. In April 2014, the median monthly income of employed workers fell by almost $100 to $895, indicating that the majority of new jobs were low-paying ones. However, when the comparison is made with September last year, it shows virtually no change in the median monthly income in the last six months. Men continue to earn almost $200 more per month than women. For more information contact Data Dissemination Department at telephone numbers 822-2207/2352 or e-mail at info@mail.sib.org.bz. An Excel version of the tables contained in this release can be downloaded from our website at www.sib.org.bz 11.3 10.5 11.5 12.4 15.0 8.0 11.7 10.1 7.4 14.3 12.1 8.1 4.1 11.1 Corozal Orange Walk Belize Cayo Stann Creek Toledo COUNTRY Percent Figure 2: Unemployment Rates by District; April 2013 and 2014 2013 2014 Table 2: Number of Unemployed Persons by District; April 2013 and April 2014 District Apr 2013 Apr 2014 Change Corozal 2,251 1,940 -311 Orange Walk 2,053 1,417 -636 Belize 5,627 7,573 +1,946 Cayo 4,254 4,132 -122 Stann Creek 2,299 1,236 -1,063 Toledo 883 432 -451 Country 17,367 16,730 -637 54.8 30.0 10.5 4.7 61.0 27.1 9.5 2.4 Other Private Sector Self-Employed Government Unpaid Family Workers PercentofTotalEmployedPersons 2013 2014 Figure 1: Distribution of Employed Persons by Category of Employer; April 2013 and April 2014