SlideShare a Scribd company logo
1 of 4
Download to read offline
Interpretation of SPSS Results
Dependent Variable
1. Gross Domestic Product
Independent Variable
1. Imports
2. Exports
3. Exchange Rate
From the following variables following statement have been made;
Statement No. 1
Ho: Export has insignificant relationship with GDP
H1: Export has significant relationship with GDP
Statement No. 2
Ho: Import has insignificant relationship with GDP
H1: Import has significant relationship with GDP
Statement No. 3
Ho: Exchange rate has insignificant relationship with GDP
H1: Exchange rate has significant relationship with GDP
Interpretation of SPSS Results
The following is the result which has been derived from the SPSS software. Our hypothesis
statement is mentioned above.
We check from the T test value (Sig.) column that whether there is a significant relation or
insignificant relation
 If T test value (Sig.) is more than 0.5 than its insignificant
 If T test value (Sig.) is less than 0.5 than its significant
In “t” column if any of the variables shows a negative sign (-) it means that there is inverse
relation other than the constant (dependent variable)
 Imports have a significant relation with Gross Domestic Product
 Exports have a significant relation with Gross Domestic Product
 Exchange Rate has an insignificant with Gross Domestic Product
Other than that Imports also show an inverse relation with your constant variable which was
GDP
Interpretation of SPSS Results
Durbin Watson and Sig. F Change
The value of Durbin Watson which comes after the analysis should fall within
 1.7 to 2.00
If the results are not coming accurate then what should we do?
1. Increase Your Sample Size
2. Transform your variables ( by taking log, anti-lo, Square root and etc)
Our Durbin-Watson over here is 1.856 which is correct
Another than this the thing which should be kept in mind is “Sig. F Change”. In most cases it
should be 0.000 but rarely it exceed 0.000 up to 0.001 not more than this
R and R square
The thing to be remembered while interpreting is that when we get our results we should firstly
see R. The value of R depends on your research but mostly the amount should be greater than
0.800 upto 0.950.
If it exceeds the above value then there is misrepresentation of your data
 Your R square depends on your R value
Interpretation of SPSS Results
Correlations
After the analysis of data when you go through your data the main thing which you have
check is the correlation between the variables which you have selected
In the Pearson Correlation section every variable when is in the same no of row and column
must represent the value which is exactly 1.000. The rest of the figures should not exceed
1.000
The chart will show a negative slope from the top to the bottom (from GDP to Exchange
Rate)
Example

More Related Content

What's hot

discriminant analysis
discriminant analysisdiscriminant analysis
discriminant analysiskrishnadk
 
Discriminant analysis using spss
Discriminant analysis using spssDiscriminant analysis using spss
Discriminant analysis using spssDr Nisha Arora
 
Application of Statistics in Business
Application of Statistics in BusinessApplication of Statistics in Business
Application of Statistics in Businesshasan faroqui
 
Strategic management ppt
Strategic management pptStrategic management ppt
Strategic management pptayushi jain
 
Attitude & Job Satisfaction
Attitude & Job SatisfactionAttitude & Job Satisfaction
Attitude & Job SatisfactionSaravanan rulez
 
Multidimensional scaling
Multidimensional scalingMultidimensional scaling
Multidimensional scalingH9460730008
 
Factor analysis ppt
Factor analysis pptFactor analysis ppt
Factor analysis pptMukesh Bisht
 
Statistics for Business Decision-making
Statistics for Business Decision-makingStatistics for Business Decision-making
Statistics for Business Decision-makingJason Martuscello
 
Attribution theory of perception
Attribution theory of perceptionAttribution theory of perception
Attribution theory of perceptionJismy James
 
Multidimensional scaling1
Multidimensional scaling1Multidimensional scaling1
Multidimensional scaling1Carlo Magno
 
Marketing Research-Factor Analysis
Marketing Research-Factor AnalysisMarketing Research-Factor Analysis
Marketing Research-Factor AnalysisArun Gupta
 
Porter's Five Forces Model
Porter's Five Forces ModelPorter's Five Forces Model
Porter's Five Forces ModelSheetal Wagh
 
BCG matrix with example
BCG matrix with exampleBCG matrix with example
BCG matrix with exampleMayur Narole
 

What's hot (20)

discriminant analysis
discriminant analysisdiscriminant analysis
discriminant analysis
 
Multicollinearity
MulticollinearityMulticollinearity
Multicollinearity
 
Discriminant analysis using spss
Discriminant analysis using spssDiscriminant analysis using spss
Discriminant analysis using spss
 
Application of Statistics in Business
Application of Statistics in BusinessApplication of Statistics in Business
Application of Statistics in Business
 
Discriminant analysis
Discriminant analysisDiscriminant analysis
Discriminant analysis
 
Strategic management ppt
Strategic management pptStrategic management ppt
Strategic management ppt
 
Attitude & Job Satisfaction
Attitude & Job SatisfactionAttitude & Job Satisfaction
Attitude & Job Satisfaction
 
Multidimensional scaling
Multidimensional scalingMultidimensional scaling
Multidimensional scaling
 
Factor analysis ppt
Factor analysis pptFactor analysis ppt
Factor analysis ppt
 
Chapter 9
Chapter 9Chapter 9
Chapter 9
 
Statistics for Business Decision-making
Statistics for Business Decision-makingStatistics for Business Decision-making
Statistics for Business Decision-making
 
Attribution theory of perception
Attribution theory of perceptionAttribution theory of perception
Attribution theory of perception
 
Multidimensional scaling1
Multidimensional scaling1Multidimensional scaling1
Multidimensional scaling1
 
Marketing Research-Factor Analysis
Marketing Research-Factor AnalysisMarketing Research-Factor Analysis
Marketing Research-Factor Analysis
 
Introduction to Marketing Research
Introduction to Marketing ResearchIntroduction to Marketing Research
Introduction to Marketing Research
 
Multicollinearity PPT
Multicollinearity PPTMulticollinearity PPT
Multicollinearity PPT
 
conjoint analysis
conjoint analysisconjoint analysis
conjoint analysis
 
Factor analysis
Factor analysisFactor analysis
Factor analysis
 
Porter's Five Forces Model
Porter's Five Forces ModelPorter's Five Forces Model
Porter's Five Forces Model
 
BCG matrix with example
BCG matrix with exampleBCG matrix with example
BCG matrix with example
 

Similar to Interpretation of SPSS Results

Week 3 Lecture 11 Regression Analysis Regression analy.docx
Week 3 Lecture 11 Regression Analysis Regression analy.docxWeek 3 Lecture 11 Regression Analysis Regression analy.docx
Week 3 Lecture 11 Regression Analysis Regression analy.docxcockekeshia
 
What is Multiple Linear Regression and How Can it be Helpful for Business Ana...
What is Multiple Linear Regression and How Can it be Helpful for Business Ana...What is Multiple Linear Regression and How Can it be Helpful for Business Ana...
What is Multiple Linear Regression and How Can it be Helpful for Business Ana...Smarten Augmented Analytics
 
Lecture8 Applied Econometrics and Economic Modeling
Lecture8 Applied Econometrics and Economic ModelingLecture8 Applied Econometrics and Economic Modeling
Lecture8 Applied Econometrics and Economic Modelingstone55
 
What is Multiple Linear Regression and How Can it be Helpful for Business Ana...
What is Multiple Linear Regression and How Can it be Helpful for Business Ana...What is Multiple Linear Regression and How Can it be Helpful for Business Ana...
What is Multiple Linear Regression and How Can it be Helpful for Business Ana...Smarten Augmented Analytics
 
BUS 308 Week 4 Lecture 3 Developing Relationships in Exc.docx
  BUS 308 Week 4 Lecture 3 Developing Relationships in Exc.docx  BUS 308 Week 4 Lecture 3 Developing Relationships in Exc.docx
BUS 308 Week 4 Lecture 3 Developing Relationships in Exc.docxShiraPrater50
 
What is Simple Linear Regression and How Can an Enterprise Use this Technique...
What is Simple Linear Regression and How Can an Enterprise Use this Technique...What is Simple Linear Regression and How Can an Enterprise Use this Technique...
What is Simple Linear Regression and How Can an Enterprise Use this Technique...Smarten Augmented Analytics
 
For this assignment, use the aschooltest.sav dataset.The d
For this assignment, use the aschooltest.sav dataset.The dFor this assignment, use the aschooltest.sav dataset.The d
For this assignment, use the aschooltest.sav dataset.The dMerrileeDelvalle969
 
BUS 308 – Week 4 Lecture 2 Interpreting Relationships .docx
BUS 308 – Week 4 Lecture 2 Interpreting Relationships .docxBUS 308 – Week 4 Lecture 2 Interpreting Relationships .docx
BUS 308 – Week 4 Lecture 2 Interpreting Relationships .docxcurwenmichaela
 
BUS 308 – Week 4 Lecture 2 Interpreting Relationships .docx
BUS 308 – Week 4 Lecture 2 Interpreting Relationships .docxBUS 308 – Week 4 Lecture 2 Interpreting Relationships .docx
BUS 308 – Week 4 Lecture 2 Interpreting Relationships .docxjasoninnes20
 
What is Simple Linear Regression and How Can an Enterprise Use this Technique...
What is Simple Linear Regression and How Can an Enterprise Use this Technique...What is Simple Linear Regression and How Can an Enterprise Use this Technique...
What is Simple Linear Regression and How Can an Enterprise Use this Technique...Smarten Augmented Analytics
 
Class,BelowistheFormatyoushouldfollowwhentypingup.docx
Class,BelowistheFormatyoushouldfollowwhentypingup.docxClass,BelowistheFormatyoushouldfollowwhentypingup.docx
Class,BelowistheFormatyoushouldfollowwhentypingup.docxmccormicknadine86
 
Empirical Finance, Jordan Stone- Linkedin
Empirical Finance, Jordan Stone- LinkedinEmpirical Finance, Jordan Stone- Linkedin
Empirical Finance, Jordan Stone- LinkedinJordan Stone
 
Two-Variable (Bivariate) RegressionIn the last unit, we covered
Two-Variable (Bivariate) RegressionIn the last unit, we covered Two-Variable (Bivariate) RegressionIn the last unit, we covered
Two-Variable (Bivariate) RegressionIn the last unit, we covered LacieKlineeb
 
Data Analysis: Descriptive Statistics
Data Analysis: Descriptive StatisticsData Analysis: Descriptive Statistics
Data Analysis: Descriptive StatisticsMahmood Ahmad
 
Business Email Rubric Subject Line Subject line clea.docx
Business Email Rubric Subject Line Subject line clea.docxBusiness Email Rubric Subject Line Subject line clea.docx
Business Email Rubric Subject Line Subject line clea.docxjasoninnes20
 
Linear regression interpretation
Linear regression interpretationLinear regression interpretation
Linear regression interpretationaswhite
 
level of measurement TED TALK.docx
level of measurement TED TALK.docxlevel of measurement TED TALK.docx
level of measurement TED TALK.docxArnsGalvezLpt
 
Week 4 Lecture 12 Significance Earlier we discussed co.docx
Week 4 Lecture 12 Significance Earlier we discussed co.docxWeek 4 Lecture 12 Significance Earlier we discussed co.docx
Week 4 Lecture 12 Significance Earlier we discussed co.docxcockekeshia
 
Measures and Strengths of AssociationRemember that while w.docx
Measures and Strengths of AssociationRemember that while w.docxMeasures and Strengths of AssociationRemember that while w.docx
Measures and Strengths of AssociationRemember that while w.docxARIV4
 

Similar to Interpretation of SPSS Results (20)

Week 3 Lecture 11 Regression Analysis Regression analy.docx
Week 3 Lecture 11 Regression Analysis Regression analy.docxWeek 3 Lecture 11 Regression Analysis Regression analy.docx
Week 3 Lecture 11 Regression Analysis Regression analy.docx
 
What is Multiple Linear Regression and How Can it be Helpful for Business Ana...
What is Multiple Linear Regression and How Can it be Helpful for Business Ana...What is Multiple Linear Regression and How Can it be Helpful for Business Ana...
What is Multiple Linear Regression and How Can it be Helpful for Business Ana...
 
Lecture8 Applied Econometrics and Economic Modeling
Lecture8 Applied Econometrics and Economic ModelingLecture8 Applied Econometrics and Economic Modeling
Lecture8 Applied Econometrics and Economic Modeling
 
What is Multiple Linear Regression and How Can it be Helpful for Business Ana...
What is Multiple Linear Regression and How Can it be Helpful for Business Ana...What is Multiple Linear Regression and How Can it be Helpful for Business Ana...
What is Multiple Linear Regression and How Can it be Helpful for Business Ana...
 
BUS 308 Week 4 Lecture 3 Developing Relationships in Exc.docx
  BUS 308 Week 4 Lecture 3 Developing Relationships in Exc.docx  BUS 308 Week 4 Lecture 3 Developing Relationships in Exc.docx
BUS 308 Week 4 Lecture 3 Developing Relationships in Exc.docx
 
What is Simple Linear Regression and How Can an Enterprise Use this Technique...
What is Simple Linear Regression and How Can an Enterprise Use this Technique...What is Simple Linear Regression and How Can an Enterprise Use this Technique...
What is Simple Linear Regression and How Can an Enterprise Use this Technique...
 
For this assignment, use the aschooltest.sav dataset.The d
For this assignment, use the aschooltest.sav dataset.The dFor this assignment, use the aschooltest.sav dataset.The d
For this assignment, use the aschooltest.sav dataset.The d
 
BUS 308 – Week 4 Lecture 2 Interpreting Relationships .docx
BUS 308 – Week 4 Lecture 2 Interpreting Relationships .docxBUS 308 – Week 4 Lecture 2 Interpreting Relationships .docx
BUS 308 – Week 4 Lecture 2 Interpreting Relationships .docx
 
BUS 308 – Week 4 Lecture 2 Interpreting Relationships .docx
BUS 308 – Week 4 Lecture 2 Interpreting Relationships .docxBUS 308 – Week 4 Lecture 2 Interpreting Relationships .docx
BUS 308 – Week 4 Lecture 2 Interpreting Relationships .docx
 
What is Simple Linear Regression and How Can an Enterprise Use this Technique...
What is Simple Linear Regression and How Can an Enterprise Use this Technique...What is Simple Linear Regression and How Can an Enterprise Use this Technique...
What is Simple Linear Regression and How Can an Enterprise Use this Technique...
 
Class,BelowistheFormatyoushouldfollowwhentypingup.docx
Class,BelowistheFormatyoushouldfollowwhentypingup.docxClass,BelowistheFormatyoushouldfollowwhentypingup.docx
Class,BelowistheFormatyoushouldfollowwhentypingup.docx
 
Empirical Finance, Jordan Stone- Linkedin
Empirical Finance, Jordan Stone- LinkedinEmpirical Finance, Jordan Stone- Linkedin
Empirical Finance, Jordan Stone- Linkedin
 
Two-Variable (Bivariate) RegressionIn the last unit, we covered
Two-Variable (Bivariate) RegressionIn the last unit, we covered Two-Variable (Bivariate) RegressionIn the last unit, we covered
Two-Variable (Bivariate) RegressionIn the last unit, we covered
 
Data Analysis: Descriptive Statistics
Data Analysis: Descriptive StatisticsData Analysis: Descriptive Statistics
Data Analysis: Descriptive Statistics
 
Business Email Rubric Subject Line Subject line clea.docx
Business Email Rubric Subject Line Subject line clea.docxBusiness Email Rubric Subject Line Subject line clea.docx
Business Email Rubric Subject Line Subject line clea.docx
 
Linear regression interpretation
Linear regression interpretationLinear regression interpretation
Linear regression interpretation
 
4. correlations
4. correlations4. correlations
4. correlations
 
level of measurement TED TALK.docx
level of measurement TED TALK.docxlevel of measurement TED TALK.docx
level of measurement TED TALK.docx
 
Week 4 Lecture 12 Significance Earlier we discussed co.docx
Week 4 Lecture 12 Significance Earlier we discussed co.docxWeek 4 Lecture 12 Significance Earlier we discussed co.docx
Week 4 Lecture 12 Significance Earlier we discussed co.docx
 
Measures and Strengths of AssociationRemember that while w.docx
Measures and Strengths of AssociationRemember that while w.docxMeasures and Strengths of AssociationRemember that while w.docx
Measures and Strengths of AssociationRemember that while w.docx
 

More from Abubakr Naushahi

An Audit on Non Current Assets of Pakistan Cables
An Audit on Non Current Assets of Pakistan CablesAn Audit on Non Current Assets of Pakistan Cables
An Audit on Non Current Assets of Pakistan CablesAbubakr Naushahi
 
Strategic Analysis of Shan Food Industries
Strategic Analysis of Shan Food IndustriesStrategic Analysis of Shan Food Industries
Strategic Analysis of Shan Food IndustriesAbubakr Naushahi
 
Pakistan Cables Investment and Portfolio Management Project
Pakistan Cables Investment and Portfolio Management ProjectPakistan Cables Investment and Portfolio Management Project
Pakistan Cables Investment and Portfolio Management ProjectAbubakr Naushahi
 
Organikos Organizational Behaviour Model
Organikos Organizational Behaviour ModelOrganikos Organizational Behaviour Model
Organikos Organizational Behaviour ModelAbubakr Naushahi
 
Financial Analysis of Pakistan Cables
Financial Analysis of Pakistan CablesFinancial Analysis of Pakistan Cables
Financial Analysis of Pakistan CablesAbubakr Naushahi
 
Feasibility of a music studio in pakistan
Feasibility of a music studio in pakistanFeasibility of a music studio in pakistan
Feasibility of a music studio in pakistanAbubakr Naushahi
 
Environmental Impacts of Industries
Environmental Impacts of IndustriesEnvironmental Impacts of Industries
Environmental Impacts of IndustriesAbubakr Naushahi
 
Application of IAS 17 on Kohinoor Company ltd
Application of IAS 17 on Kohinoor Company ltdApplication of IAS 17 on Kohinoor Company ltd
Application of IAS 17 on Kohinoor Company ltdAbubakr Naushahi
 
Application of ias 16 on pakistan cables
Application of ias 16 on pakistan cablesApplication of ias 16 on pakistan cables
Application of ias 16 on pakistan cablesAbubakr Naushahi
 
Overview of Karachi Stock Exchange
Overview of Karachi Stock ExchangeOverview of Karachi Stock Exchange
Overview of Karachi Stock ExchangeAbubakr Naushahi
 

More from Abubakr Naushahi (10)

An Audit on Non Current Assets of Pakistan Cables
An Audit on Non Current Assets of Pakistan CablesAn Audit on Non Current Assets of Pakistan Cables
An Audit on Non Current Assets of Pakistan Cables
 
Strategic Analysis of Shan Food Industries
Strategic Analysis of Shan Food IndustriesStrategic Analysis of Shan Food Industries
Strategic Analysis of Shan Food Industries
 
Pakistan Cables Investment and Portfolio Management Project
Pakistan Cables Investment and Portfolio Management ProjectPakistan Cables Investment and Portfolio Management Project
Pakistan Cables Investment and Portfolio Management Project
 
Organikos Organizational Behaviour Model
Organikos Organizational Behaviour ModelOrganikos Organizational Behaviour Model
Organikos Organizational Behaviour Model
 
Financial Analysis of Pakistan Cables
Financial Analysis of Pakistan CablesFinancial Analysis of Pakistan Cables
Financial Analysis of Pakistan Cables
 
Feasibility of a music studio in pakistan
Feasibility of a music studio in pakistanFeasibility of a music studio in pakistan
Feasibility of a music studio in pakistan
 
Environmental Impacts of Industries
Environmental Impacts of IndustriesEnvironmental Impacts of Industries
Environmental Impacts of Industries
 
Application of IAS 17 on Kohinoor Company ltd
Application of IAS 17 on Kohinoor Company ltdApplication of IAS 17 on Kohinoor Company ltd
Application of IAS 17 on Kohinoor Company ltd
 
Application of ias 16 on pakistan cables
Application of ias 16 on pakistan cablesApplication of ias 16 on pakistan cables
Application of ias 16 on pakistan cables
 
Overview of Karachi Stock Exchange
Overview of Karachi Stock ExchangeOverview of Karachi Stock Exchange
Overview of Karachi Stock Exchange
 

Recently uploaded

CELL CYCLE Division Science 8 quarter IV.pptx
CELL CYCLE Division Science 8 quarter IV.pptxCELL CYCLE Division Science 8 quarter IV.pptx
CELL CYCLE Division Science 8 quarter IV.pptxJiesonDelaCerna
 
Pharmacognosy Flower 3. Compositae 2023.pdf
Pharmacognosy Flower 3. Compositae 2023.pdfPharmacognosy Flower 3. Compositae 2023.pdf
Pharmacognosy Flower 3. Compositae 2023.pdfMahmoud M. Sallam
 
Full Stack Web Development Course for Beginners
Full Stack Web Development Course  for BeginnersFull Stack Web Development Course  for Beginners
Full Stack Web Development Course for BeginnersSabitha Banu
 
Difference Between Search & Browse Methods in Odoo 17
Difference Between Search & Browse Methods in Odoo 17Difference Between Search & Browse Methods in Odoo 17
Difference Between Search & Browse Methods in Odoo 17Celine George
 
Capitol Tech U Doctoral Presentation - April 2024.pptx
Capitol Tech U Doctoral Presentation - April 2024.pptxCapitol Tech U Doctoral Presentation - April 2024.pptx
Capitol Tech U Doctoral Presentation - April 2024.pptxCapitolTechU
 
call girls in Kamla Market (DELHI) 🔝 >༒9953330565🔝 genuine Escort Service 🔝✔️✔️
call girls in Kamla Market (DELHI) 🔝 >༒9953330565🔝 genuine Escort Service 🔝✔️✔️call girls in Kamla Market (DELHI) 🔝 >༒9953330565🔝 genuine Escort Service 🔝✔️✔️
call girls in Kamla Market (DELHI) 🔝 >༒9953330565🔝 genuine Escort Service 🔝✔️✔️9953056974 Low Rate Call Girls In Saket, Delhi NCR
 
Earth Day Presentation wow hello nice great
Earth Day Presentation wow hello nice greatEarth Day Presentation wow hello nice great
Earth Day Presentation wow hello nice greatYousafMalik24
 
Procuring digital preservation CAN be quick and painless with our new dynamic...
Procuring digital preservation CAN be quick and painless with our new dynamic...Procuring digital preservation CAN be quick and painless with our new dynamic...
Procuring digital preservation CAN be quick and painless with our new dynamic...Jisc
 
POINT- BIOCHEMISTRY SEM 2 ENZYMES UNIT 5.pptx
POINT- BIOCHEMISTRY SEM 2 ENZYMES UNIT 5.pptxPOINT- BIOCHEMISTRY SEM 2 ENZYMES UNIT 5.pptx
POINT- BIOCHEMISTRY SEM 2 ENZYMES UNIT 5.pptxSayali Powar
 
What is Model Inheritance in Odoo 17 ERP
What is Model Inheritance in Odoo 17 ERPWhat is Model Inheritance in Odoo 17 ERP
What is Model Inheritance in Odoo 17 ERPCeline George
 
Meghan Sutherland In Media Res Media Component
Meghan Sutherland In Media Res Media ComponentMeghan Sutherland In Media Res Media Component
Meghan Sutherland In Media Res Media ComponentInMediaRes1
 
Types of Journalistic Writing Grade 8.pptx
Types of Journalistic Writing Grade 8.pptxTypes of Journalistic Writing Grade 8.pptx
Types of Journalistic Writing Grade 8.pptxEyham Joco
 
Alper Gobel In Media Res Media Component
Alper Gobel In Media Res Media ComponentAlper Gobel In Media Res Media Component
Alper Gobel In Media Res Media ComponentInMediaRes1
 
DATA STRUCTURE AND ALGORITHM for beginners
DATA STRUCTURE AND ALGORITHM for beginnersDATA STRUCTURE AND ALGORITHM for beginners
DATA STRUCTURE AND ALGORITHM for beginnersSabitha Banu
 
ECONOMIC CONTEXT - PAPER 1 Q3: NEWSPAPERS.pptx
ECONOMIC CONTEXT - PAPER 1 Q3: NEWSPAPERS.pptxECONOMIC CONTEXT - PAPER 1 Q3: NEWSPAPERS.pptx
ECONOMIC CONTEXT - PAPER 1 Q3: NEWSPAPERS.pptxiammrhaywood
 
Employee wellbeing at the workplace.pptx
Employee wellbeing at the workplace.pptxEmployee wellbeing at the workplace.pptx
Employee wellbeing at the workplace.pptxNirmalaLoungPoorunde1
 
Proudly South Africa powerpoint Thorisha.pptx
Proudly South Africa powerpoint Thorisha.pptxProudly South Africa powerpoint Thorisha.pptx
Proudly South Africa powerpoint Thorisha.pptxthorishapillay1
 
Historical philosophical, theoretical, and legal foundations of special and i...
Historical philosophical, theoretical, and legal foundations of special and i...Historical philosophical, theoretical, and legal foundations of special and i...
Historical philosophical, theoretical, and legal foundations of special and i...jaredbarbolino94
 
How to Make a Pirate ship Primary Education.pptx
How to Make a Pirate ship Primary Education.pptxHow to Make a Pirate ship Primary Education.pptx
How to Make a Pirate ship Primary Education.pptxmanuelaromero2013
 

Recently uploaded (20)

CELL CYCLE Division Science 8 quarter IV.pptx
CELL CYCLE Division Science 8 quarter IV.pptxCELL CYCLE Division Science 8 quarter IV.pptx
CELL CYCLE Division Science 8 quarter IV.pptx
 
Pharmacognosy Flower 3. Compositae 2023.pdf
Pharmacognosy Flower 3. Compositae 2023.pdfPharmacognosy Flower 3. Compositae 2023.pdf
Pharmacognosy Flower 3. Compositae 2023.pdf
 
Full Stack Web Development Course for Beginners
Full Stack Web Development Course  for BeginnersFull Stack Web Development Course  for Beginners
Full Stack Web Development Course for Beginners
 
Difference Between Search & Browse Methods in Odoo 17
Difference Between Search & Browse Methods in Odoo 17Difference Between Search & Browse Methods in Odoo 17
Difference Between Search & Browse Methods in Odoo 17
 
Capitol Tech U Doctoral Presentation - April 2024.pptx
Capitol Tech U Doctoral Presentation - April 2024.pptxCapitol Tech U Doctoral Presentation - April 2024.pptx
Capitol Tech U Doctoral Presentation - April 2024.pptx
 
call girls in Kamla Market (DELHI) 🔝 >༒9953330565🔝 genuine Escort Service 🔝✔️✔️
call girls in Kamla Market (DELHI) 🔝 >༒9953330565🔝 genuine Escort Service 🔝✔️✔️call girls in Kamla Market (DELHI) 🔝 >༒9953330565🔝 genuine Escort Service 🔝✔️✔️
call girls in Kamla Market (DELHI) 🔝 >༒9953330565🔝 genuine Escort Service 🔝✔️✔️
 
Earth Day Presentation wow hello nice great
Earth Day Presentation wow hello nice greatEarth Day Presentation wow hello nice great
Earth Day Presentation wow hello nice great
 
Procuring digital preservation CAN be quick and painless with our new dynamic...
Procuring digital preservation CAN be quick and painless with our new dynamic...Procuring digital preservation CAN be quick and painless with our new dynamic...
Procuring digital preservation CAN be quick and painless with our new dynamic...
 
POINT- BIOCHEMISTRY SEM 2 ENZYMES UNIT 5.pptx
POINT- BIOCHEMISTRY SEM 2 ENZYMES UNIT 5.pptxPOINT- BIOCHEMISTRY SEM 2 ENZYMES UNIT 5.pptx
POINT- BIOCHEMISTRY SEM 2 ENZYMES UNIT 5.pptx
 
What is Model Inheritance in Odoo 17 ERP
What is Model Inheritance in Odoo 17 ERPWhat is Model Inheritance in Odoo 17 ERP
What is Model Inheritance in Odoo 17 ERP
 
Meghan Sutherland In Media Res Media Component
Meghan Sutherland In Media Res Media ComponentMeghan Sutherland In Media Res Media Component
Meghan Sutherland In Media Res Media Component
 
Types of Journalistic Writing Grade 8.pptx
Types of Journalistic Writing Grade 8.pptxTypes of Journalistic Writing Grade 8.pptx
Types of Journalistic Writing Grade 8.pptx
 
Alper Gobel In Media Res Media Component
Alper Gobel In Media Res Media ComponentAlper Gobel In Media Res Media Component
Alper Gobel In Media Res Media Component
 
DATA STRUCTURE AND ALGORITHM for beginners
DATA STRUCTURE AND ALGORITHM for beginnersDATA STRUCTURE AND ALGORITHM for beginners
DATA STRUCTURE AND ALGORITHM for beginners
 
ECONOMIC CONTEXT - PAPER 1 Q3: NEWSPAPERS.pptx
ECONOMIC CONTEXT - PAPER 1 Q3: NEWSPAPERS.pptxECONOMIC CONTEXT - PAPER 1 Q3: NEWSPAPERS.pptx
ECONOMIC CONTEXT - PAPER 1 Q3: NEWSPAPERS.pptx
 
Employee wellbeing at the workplace.pptx
Employee wellbeing at the workplace.pptxEmployee wellbeing at the workplace.pptx
Employee wellbeing at the workplace.pptx
 
Proudly South Africa powerpoint Thorisha.pptx
Proudly South Africa powerpoint Thorisha.pptxProudly South Africa powerpoint Thorisha.pptx
Proudly South Africa powerpoint Thorisha.pptx
 
Historical philosophical, theoretical, and legal foundations of special and i...
Historical philosophical, theoretical, and legal foundations of special and i...Historical philosophical, theoretical, and legal foundations of special and i...
Historical philosophical, theoretical, and legal foundations of special and i...
 
How to Make a Pirate ship Primary Education.pptx
How to Make a Pirate ship Primary Education.pptxHow to Make a Pirate ship Primary Education.pptx
How to Make a Pirate ship Primary Education.pptx
 
9953330565 Low Rate Call Girls In Rohini Delhi NCR
9953330565 Low Rate Call Girls In Rohini  Delhi NCR9953330565 Low Rate Call Girls In Rohini  Delhi NCR
9953330565 Low Rate Call Girls In Rohini Delhi NCR
 

Interpretation of SPSS Results

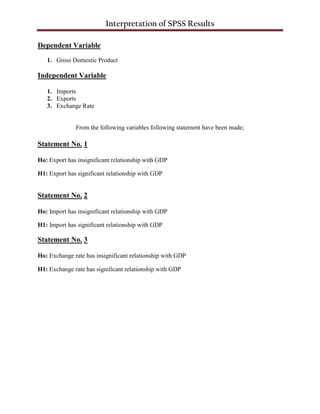
  • 1. Interpretation of SPSS Results Dependent Variable 1. Gross Domestic Product Independent Variable 1. Imports 2. Exports 3. Exchange Rate From the following variables following statement have been made; Statement No. 1 Ho: Export has insignificant relationship with GDP H1: Export has significant relationship with GDP Statement No. 2 Ho: Import has insignificant relationship with GDP H1: Import has significant relationship with GDP Statement No. 3 Ho: Exchange rate has insignificant relationship with GDP H1: Exchange rate has significant relationship with GDP
  • 2. Interpretation of SPSS Results The following is the result which has been derived from the SPSS software. Our hypothesis statement is mentioned above. We check from the T test value (Sig.) column that whether there is a significant relation or insignificant relation  If T test value (Sig.) is more than 0.5 than its insignificant  If T test value (Sig.) is less than 0.5 than its significant In “t” column if any of the variables shows a negative sign (-) it means that there is inverse relation other than the constant (dependent variable)  Imports have a significant relation with Gross Domestic Product  Exports have a significant relation with Gross Domestic Product  Exchange Rate has an insignificant with Gross Domestic Product Other than that Imports also show an inverse relation with your constant variable which was GDP
  • 3. Interpretation of SPSS Results Durbin Watson and Sig. F Change The value of Durbin Watson which comes after the analysis should fall within  1.7 to 2.00 If the results are not coming accurate then what should we do? 1. Increase Your Sample Size 2. Transform your variables ( by taking log, anti-lo, Square root and etc) Our Durbin-Watson over here is 1.856 which is correct Another than this the thing which should be kept in mind is “Sig. F Change”. In most cases it should be 0.000 but rarely it exceed 0.000 up to 0.001 not more than this R and R square The thing to be remembered while interpreting is that when we get our results we should firstly see R. The value of R depends on your research but mostly the amount should be greater than 0.800 upto 0.950. If it exceeds the above value then there is misrepresentation of your data  Your R square depends on your R value
  • 4. Interpretation of SPSS Results Correlations After the analysis of data when you go through your data the main thing which you have check is the correlation between the variables which you have selected In the Pearson Correlation section every variable when is in the same no of row and column must represent the value which is exactly 1.000. The rest of the figures should not exceed 1.000 The chart will show a negative slope from the top to the bottom (from GDP to Exchange Rate) Example