1. 1
CALCULATING THE MOMENT OF INERTIA USING A BIFILAR PENDULUM.
PERSONAL ENGAGEMENT
I recently went to hardware store with my dad to buy a simple broom, he took little while to select a broom,
as he was comparing the masses of the brooms then he chose one broom. I was a little confused why he
chose that broom so I asked him why he chose that broom. My dad (who is an engineer) said that he chose
the broom which had a lower moment inertia compared to other brooms. The other brooms had handles
made of heavier dowels which made them more difficult to swing, due to their larger mass moment of
inertia. Moreover I would often watch videos of plane crashes where they would often say the reason behind
the crash is that the lost its moment of inertia and ice skating has always fascinated me, in which ice-skaters
would keep their hands close to their body to reduce the moment of inertia so they could spin faster.
BACKGROUND INFORMATION
Moment of inertia of an object is its resistance to change in its rotational motion.
The term moment of inertia was introduced by ‘Leonhard Euler in his book Theoria motus corporum
solidorum seu rigidorum in 1765 and it is incorporated into Euler’s second law. The moment of inertia is the
quantitative measure of the rotational inertia of a body, the moment of inertia of a body depends on the axis
about which it is rotated.
The moment of inertia is given by:
𝐼 = 𝑚𝑟2
Where ‘I’ is the moment of inertia, ‘m’ is the mass and ‘r’ is the rotating distance about an axis. The SI unit
for moment of inertia is kg m² as mass is expressed as kilograms ‘kg’ and ‘r’ as meters ‘m’.
The moment of inertia of bodies that have a regular shape or a complicated structure can be calculated using
integral calculus but for a body with a mathematically indescribable shape, the moment inertia can be
calculated through an experiment. One of the ways is using a bifilar pendulum to calculate the moment of
inertia. A bifilar pendulum is a pendulum with tow equally distant strings with one end of the strings attach
to a rigid surface and other to the object of which we are going to calculate the moment of inertia.
In this experiment I chose the length of strings and the distance between the strings of the bifilar pendulum
as my independent variables. The aim of the experiment is to answer the research question: Does
manipulating the length of the strings and distance between the strings of a bifilar pendulum have an effect
on the moment of inertia determined?
The moment of inertia can be determined through a bifilar pendulum using this formula:
2. 2
𝐼 =
𝑀𝑔𝑇²𝐷²
16𝜋²L
Where I is the moment of inertia, M is the mass of the object, g is the acceleration due to gravity, T is the
rational time period of oscillation, D is the distance between the strings, and L is the length of strings.
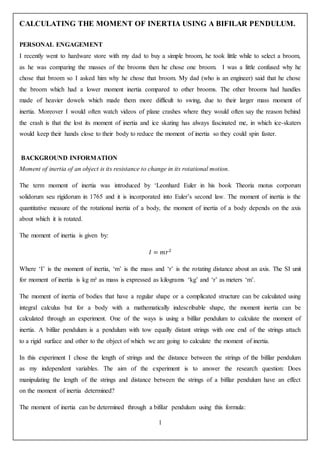
Figure 1: Bifilar Pendulum Diagram
I have decided to choose the length of strings to be : 0.20m, 0.25m, 0.30m and 0.35m, 0.40m and distance
between the strings to be : 0.05m, 0.10m, 0.15m, 0.20m and 0.25m. I will take time period for 3 oscillations
per trial and find the relationship between the distance and length of the strings with moment of inertia.
This research is significant because it can help engineers to find the optimum length and distance of the
bifilar pendulum to calculate the moment of inertia of airplanes; hence it’s a crucial part of engineering.
RESEARCH QUESTION
How does the length of the strings (0.20m, 0.25m, 0.30m and 0.35m, 0.40m) and distance between the
strings (0.05m, 0.10m, 0.15m, 0.20m and 0.25m) affect the moment of inertia (kg m²) of the glass beam in
the experimental setup of bifilar pendulum ?
HYPOTHESIS
Its hypothesized that with increase in the length of the string there will be a decrease on the moment of
inertia but with increase in the distance there will be an increase in the moment of inertia because the length
of the string is inversely proportional to the moment of inertia and the distance between the strings is
directly proportional to the moment of inertia.
SCIENTIFIC SUPPORT
In a similar experiment conducted by Matt Jardin in his research paper entitled “Optimized Measurements of
UAV Mass Moment of Inertia with a Bifilar Pendulum” and in a research paper written by Joseph Habeck
and Peter Seiler entitled “Moment of inertia estimation using bifilar pendulum” suggests that with increase
in string length there will be a decrease in the moment of inertia calculated.
3. 3
VARIABLES
Independent Variables: Shows independent varibleas
Independent
variable
Unit Description Manipulation and reason
The length of
the strings
Meter
(m)
Moment of inertia of a
mass will be measured
using a bifilar pendulum
with different string
lengths.
Strings of different lengths will be
used (0.20m,0.25m, 0.30m and
0.35m, 0.40m). This will be done to
check if string length has an affect
on the moment of inertia calculated.
The distance
between the
strings
Meter
(m)
Moment of inertia of a
mass will be measured
using a bifilar pendulum
with different distances
between the two strings.
The difference between the strings
will be : 0.05m, 0.10m, 0.15m,
0.20m and 0.25m. This will be done
to check distance between the strings
has an affect on the moment of
inertia
Dependent Variable: shows dependent variables
Dependent Variable Unit Measuring method
moment of inertia (kg m²) Moment inertia will be
measured using a bifilar
pendulum.
Controlled Variables: Variables kept constant.
Variables to controlled How and why
Mass of glass beam The same glass beam will be used throughout the experiment as
changing the weight will lead to a change in moment of inertia.
Type/Material of string The same type of string (Cotton thread.) will be used
throughout the experiment as it may affect the time period.
Stopwatch In order to ensure precision in reading same stopwatch will be
used throughout the experiment.
External factors such as: wind Fans, doors and windows will be closed to reduce errors in the
4. 4
experiment caused by wind as it can affect the rate of
oscillation.
Pressure The experiment will be conducted at atmospheric pressure.
Temperature The experiment will be conducted at room temperature. The
temperature can cause thermal expansion in the metal rod hence
causing an error in the results obtained.
MATERIALS
Material Specifications Use
2x Clamp stand - To hold a metal rod at a certain
height.
A thin metal rod Length:60cm Strings will be attached to this
Strings - A glass beam will be hanged
using this
Wooden ruler Length:100cm Uncertainty: (±0.05
cm)
To measure different string
lengths and widths
Painted Glass
beam
Mass: 36.42g , Length:30cm Its moment of inertia will be
calculated.
Electronic balance Uncertainty: (±0.1g) To measure the mass of the glass
beam
Stopwatch Uncertainty: (±0.01s) To record the time period.
Bubble level - To check if the metal rod and
glass beam are horizontally
straight.
RISK ASSESSMENT
1. Wear gloves, lab coat and safety goggles before proceeding to the experiment.
2. Handle the rigid support carefully i.e. mass added on the base of the clamp of the experimental set-up of
Bifilar Pendulum, so that it should not fall on your body.
3. Use scissor or cutter carefully while cutting the cotton string.
4. There are no environmental or ethical issues in the methodology or procedure.
PROCEDURE
1. Firstly place 2 clamp stands 50 cm apart, make sure they are in line using a ruler.
2. Then attach a thin metal rod to both the clamp stands. Check if the metal rod attached is in level
using a bubble level.
3. Then tie 2 strings of the same length (0.20m, 0.25m, 0.30m and 0.35m, 0.40m) and maintain a
distance between them of (0.05m, 0.10m, 0.15m, 0.20m and 0.25m )
5. 5
4. After that attach the glass beam to the other end of the strings, check if the glass beam is in level
using a bubble level.
5. Hold the edges of the glass beam and twist it to get the glass beam oscillating and start the
stopwatch at the extreme deflection and then count till 3 oscillations and stop the stopwatch.
6. Repeat the experiment with different lengths (0.20m, 0.25m, 0.30m and 0.35m, 0.40m) and distances
(0.05m, 0.10m, 0.15m, 0.20m and 0.25m). Take 5 trials for each length and distance for reliable and
accurate results.
7. Processing the raw data
8. Calculate the average time period for 1 oscillation.
9. Then use the formula mentioned above to calculate the moment of inertia for the glass beam.
EXPERIMENTAL SETUP
DATA COLLECTION
RAW DATA
Table 1: Raw data showing time period for a constant length of a string at different distances.
Time period (sec) for the length of the string : 0.25m
while performing 3 Oscillations
Distance
between
strings (m)
Trial
1
Trial
2
Trial
3
Trial
4
Trial
5
MeanTime for
3 oscillations
MeanTime
period(sec)
Standard
Deviation
0.05 7.57 6.13 6.04 6.52 6.39 6.53 2.18 ± 0.77 0.55
0.10 4.47 4.90 5.06 4.89 4.50 4.76 1.59±0.30 0.26
0.15 3.35 3.50 3.43 3.52 3.48 3.46 1.15±0.09 0.06
0.20 2.19 2.25 2.47 2.20 2.35 2.29 0.76±0.14 0.12
0.25 1.97 1.79 1.19 1.92 1.85 1.74 0.58±0.39 0.32
B
A
D
C
A: Thin metal rod
B: Clamp stand
C: String
D: Glass beam
6. 6
Table 2: Raw data showing time period for a constant length of a string at different distances
Time period (sec) for the length of the string : 0.30m
while performing 3 Oscillations
Distance
between
strings (m)
Trial
1
Trial
2
Trial
3
Trial
4
Trial
5
MeanTime
period for 3
oscillations
Mean
Time
Period(sec)
Standard
Deviation
0.05 12.19 12.28 11.79 12.22 11.12 11.92 3.97±0.58 0.49
0.10 5.47 5.50 5.66 5.13 5.63 5.48 1.83±0.27 0.21
0.15 3.81 3.87 3.91 3.81 3.81 3.84 1.28±0.05 0.04
0.20 3.03 2.91 2.94 2.84 2.84 2.91 0.97±0.10 0.08
0.25 2.13 2.37 2.13 2.37 2.37 2.24 0.75±0.12 0.13
Table 3: Raw data showing time period for a constant length of a string at different distances
Time period (sec) for the length of the string : 0.35m
while performing 3 Oscillations
Distance
between
strings (m)
Trial
1
Trial
2
Trial
3
Trial
4
Trial
5
MeanTime
period for 3
oscillations
MeanTime
period(sec)
Standard
deviation
0.05 13.28 13.03 13.05 12.28 13.57 13.04 4.35±0.65 0.48
0.10 6.06 6.50 6.47 6.50 6.12 6.33 2.11±0.22 0.22
0.15 4.16 3.87 3.97 4.22 4.10 4.06 1.35±0.18 0.14
0.20 3.13 3.16 2.91 2.91 3.12 3.05 1.02±0.13 0.12
0.25 2.35 2.50 2.34 2.63 2.47 2.46 0.82±0.15 0.12
Table 4: Raw data showing time period for a constant length of a string at different distances
Time period (sec) for the length of the string : 0.40m
while performing 3 Oscillations
Distance
between
strings(m)
Trial
1
Trial
2
Trial
3
Trial
4
Trial
5
MeanTime
period for 3
oscillations
MeanTime
Period(sec)
Standard
deviation
0.05 14.88 14.02 14.50 14.38 13.62 14.28 4.76±0.63 0.48
0.10 6.79 6.91 6.69 6.84 6.40 6.73 2.24±0.26 0.2
0.15 4.50 4.54 4.59 4.62 4.65 4.58 1.53±0.08 0.06
0.20 3.22 3.18 3.31 3.47 3.13 3.26 1.09±0.17 0.13
0.25 2.78 2.65 2.84 2.78 3.06 2.82 0.94±0.21 0.15
7. 7
Table 5: Raw data showing time period for a constant length of a string at different distances
Time period (sec) for the length of the string: 0.45m
while performing 3 Oscillations
Distance
between
strings(m)
Trial
1
Trial
2
Trial
3
Trial
4
Trial
5
MeanTime
period for 3
oscillations
MeanTime
period(sec)
Standard
deviation
0.05 16.37 16.22 17.03 16.84 17.35 16.76 5.59±0.57 0.467
0.10 7.34 7.60 7.09 7.50 7.56 7.42 2.47±0.26 0.21
0.15 5.04 5.09 5.00 5.03 5.09 5.05 1.68±0.04 0.04
0.20 3.72 3.62 3.56 3.56 3.54 3.60 1.20±0.09 0.07
0.25 3.13 2.78 2.75 2.90 2.79 2.87 0.96±0.19 0.16
PROCESSED DATA
Table 6: Processed data showing moment of inertia for each length (m) and distance(m) of the string.
Moment of inertia(kg m²)
Distance between
strings (m)
Length of string(m)
0.25 0.30 0.35 0.40 0.45
0.05 1.07 × 10⁻⁴
2.97 × 10⁻⁴
3.06 × 10⁻⁴
3.203 × 10⁻⁴
1.57 × 10⁻³
0.10 2.29 × 10⁻⁴
2.52 × 10⁻⁴
2.88 × 10⁻⁴
2.84 × 10⁻⁴
6.90 × 10⁻⁴
0.15 2.69 × 10⁻⁴
2.78 × 10⁻⁴
2.65 × 10⁻⁴
2.98 × 10⁻⁴
3.19 × 10⁻⁴
0.20 2.09 × 10⁻⁴
2.84 × 10⁻⁴
2.69 × 10⁻⁴
2.69 × 10⁻⁴
2.89 × 10⁻⁴
0.25 1.90 × 10⁻⁴
2.65 × 10⁻⁴
2.71 × 10⁻⁴
3.12 × 10⁻⁴
2.89 × 10⁻⁴
Data calculation
Example 1: Calculation of uncertainty
The mean time for 3 oscillations in row 3 column 7
Table 1 = Range/2
=
𝑇1+𝑇2+𝑇3+𝑇4+𝑇5
5
= (7.57-6.04)/2
=
7.57+6.13+6.04+6.52+6.39
5
= 0.77(2 decimal place)
=6.53(2 decimal place)
8. 8
Graph 1: Showing time period for all string lengths and distances between strings.
Graph 2: Showing moment of inertia for each length (m) and distance (m) of the string.
ANALYSIS
As you can see in graph 1 and graph 2 as there in increase in distance between the strings for each string
length( 0.25,0.30,0.35,0.40,0.45m) the time period is decreasing for example in graph1(and graph 3 in the
appendix) the time period for 1 oscillation for the length of the string 0.25m with 0.05m distance between
the string was 2.18 ± 0.77 seconds whereas when the distance between the strings was 0.25m the time
period for 1 oscillation was 0.58±0.39 seconds , this clearly illustrates that when distance between the
strings is increasing the time period is decreasing .When the distance is kept constant and the length is
increased , the time period for 1 oscillation increase for example in graph 1 when the distance between the
string is 0.05m the time period for strings of the length 0.25m was 2.18 ± 0.77 seconds and the time period
for the strings of the length 0.45m was 5.59±0.57 seconds , this clearly shows that increase in the length of
the string increases the time period.
0
1
2
3
4
5
6
7
0.05 0.1 0.15 0.2 0.25
Timeperiod(s)
Distance between strings(m)
Time period for different string lengths and
distance between strings
0.25
0.3
0.35
0.4
0.45
Lenght
of
strings
0
0.0005
0.001
0.0015
0.002
0.0025
0.003
0.05 0.1 0.15 0.2 0.25
Momentofinertia(kgm²)
Distance between strings (m)
0.45
0.4
0.35
0.3
0.25
Scale
X axis: 1 unit =
0.05m
Y axis: 1 unit = 1
second
Scale
X axis: 1 unit =
0.05m
Y axis: 1 unit =
0.0005 kg m²
9. 9
In graph 2 its visible that moment of inertia is increasing with increase in the length of the strings as we can
see that the moment of the inertia when the length of the string is 0.25m with distance between the strings of
0.05m is 1.075 x 10⁻⁴
whereas when the length of the string is 0.45m with distance between the strings of
0.05m is 1.57 x 10⁻³
, this shows that increase in the length of the string increases the moment of inertia.
However the as the distance between the string increase the moment of inertia is decreasing but this trend is
only followed the string of the length 0.45m , other string lengths didn’t show any major trend but all the
other strings got their highest moment of inertia value approximately at the 0.15m. There values of moment
of inertia increased till 0.15m then decreased and then increase a little at 0.25m.
CONCLUSION
This was an experiment to calculate moment of inertia experimentally using a bifilar pendulum, and
determine the relationship between the length of the strings of the bifilar pendulum, the distance between the
strings and the moment of inertia.
After collecting and processing data from the experiment it can be concluded that the results do not support
my hypothesis “Its hypothesized that with increase in the length of the string there will be a decrease on the
moment of inertia but with increase in the distance there will be an increase in the moment of inertia because
the length of the string is inversely proportional to the moment of inertia and the distance between the
strings is directly proportional to the moment of inertia.” It can be concluded from the results that the
calculated moment of inertia of the body using a bifilar pendulum is increasing with increase in the length of
the strings used for the bifilar pendulum and in some cases the calculated moment of inertia of the body
using a bifilar pendulum is decreasing with increase with the distance between the strings of the bifilar
pendulum, however this is not followed in all cases.
Hence my research question was worthy of investigation and answered “Does manipulating the length of the
strings and distance between the strings of a bifilar pendulum have an effect on the moment of inertia
determined?” as manipulating the length of the strings and distance between the strings of a bifilar pendulum
did have a significant effect on the moment of inertia calculated.
EVALUATION
Hypothesis
The hypothesis stating that with increase in the length of the string there will be a decrease on the moment of
inertia but with increase in the distance there will be an increase in the moment of inertia has been proven to
be wrong as the results gained from my experiment do not support my hypothesis.
Method
The most ideal method was designed for the experiment to gain the best results. The distances between the
strings were marked on the glass beam and the metal rod with a marker, this made sure the distance was
accurate and same throughout each trail ad this also reduced uncertainty and improved accuracy of the
10. 10
experiment. There were number of variables which were controlled this made the experiment more precise
and accurate and the results more reliable.
Results
The results gained are reliable as the very small error bars on the graphs indicate that the results are highly
precise and accurate. There was very low standard deviation and uncertainty in the results which means that
the results are reliable. The results also showed a trend which proves that the results are reliable.
Weakness and Improvements:
The experiment was acceptably accurate and precise but it has a scope of improvement as it was carried out
within the parameters of the school lab, some improvements in the methodology and investigation can
improve the accuracy of the research.
The stopwatch may not have always been started and stopped at the right time there could be a minute delay
this could be improved by taking more number of trails. The wooden ruler calibration: It is calibrated to 1
decimal place which creates an uncertainty of 0.05cm in every reading. So, the actual distance or length
could be higher or lower. An increase in the number of trails could reduce this error.
Parallax error: Although most of the readings were taken at eye-level, there are differences between the
apparent and real magnitude of readings. So, the actual reading could differ a little. This could be improved
by taking eye-level readings from a fixed point at a fixed distance to prevent changes in the apparent
magnitudes of readings. This way, the readings will have higher precision.
The glass beam hanging with the help of the strings may not have always been straight or in level even
though a bubble level was used, taking more number of reading with the bubble level could help reducing
this error.
Further Research Suggestion:
The experiment could be carried out at different heights and with different string types to investigate if it
will have an effect on moment of inertia calculated or a different type of pendulum could be used to
calculate moment of inertia of the object.
BIBLIOGRAPHY
The Editors of Encyclopaedia Britannica. (2018, December 27). Moment of inertia. Retrieved October 25,
2019, from http://www.britannica.com/science/moment-of-inertia
Gracey, William. “The Experimental Determination of Moment of Inertia for Aeroplanes by a Compound
Pendulum .” June 1948, https://apps.dtic.mil/dtic/tr/fulltext/u2/a381475.pdf
Habeck, Joseph, and Peter Seiler. “University of Minnesota (UMN) Map Server.” SpringerReference,
doi:10.1007/springerreference_63085
(n.d.). Retrieved November 10, 2019, from https://isaacphysics.org/concepts/cp_moment_inertia
Jardin, M. (2009, May). (PDF) Optimized Measurements of UAV Mass Moment of Inertia ... Retrieved
November 12, 2019, from
https://www.researchgate.net/publication/245431053_Optimized_Measurements_of_UAV_Mass_Moment_
of_Inertia_with_a_Bifilar_Pendulum.
11. 11
APPENDIX
Graph 3: Showing time period for 0.25m length of a string at different distances between the strings
Graph 4: Showing time period for 0.30m length of a string at different distances between the st
0
0.5
1
1.5
2
2.5
0.05 0.1 0.15 0.2 0.25
Timeperiod(s)
Distance between string (m)
graph showing time periodfor a 0.25 m length of a
string at different distances between the strings
Time period
0
1
2
3
4
5
0.05 0.1 0.15 0.2 0.25
Timeperiod(s)
Distance between string (m)
graph showing time period for a 0.30 m length of a
string at different distances between the strings
Time period
Scale
X axis: 1 unit =
0.05m
Y axis: 1 unit = 1
second
Scale
X axis: 1 unit =
0.05m
Y axis: 1 unit = 1
second
12. 12
Graph 5: Showing time period for 0.35m length of a string at different distances between the strings
Graph 6: Showing time period for 0.40m length of a string at different distances between the strings
0
2
4
6
0.05 0.1 0.15 0.2 0.25
Timeperiod(s)
Distance between strings(m)
graph showing time periodfor a 0.35 m length of a
string at different distances between the strings
Time period
0
1
2
3
4
5
0.05 0.1 0.15 0.2 0.25
Timeperiod(s)
Distance between strings(m)
graph showing time period for a 0.40 m length of a
string at different distances between the strings
Time period
Scale
X axis: 1 unit =
0.05m
Y axis: 1 unit = 1
second
Scale
X axis: 1 unit =
0.05m
Y axis: 1 unit = 1
second