SlideShare a Scribd company logo
1 of 1
Download to read offline
General Fund - Prior Years Budgets and Actuals (Source: City Records)
Fiscal Years ==> 2004 2005 2006 2007 2008 2009 2010 2011 2012 2013 2014 2015*
2016
Forecast
Adopted Budgets 468,433,965 516,002,470 542,379,465 575,751,853 601,868,946 665,632,619 674,537,400 666,610,890 640,741,389 697,567,123 722,582,051 758,403,725 806,991,579
Adjusted Budgets 473,310,165 524,465,157 543,661,631 579,829,412 618,250,659 660,864,134 665,312,304 663,461,381 641,034,996 697,352,141 727,711,415 748,020,492 801,945,758
Administration/Finance
Dept. Adjustments
- - (7,100,000) 1,500,000 - (3,585,300) (2,570,000) - - - (4,571,980) (5,303,592) -
Adjusted/Mandated
Budget Target
473,310,165 524,465,157 536,561,631 581,329,412 618,250,659 657,278,834 662,742,304 663,461,381 641,034,996 697,352,141 723,139,435 742,716,900 801,945,758
Final Actuals 473,222,992 498,187,165 535,502,711 581,693,177 618,303,064 657,224,856 662,765,860 663,419,953 640,887,479 697,417,221 723,158,146 741,251,981 801,945,758
$ Better/(Worse) 87,173 26,277,992 1,058,920 (363,765) (52,405) 53,978 (23,556) 41,428 147,517 (65,080) (18,711) 1,464,919 -
% Better/(Worse) 0.02% 5.01% 0.19% -0.06% -0.01% 0.01% 0.00% 0.01% 0.02% -0.01% 0.00% 0.20% 0.00%
Financial Performance Measures
Budgets/Target Actuals
Actuals B/(W)
vs Budget
% Variance
618,250,659 618,303,064 (52,405) -0.008%
657,278,834 657,224,856 53,978 0.008%
662,742,304 662,765,860 (23,556) -0.004%
663,461,381 663,419,953 41,428 0.006%
641,034,996 640,887,479 147,517 0.023%
697,352,141 697,417,221 (65,080) -0.009%
723,139,435 723,158,146 (18,711) -0.003%
742,937,884 741,251,981 1,685,903 0.227%
5,406,197,634 5,404,428,560 1,769,074 0.033%
2015
Cumulative Totals
2008
2009
2010
2011
2012
2013
Eight Year Performance Analysis - HPD Management of General Funds
Fiscal Years
2014
Auditing Agency # Audits Findings Recommendations
US Department of Justice 18 0 0
US Department of Treasury 1 0 0
COH-Office of the Controller 7 0 2
Deloitte & Touché 16 0 0
Texas Office of the Governor Criminal Justice Division(CJD 2 0 0
Department of Public Safety & FEMA 2 0 0
National Forensic Science Technology Center (NFSTC) 2 0 0
Office of Attorney General 1 0 0
Texas Dept. of Transportation(TxDot) 1 0 0
McConnell Jones Lanier & Murphy LLP 2 0 0
Total Audits Performed 52 0 0
Average Number of Audits per Year 10.4
Total Number of Audit Findings 0 2
Performance Report
Audits of HPD's Office of Budget & Finance - Five Year Summary

More Related Content

Similar to 00 - ii - Financial Performance

BOS-BOF MONTHLY REPORT -MARCH 2016
BOS-BOF MONTHLY REPORT -MARCH 2016BOS-BOF MONTHLY REPORT -MARCH 2016
BOS-BOF MONTHLY REPORT -MARCH 2016Bill Leverence
 
Apresentação call 1 t13_eng
Apresentação call 1 t13_engApresentação call 1 t13_eng
Apresentação call 1 t13_engArteris S.A.
 
11300 eoy 2017_nelnet_placemat_ppt
11300 eoy 2017_nelnet_placemat_ppt11300 eoy 2017_nelnet_placemat_ppt
11300 eoy 2017_nelnet_placemat_pptnelnetir
 
Basic Hotel's Accounting Principles #12 Forecasting by Dino Leonandri
Basic Hotel's Accounting Principles  #12 Forecasting by Dino LeonandriBasic Hotel's Accounting Principles  #12 Forecasting by Dino Leonandri
Basic Hotel's Accounting Principles #12 Forecasting by Dino LeonandriDINOLEONANDRI
 
Hotel's Basic Accounting Principles #13 by Dino Leonandri
Hotel's Basic Accounting Principles  #13 by Dino LeonandriHotel's Basic Accounting Principles  #13 by Dino Leonandri
Hotel's Basic Accounting Principles #13 by Dino LeonandriDINOLEONANDRI
 
1808 blue book
1808 blue book1808 blue book
1808 blue bookAlan Prest
 
ERICAP September 2014 Report
ERICAP September 2014 ReportERICAP September 2014 Report
ERICAP September 2014 Reportsunilrebel
 
1809 blue book_unaudited
1809 blue book_unaudited1809 blue book_unaudited
1809 blue book_unauditedAlan Prest
 
Abc inc. plan grader sample pg
Abc inc. plan grader   sample pgAbc inc. plan grader   sample pg
Abc inc. plan grader sample pgJames Holland
 
Debt indicators of Turkey
Debt indicators of TurkeyDebt indicators of Turkey
Debt indicators of TurkeyBCN Turkey
 

Similar to 00 - ii - Financial Performance (20)

BOS-BOF MONTHLY REPORT -MARCH 2016
BOS-BOF MONTHLY REPORT -MARCH 2016BOS-BOF MONTHLY REPORT -MARCH 2016
BOS-BOF MONTHLY REPORT -MARCH 2016
 
Call 2 t13_eng
Call 2 t13_engCall 2 t13_eng
Call 2 t13_eng
 
EKSG 2017 Approved Budget
EKSG 2017 Approved Budget EKSG 2017 Approved Budget
EKSG 2017 Approved Budget
 
Apresentação call 1 t13_eng
Apresentação call 1 t13_engApresentação call 1 t13_eng
Apresentação call 1 t13_eng
 
11300 eoy 2017_nelnet_placemat_ppt
11300 eoy 2017_nelnet_placemat_ppt11300 eoy 2017_nelnet_placemat_ppt
11300 eoy 2017_nelnet_placemat_ppt
 
Basic Hotel's Accounting Principles #12 Forecasting by Dino Leonandri
Basic Hotel's Accounting Principles  #12 Forecasting by Dino LeonandriBasic Hotel's Accounting Principles  #12 Forecasting by Dino Leonandri
Basic Hotel's Accounting Principles #12 Forecasting by Dino Leonandri
 
Hotel's Basic Accounting Principles #13 by Dino Leonandri
Hotel's Basic Accounting Principles  #13 by Dino LeonandriHotel's Basic Accounting Principles  #13 by Dino Leonandri
Hotel's Basic Accounting Principles #13 by Dino Leonandri
 
FINANCIAL ANALYSIS OF NOVARTIS INDIA
FINANCIAL ANALYSIS OF NOVARTIS INDIAFINANCIAL ANALYSIS OF NOVARTIS INDIA
FINANCIAL ANALYSIS OF NOVARTIS INDIA
 
P&L FORECAST
P&L FORECASTP&L FORECAST
P&L FORECAST
 
1808 blue book
1808 blue book1808 blue book
1808 blue book
 
ERICAP September 2014 Report
ERICAP September 2014 ReportERICAP September 2014 Report
ERICAP September 2014 Report
 
Call 4 t13_eng
Call 4 t13_engCall 4 t13_eng
Call 4 t13_eng
 
170727 Budget Workshop 4
170727 Budget Workshop 4170727 Budget Workshop 4
170727 Budget Workshop 4
 
1809 blue book_unaudited
1809 blue book_unaudited1809 blue book_unaudited
1809 blue book_unaudited
 
Egresos 2011
Egresos 2011Egresos 2011
Egresos 2011
 
120981064 new-doll
120981064 new-doll120981064 new-doll
120981064 new-doll
 
sajo industrial 007160 Algorithm Investment Report
sajo industrial 007160 Algorithm Investment Reportsajo industrial 007160 Algorithm Investment Report
sajo industrial 007160 Algorithm Investment Report
 
Abc inc. plan grader sample pg
Abc inc. plan grader   sample pgAbc inc. plan grader   sample pg
Abc inc. plan grader sample pg
 
danal 064260 Algorihm Investment Report
danal 064260 Algorihm Investment Reportdanal 064260 Algorihm Investment Report
danal 064260 Algorihm Investment Report
 
Debt indicators of Turkey
Debt indicators of TurkeyDebt indicators of Turkey
Debt indicators of Turkey
 

00 - ii - Financial Performance

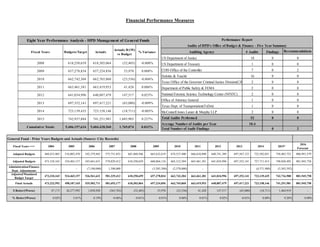
  • 1. General Fund - Prior Years Budgets and Actuals (Source: City Records) Fiscal Years ==> 2004 2005 2006 2007 2008 2009 2010 2011 2012 2013 2014 2015* 2016 Forecast Adopted Budgets 468,433,965 516,002,470 542,379,465 575,751,853 601,868,946 665,632,619 674,537,400 666,610,890 640,741,389 697,567,123 722,582,051 758,403,725 806,991,579 Adjusted Budgets 473,310,165 524,465,157 543,661,631 579,829,412 618,250,659 660,864,134 665,312,304 663,461,381 641,034,996 697,352,141 727,711,415 748,020,492 801,945,758 Administration/Finance Dept. Adjustments - - (7,100,000) 1,500,000 - (3,585,300) (2,570,000) - - - (4,571,980) (5,303,592) - Adjusted/Mandated Budget Target 473,310,165 524,465,157 536,561,631 581,329,412 618,250,659 657,278,834 662,742,304 663,461,381 641,034,996 697,352,141 723,139,435 742,716,900 801,945,758 Final Actuals 473,222,992 498,187,165 535,502,711 581,693,177 618,303,064 657,224,856 662,765,860 663,419,953 640,887,479 697,417,221 723,158,146 741,251,981 801,945,758 $ Better/(Worse) 87,173 26,277,992 1,058,920 (363,765) (52,405) 53,978 (23,556) 41,428 147,517 (65,080) (18,711) 1,464,919 - % Better/(Worse) 0.02% 5.01% 0.19% -0.06% -0.01% 0.01% 0.00% 0.01% 0.02% -0.01% 0.00% 0.20% 0.00% Financial Performance Measures Budgets/Target Actuals Actuals B/(W) vs Budget % Variance 618,250,659 618,303,064 (52,405) -0.008% 657,278,834 657,224,856 53,978 0.008% 662,742,304 662,765,860 (23,556) -0.004% 663,461,381 663,419,953 41,428 0.006% 641,034,996 640,887,479 147,517 0.023% 697,352,141 697,417,221 (65,080) -0.009% 723,139,435 723,158,146 (18,711) -0.003% 742,937,884 741,251,981 1,685,903 0.227% 5,406,197,634 5,404,428,560 1,769,074 0.033% 2015 Cumulative Totals 2008 2009 2010 2011 2012 2013 Eight Year Performance Analysis - HPD Management of General Funds Fiscal Years 2014 Auditing Agency # Audits Findings Recommendations US Department of Justice 18 0 0 US Department of Treasury 1 0 0 COH-Office of the Controller 7 0 2 Deloitte & Touché 16 0 0 Texas Office of the Governor Criminal Justice Division(CJD 2 0 0 Department of Public Safety & FEMA 2 0 0 National Forensic Science Technology Center (NFSTC) 2 0 0 Office of Attorney General 1 0 0 Texas Dept. of Transportation(TxDot) 1 0 0 McConnell Jones Lanier & Murphy LLP 2 0 0 Total Audits Performed 52 0 0 Average Number of Audits per Year 10.4 Total Number of Audit Findings 0 2 Performance Report Audits of HPD's Office of Budget & Finance - Five Year Summary