SlideShare a Scribd company logo
1 of 5
Download to read offline
Prepared from IRS Forms 5500 filings
by Rick Canipe, EA, MBA
IRS Enrolled Agent 77840; to verify the status,
email epp@irs.gov or call 855.472.5540.
www.Fix401k.com
www.MiraCenter.com
Data from Morningstar.com
TOTAL PAID
$274,151 $722,678 $1,532,565 $1,111,325 ? ? $ 3,640,719
Distributions
2012 2013 2014 2015 2016 2017Q1
-$14,114 -$466,043-$34,021 -$51,017 -$95,787 -$96,773 -$174,331
Values below are based on public sources (audits & 5500 Annual Reports)--this can ensure Participants' gains/losses per 29 CFR 2550.404a-5 are correct
$ Lag 2012 2013 2014 2015 2016 2017Q1 TOTAL LAG
"Under trust law, a trustee has a continuing duty to monitor trust investments and
remove imprudent ones."
35% What % of the investment menu met or
beat their benchmarks in 2016?
"...emphasizes a duty to diversify, the avoidance of unjustified costs, and the
importance of evaluating the portfolio as a whole…"
66% In 2016, what percent of the whole trust
was invested in lagging funds?
Supreme Court May 18, 2015 Ruling
No In 2016, were >50% of assets invested in
passive institutional shares?
The Third Restatement of Trusts
Prudent Investor Rule Adherence
“The greater the trustee’s departure from one of the valid passive strategies, the
greater is likely to be the burden of justification and also of continuous monitoring.”
ABC, Inc. 401k Plan
Federal regulation 2550.408b-2 requires reviewing providers to determine they bring value and are "necessary." Federal regulation 2550.404a-5 requires
disclosures to investors so they can evaluate performance versus benchmarks. This document was produced to aid in these efforts.
-65%
-76% -76%
-47%
-90%
-80%
-70%
-60%
-50%
-40%
-30%
-20%
-10%
0%
2016 2015 3 YEAR 5 YEAR
% of Funds Lagging Benchmarks
(888)PlanLag www.FundLag.com
AVG. % COST/YR
+/- BENCHMARKS
2014-2016
-0.91%
-1.02%
Participants' Investment Cost v. Return
Comparison
Prepared using this plan's most recent public
IRS/DOL Forms 5500 at www.dol.gov/efast
Presented _______________
by R. Canipe, J. Holland or approved advisor
Prepared from IRS Forms 5500 filings
by Rick Canipe, EA, MBA
IRS Enrolled Agent 77840; to verify the status,
email epp@irs.gov or call 855.472.5540.
www.Fix401k.com
www.MiraCenter.com
Data from Morningstar.com
Prepared using this plan's most recent public
IRS/DOL Forms 5500 at www.dol.gov/efast
Presented _______________
by R. Canipe, J. Holland or approved advisor
Confidential 6/5/2017 Page 3
21
22
23
24
25
26
27
28
29
30
31
32
33
34
35
36
37
38
39
40
41
42
43
44
45
46
47
48
49
50
51
52
53
54
55
56
57
58
59
60
61
62
63
64
65
66
67
68
69
F G H I J O P Q R S T X AD AE AG AI AJ AM AP AQ AT AW AX BA BD BE BF BH BK BL BM BN BO BP
Patent Pending Serial Number
62368060
SA $ -$ 5500 VALUES 2016 2015 3 Year 5 Year
7,216,282.51$ $RIC DIFF 1$ -35% -29% -21% -25%
29% flows 2016 26,802.28$ 100% (1,277.87) 26,802.28$ 50% (8,919.60) 6,611,630 (3,246.57) 6,573,895 -$10,332.65 5,651,549 -$4,056.51 8,941,607 -$3,394.01 2016 2015 3 Year 5 Year
5 17 9% 6,628,977 (14,114) 6,602,175.00 13,401.14 (174,331) 6,611,630 -$96,773.13 $6,573,894.92 -$95,786.60 5,651,549 -$51,017.18 $8,941,607.28 $3,953,441.04 -$34,020.91 -65% -76% -76% -47%
prospectus benchmark
2nd
BM=1,0
Level
1 Index $ 336,292 name ticker
trust assets 2017
DEITZ
trust assets 2017
DEITZ 2016 return % of level 1
2017 lag
cost trust assets 2016 DEITZ 50% of flows 2016 lag 2016 lag cost
trust assets
beg 2015
dietz from
5500
2015
lag 2015 lag cost from 5500
trust assets beg 2014 dietz
from 5500
2014
lag 2014 lag cost from 5500
trust assets beg 2013 dietz
from 5500 2013 lag 2013 lag cost from 5500
trust assets beg 2012 dietz
from 5500
trust assets beg
2012
2012
lag 2012 lag cost from 5500 fd v bm 2016 fd v bm 2015 fd v bm 3y fd v bm 5y fd v bm 10y
S&P 500 TR USD 0 X Yes 15,842$ MM S&P 500® Index R4 MIEAX 842,983 842,983.16$ 85,161.13 11% 754,758.00 1,532.01 (0.7) (5,279.86) 755,838.88 (0.60) (4,555.40) 751,525.03 (0.77) (5,768.84) 646,082.81 (0.82) (5,277.21) 1,022,200.96 378,020.82 (0.72) (7,347.42) (0.70) (0.60) (0.69) (0.72) (0.68)
BBgBarc US Agg Bond TR USD 0 X No Prudential Total Return Bond A PDBAX 758,603 758,602.50$ 32,839.10 11% 722,829.00 1,467.20 1.9 723,864.15 (0.85) (6,122.88) 719,732.80 0.83 618,751.16 0.85 978,958.15 618,060.53 5.37 1.89 (0.85) 0.61 1.58 1.30
Russell 1000 Growth TR USD 0 X No 128,636$ MassMutual Select Growth Opps A MMAAX 641,239 641,239.34$ (46,789.50) 10% 685,247.00 1,390.92 (13.9) (95,186.11) 686,228.33 (2.21) (15,171.53) 682,311.78 (2.84) (19,348.47) 586,580.47 3.95 928,059.25 299,649.81 4.11 (13.89) (2.21) (6.51) (2.74) (0.50)
Russell 1000 Value TR USD 0 X No 21,974$ Putnam Equity Income A PEYAX 629,123 629,122.69$ 74,961.10 8% 551,921.00 1,120.29 (3.8) (20,896.34) 552,711.40 0.65 549,556.87 (1.01) (5,540.03) 472,451.66 (0.90) (4,258.31) 747,490.16 276,091.05 1.51 (3.79) 0.65 (1.26) (0.67) 1.47
Russell 1000 Value TR USD 0 X No 30,291$ Invesco Comstock A ACSTX 525,527 525,526.52$ 79,389.70 7% (7,011.61) 444,333.00 901.91 0.5 444,969.32 (2.11) (9,375.92) 442,429.72 (4.33) (19,158.50) 380,354.91 2.72 601,779.14 224,658.49 1.39 0.49 (2.11) (2.04) (0.57) 0.30
Russell Mid Cap Growth TR USD 0 X No MassMutual Select Mid Cap Gr Eq II A MEFAX 465,161 465,161.24$ 24,458.39 7% 438,921.00 890.92 (1.8) (7,757.65) 439,549.57 5.57 437,040.90 0.48 375,722.17 (0.30) (1,128.97) 594,449.44 201,947.38 (1.76) (10,449.77) (1.77) 5.57 1.50 0.56 1.11
MSCI EAFE Value GR USD 0 X No MFS International Value R3 MINGX 453,424 453,423.84$ 17,218.18 7% 434,442.00 881.83 (1.7) (7,503.34) 435,064.16 11.69 432,581.09 6.22 371,888.08 3.78 588,383.34 245,367.07 (2.66) (15,641.26) (1.73) 11.69 5.50 3.71 4.52
BBgBarc US Agg Bond TR USD 0 X No 14,417$ Loomis Sayles Strategic Income A NEFZX 414,120 414,120.20$ 31,577.51 6% 380,996.00 773.35 5.6 381,541.62 (8.19) (31,265.83) 379,364.02 (0.32) (1,199.85) 326,137.60 12.90 515,999.14 298,110.43 9.34 5.62 (8.19) (1.18) 3.64 1.66
S&P MidCap 400 TR 0 X Yes 7,313$ MM S&P® Mid Cap Index Adm MDKYX 446,083 446,082.90$ 74,329.83 6% 370,250.00 751.54 (0.7) (2,604.95) 370,780.23 (0.48) (1,791.80) 368,664.05 (0.62) (2,288.81) 316,938.88 (0.78) (2,467.80) 501,445.37 232,328.29 - (0.70) (0.48) (0.60) - -
Russell 2000 Growth TR USD 0 X No 42,604$ ClearBridge Small Cap Growth A SASMX 372,477 372,477.31$ 20,231.11 5% 350,822.00 712.10 (5.6) (19,516.24) 351,324.41 (3.45) (12,127.02) 349,319.27 (2.31) (8,085.34) 300,308.26 1.75 475,133.20 158,520.53 4.31 (5.56) (3.45) (3.75) (1.36) (0.15)
Russell Mid Cap Value TR USD 0 X No 19,529$ RidgeWorth Ceredex Mid-Cap Value Eq A SAMVX 364,730 364,729.57$ 60,244.47 5% 303,254.00 615.55 (0.2) 303,688.29 (1.49) (4,526.75) 301,955.03 (4.05) (12,229.22) 259,589.42 (2.57) (6,678.56) 410,709.83 156,368.25 2.88 (0.17) (1.49) (1.92) (1.12) 1.23
MSCI EAFE NR USD 0 X Yes 4,263$ MM MSCI EAFE® International Index Adm MKRYX 261,752 261,751.72$ 2,294.68 4% 258,408.00 524.52 (0.1) 258,778.06 (0.45) (1,175.23) 257,301.12 (1.00) (2,570.08) 221,200.66 (1.18) (2,601.72) 349,972.98 217,261.91 - (0.11) (0.45) (0.53) - -
Russell 2000 Value TR USD 0 X No 6,323$ JPMorgan Small Cap Value A PSOAX 317,087 317,086.59$ 72,802.90 4% (7,102.37) 243,296.00 493.84 (1.9) (4,568.75) 243,644.42 (0.33) (793.14) 242,253.85 (0.22) 208,264.59 1.64 329,506.15 128,284.20 2.13 (1.88) (0.33) (0.72) 0.23 0.83
MSCI ACWI NR USD 0 X No 41,534$ American Funds New World R3 RNWCX 238,373 238,372.64$ 8,265.27 3% 229,177.00 465.19 (4.3) (9,774.64) 229,505.20 (3.89) (8,933.35) 228,195.33 (8.10) (18,494.48) 196,178.54 (13.11) (25,716.91) 310,384.19 184,267.90 3.26 (4.27) (3.89) (5.42) (5.28) (0.79)
Russell 2000 TR USD 0 X Yes 2,624$ MM Russell 2000® Small Cap Index Adm MCJYX 270,083 270,083.46$ 46,594.86 3% 222,585.00 451.80 (0.4) (927.93) 222,903.76 (0.26) (570.45) 221,631.57 (0.38) (840.84) 190,535.70 (0.69) (1,315.11) 301,456.36 137,631.77 - (0.42) (0.26) (0.35) - -
BBgBarc US Government TR USD 0 X No JPMorgan Government Bond I HLGAX 136,176 136,175.59$ 1,992.06 2% 133,641.00 271.27 0.4 133,832.39 0.16 133,068.56 0.69 114,398.46 (1.02) (1,169.00) 180,995.71 124,801.04 1.52 0.44 0.16 0.43 0.34 0.54
BBgBarc US Agg Bond TR USD 0 X Yes 942$ BlackRock US Total Bond Index Investor A BMOAX 79,343 79,343.24$ 1,734.45 1% 77,295.00 156.89 (0.4) (315.44) 77,405.69 (0.47) (363.83) 76,963.91 (0.34) (262.13) 66,165.54 (0.61) (403.59) 104,683.92 72,071.59 (0.56) (582.46) (0.41) (0.47) (0.41) (0.48) (0.37)
0 #VALUE! #VALUE! 0% - - - - - -
1 #VALUE! #VALUE! 0% - - - - - -
0 #VALUE! #VALUE! 0% - - - - - -
%
Index
Calc PlanGrader review: ABC, Inc. 401k Plan
FT
Act3yrin
sequence
#
funds
bmck10Patent pending PlanGrader for Lssi, LLC.xlsx
Prepared from IRS Forms 5500 filings
by Rick Canipe, EA, MBA
IRS Enrolled Agent 77840; to verify the status,
email epp@irs.gov or call 855.472.5540.
www.Fix401k.com
www.MiraCenter.com
Data from Morningstar.com
Prudent Investor Rule Adherence
“The greater the trustee’s departure from one of the valid passive strategies, the
greater is likely to be the burden of justification and also of continuous monitoring.”
Federal regulation 2550.408b-2 requires reviewing providers to determine they bring value and are "necessary." Federal regulation 2550.404a-5 requires
disclosures to investors so they can evaluate performance versus benchmarks. This document was produced to aid in these efforts.
ABC, Inc. 401k PlanAmerican Law Institute Prudent Investor Rule
"...emphasizes a duty to diversify, the avoidance of unjustified costs, and the
importance of evaluating the portfolio as a whole…"
35% In 2016, what percent of the whole trust
was invested in lagging funds?
Supreme Court May 18, 2015 Ruling
Yes In 2016, were >50% of assets invested in
passive institutional shares?
The Third Restatement of Trusts
Values below are based on public sources (audits & 5500 Annual Reports)--this can ensure Participants' gains/losses per 29 CFR 2550.404a-5 are correct
$ Lag 2012 2013 2014 2015 2016 2017Q1 TOTAL LAG
"Under trust law, a trustee has a continuing duty to monitor trust investments and
remove imprudent ones."
65% What % of the investment menu met or
beat their benchmarks in 2016?
-$1,278 -$31,227-$3,394 -$4,057 -$10,333 -$3,247 -$8,920
TOTAL PAID
$274,151 $722,678 $1,532,565 $1,111,325 ? ? $ 3,640,719
Distributions
2012 2013 2014 2015 2016 2017Q1
-35%
-29%
-21%
-25%
-40%
-35%
-30%
-25%
-20%
-15%
-10%
-5%
0%
2016 2015 3 YEAR 5 YEAR
% of Funds Lagging Benchmarks
(888)PlanLag www.FundLag.com
AVG. % COST/YR
+/- BENCHMARKS 2014-
2016
-0.16% -0.16%
Participants' Investment Cost v. Return
Comparison
Prepared using this plan's most recent public
IRS/DOL Forms 5500 at www.dol.gov/efast
Presented _______________
by R. Canipe, J. Holland or approved advisor
Prepared from IRS Forms 5500 filings
by Rick Canipe, EA, MBA
IRS Enrolled Agent 77840; to verify the status,
email epp@irs.gov or call 855.472.5540.
www.Fix401k.com
www.MiraCenter.com
Data from Morningstar.com
Prepared using this plan's most recent public
IRS/DOL Forms 5500 at www.dol.gov/efast
Presented _______________
by R. Canipe, J. Holland or approved advisor

More Related Content

Similar to Abc inc. plan grader sample pg

Brunswick (BC) Pitch - Jonathan Chang - FINAL COPY
Brunswick (BC) Pitch - Jonathan Chang - FINAL COPYBrunswick (BC) Pitch - Jonathan Chang - FINAL COPY
Brunswick (BC) Pitch - Jonathan Chang - FINAL COPY
Jonathan Chang
 
C3 comp redesign 6-3-13 (2)
C3 comp redesign  6-3-13 (2)C3 comp redesign  6-3-13 (2)
C3 comp redesign 6-3-13 (2)
Mark Wolkove
 
Alex Rodriguez Final Presentation
Alex Rodriguez Final PresentationAlex Rodriguez Final Presentation
Alex Rodriguez Final Presentation
Ilan Bielas
 
Afternoon Sessions
Afternoon SessionsAfternoon Sessions
Afternoon Sessions
gmm0611
 
Page 1 Front PagePage 2 Stocks & BondsPage 3 Financial Sum.docx
Page 1 Front PagePage 2 Stocks & BondsPage 3 Financial Sum.docxPage 1 Front PagePage 2 Stocks & BondsPage 3 Financial Sum.docx
Page 1 Front PagePage 2 Stocks & BondsPage 3 Financial Sum.docx
gerardkortney
 
2 q13 investor presentation
2 q13 investor presentation2 q13 investor presentation
2 q13 investor presentation
BancoABCRI
 

Similar to Abc inc. plan grader sample pg (20)

Abc 401k plan grader
Abc 401k plan grader Abc 401k plan grader
Abc 401k plan grader
 
Brunswick (BC) Pitch - Jonathan Chang - FINAL COPY
Brunswick (BC) Pitch - Jonathan Chang - FINAL COPYBrunswick (BC) Pitch - Jonathan Chang - FINAL COPY
Brunswick (BC) Pitch - Jonathan Chang - FINAL COPY
 
University of Toronto - St. George - Presentation
University of Toronto - St. George - PresentationUniversity of Toronto - St. George - Presentation
University of Toronto - St. George - Presentation
 
C3 comp redesign 6-3-13 (2)
C3 comp redesign  6-3-13 (2)C3 comp redesign  6-3-13 (2)
C3 comp redesign 6-3-13 (2)
 
Spdr debunking-5-common-gold-misconceptions
Spdr debunking-5-common-gold-misconceptionsSpdr debunking-5-common-gold-misconceptions
Spdr debunking-5-common-gold-misconceptions
 
2017 compreport non profit
2017 compreport non  profit2017 compreport non  profit
2017 compreport non profit
 
Alex Rodriguez Final Presentation
Alex Rodriguez Final PresentationAlex Rodriguez Final Presentation
Alex Rodriguez Final Presentation
 
CPG-Financial-Model-and-Valuation-v2.pdf
CPG-Financial-Model-and-Valuation-v2.pdfCPG-Financial-Model-and-Valuation-v2.pdf
CPG-Financial-Model-and-Valuation-v2.pdf
 
RJ
RJRJ
RJ
 
Muthengi mike bamburi financial model - enhancement
Muthengi mike   bamburi financial model - enhancementMuthengi mike   bamburi financial model - enhancement
Muthengi mike bamburi financial model - enhancement
 
Afternoon Sessions
Afternoon SessionsAfternoon Sessions
Afternoon Sessions
 
The Finance Perspective: The Business Model for the Subscription Economy
The Finance Perspective: The Business Model for the Subscription EconomyThe Finance Perspective: The Business Model for the Subscription Economy
The Finance Perspective: The Business Model for the Subscription Economy
 
Zuora CFO Roundtable - Vancouver | Dec 9
Zuora CFO Roundtable - Vancouver | Dec 9Zuora CFO Roundtable - Vancouver | Dec 9
Zuora CFO Roundtable - Vancouver | Dec 9
 
Wassim Zhani Kroger Value.pdf
Wassim Zhani Kroger Value.pdfWassim Zhani Kroger Value.pdf
Wassim Zhani Kroger Value.pdf
 
Page 1 Front PagePage 2 Stocks & BondsPage 3 Financial Sum.docx
Page 1 Front PagePage 2 Stocks & BondsPage 3 Financial Sum.docxPage 1 Front PagePage 2 Stocks & BondsPage 3 Financial Sum.docx
Page 1 Front PagePage 2 Stocks & BondsPage 3 Financial Sum.docx
 
WatchOver - Alzheimer's Caregiver Wearable Technology
WatchOver - Alzheimer's Caregiver Wearable TechnologyWatchOver - Alzheimer's Caregiver Wearable Technology
WatchOver - Alzheimer's Caregiver Wearable Technology
 
1403 monthly snapshot
1403 monthly snapshot1403 monthly snapshot
1403 monthly snapshot
 
2 q13 investor presentation
2 q13 investor presentation2 q13 investor presentation
2 q13 investor presentation
 
ACG Cup - Valuation
ACG Cup - ValuationACG Cup - Valuation
ACG Cup - Valuation
 
As of June 30, 2017
As of June 30, 2017As of June 30, 2017
As of June 30, 2017
 

Recently uploaded

ASSESSING HRM EFFECTIVENESS AND PERFORMANCE ENHANCEMENT MEASURES IN THE BANKI...
ASSESSING HRM EFFECTIVENESS AND PERFORMANCE ENHANCEMENT MEASURES IN THE BANKI...ASSESSING HRM EFFECTIVENESS AND PERFORMANCE ENHANCEMENT MEASURES IN THE BANKI...
ASSESSING HRM EFFECTIVENESS AND PERFORMANCE ENHANCEMENT MEASURES IN THE BANKI...
indexPub
 
TriStar Gold- 05-13-2024 corporate presentation
TriStar Gold- 05-13-2024 corporate presentationTriStar Gold- 05-13-2024 corporate presentation
TriStar Gold- 05-13-2024 corporate presentation
Adnet Communications
 
SAUDI ARABIYA | +966572737505 |Jeddah Get Cytotec pills for Abortion pills
SAUDI ARABIYA | +966572737505 |Jeddah Get Cytotec pills for Abortion pillsSAUDI ARABIYA | +966572737505 |Jeddah Get Cytotec pills for Abortion pills
SAUDI ARABIYA | +966572737505 |Jeddah Get Cytotec pills for Abortion pills
Abortion pills in Riyadh +966572737505 get cytotec
 
Rapport annuel de Encevo Group pour l'année 2023
Rapport annuel de Encevo Group pour l'année 2023Rapport annuel de Encevo Group pour l'année 2023
Rapport annuel de Encevo Group pour l'année 2023
Paperjam_redaction
 
一比一原版(Caltech毕业证书)加利福尼亚理工学院毕业证成绩单学位证书
一比一原版(Caltech毕业证书)加利福尼亚理工学院毕业证成绩单学位证书一比一原版(Caltech毕业证书)加利福尼亚理工学院毕业证成绩单学位证书
一比一原版(Caltech毕业证书)加利福尼亚理工学院毕业证成绩单学位证书
atedyxc
 
一比一原版(Caltech毕业证书)加州理工学院毕业证成绩单学位证书
一比一原版(Caltech毕业证书)加州理工学院毕业证成绩单学位证书一比一原版(Caltech毕业证书)加州理工学院毕业证成绩单学位证书
一比一原版(Caltech毕业证书)加州理工学院毕业证成绩单学位证书
atedyxc
 
原版一模一样(bu文凭证书)美国贝翰文大学毕业证文凭证书制作
原版一模一样(bu文凭证书)美国贝翰文大学毕业证文凭证书制作原版一模一样(bu文凭证书)美国贝翰文大学毕业证文凭证书制作
原版一模一样(bu文凭证书)美国贝翰文大学毕业证文凭证书制作
uotyyd
 

Recently uploaded (20)

ASSESSING HRM EFFECTIVENESS AND PERFORMANCE ENHANCEMENT MEASURES IN THE BANKI...
ASSESSING HRM EFFECTIVENESS AND PERFORMANCE ENHANCEMENT MEASURES IN THE BANKI...ASSESSING HRM EFFECTIVENESS AND PERFORMANCE ENHANCEMENT MEASURES IN THE BANKI...
ASSESSING HRM EFFECTIVENESS AND PERFORMANCE ENHANCEMENT MEASURES IN THE BANKI...
 
MARKETING PLAN COFFEE SHOP IN HO CHI MINH CITY
MARKETING PLAN COFFEE SHOP IN HO CHI MINH CITYMARKETING PLAN COFFEE SHOP IN HO CHI MINH CITY
MARKETING PLAN COFFEE SHOP IN HO CHI MINH CITY
 
TriStar Gold- 05-13-2024 corporate presentation
TriStar Gold- 05-13-2024 corporate presentationTriStar Gold- 05-13-2024 corporate presentation
TriStar Gold- 05-13-2024 corporate presentation
 
FEW OF THE DEVELOPMENTS FOUND IN LESOTHO
FEW OF THE DEVELOPMENTS FOUND IN LESOTHOFEW OF THE DEVELOPMENTS FOUND IN LESOTHO
FEW OF THE DEVELOPMENTS FOUND IN LESOTHO
 
project ratio analysis of bcom studies .
project ratio analysis of bcom studies .project ratio analysis of bcom studies .
project ratio analysis of bcom studies .
 
Amil baba australia kala jadu in uk black magic in usa
Amil baba australia kala jadu in uk black magic in usaAmil baba australia kala jadu in uk black magic in usa
Amil baba australia kala jadu in uk black magic in usa
 
The Pfandbrief Roundtable 2024 - Covered Bonds
The Pfandbrief Roundtable 2024 - Covered BondsThe Pfandbrief Roundtable 2024 - Covered Bonds
The Pfandbrief Roundtable 2024 - Covered Bonds
 
SAUDI ARABIYA | +966572737505 |Jeddah Get Cytotec pills for Abortion pills
SAUDI ARABIYA | +966572737505 |Jeddah Get Cytotec pills for Abortion pillsSAUDI ARABIYA | +966572737505 |Jeddah Get Cytotec pills for Abortion pills
SAUDI ARABIYA | +966572737505 |Jeddah Get Cytotec pills for Abortion pills
 
Rapport annuel de Encevo Group pour l'année 2023
Rapport annuel de Encevo Group pour l'année 2023Rapport annuel de Encevo Group pour l'année 2023
Rapport annuel de Encevo Group pour l'année 2023
 
20240514-Calibre-Q1-2024-Conference-Call-Presentation.pdf
20240514-Calibre-Q1-2024-Conference-Call-Presentation.pdf20240514-Calibre-Q1-2024-Conference-Call-Presentation.pdf
20240514-Calibre-Q1-2024-Conference-Call-Presentation.pdf
 
一比一原版(Caltech毕业证书)加利福尼亚理工学院毕业证成绩单学位证书
一比一原版(Caltech毕业证书)加利福尼亚理工学院毕业证成绩单学位证书一比一原版(Caltech毕业证书)加利福尼亚理工学院毕业证成绩单学位证书
一比一原版(Caltech毕业证书)加利福尼亚理工学院毕业证成绩单学位证书
 
STRATEGIC MANAGEMENT VIETTEL TELECOM GROUP
STRATEGIC MANAGEMENT VIETTEL TELECOM GROUPSTRATEGIC MANAGEMENT VIETTEL TELECOM GROUP
STRATEGIC MANAGEMENT VIETTEL TELECOM GROUP
 
asli amil baba bengali black magic kala jadu expert in uk usa canada france c...
asli amil baba bengali black magic kala jadu expert in uk usa canada france c...asli amil baba bengali black magic kala jadu expert in uk usa canada france c...
asli amil baba bengali black magic kala jadu expert in uk usa canada france c...
 
Tourism attractions in Lesotho katse dam
Tourism attractions in Lesotho katse damTourism attractions in Lesotho katse dam
Tourism attractions in Lesotho katse dam
 
一比一原版(Caltech毕业证书)加州理工学院毕业证成绩单学位证书
一比一原版(Caltech毕业证书)加州理工学院毕业证成绩单学位证书一比一原版(Caltech毕业证书)加州理工学院毕业证成绩单学位证书
一比一原版(Caltech毕业证书)加州理工学院毕业证成绩单学位证书
 
certified amil baba ,black magic specialist in russia and kala jadu expert in...
certified amil baba ,black magic specialist in russia and kala jadu expert in...certified amil baba ,black magic specialist in russia and kala jadu expert in...
certified amil baba ,black magic specialist in russia and kala jadu expert in...
 
ACC311_Corporate Income Taxation in the Philippines
ACC311_Corporate Income Taxation  in the PhilippinesACC311_Corporate Income Taxation  in the Philippines
ACC311_Corporate Income Taxation in the Philippines
 
Retail sector trends for 2024 | European Business Review
Retail sector trends for 2024  | European Business ReviewRetail sector trends for 2024  | European Business Review
Retail sector trends for 2024 | European Business Review
 
Module 1 CCP - Introduction and LMS.pptx
Module 1 CCP  - Introduction and LMS.pptxModule 1 CCP  - Introduction and LMS.pptx
Module 1 CCP - Introduction and LMS.pptx
 
原版一模一样(bu文凭证书)美国贝翰文大学毕业证文凭证书制作
原版一模一样(bu文凭证书)美国贝翰文大学毕业证文凭证书制作原版一模一样(bu文凭证书)美国贝翰文大学毕业证文凭证书制作
原版一模一样(bu文凭证书)美国贝翰文大学毕业证文凭证书制作
 

Abc inc. plan grader sample pg

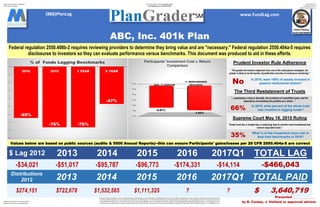
  • 1. Prepared from IRS Forms 5500 filings by Rick Canipe, EA, MBA IRS Enrolled Agent 77840; to verify the status, email epp@irs.gov or call 855.472.5540. www.Fix401k.com www.MiraCenter.com Data from Morningstar.com TOTAL PAID $274,151 $722,678 $1,532,565 $1,111,325 ? ? $ 3,640,719 Distributions 2012 2013 2014 2015 2016 2017Q1 -$14,114 -$466,043-$34,021 -$51,017 -$95,787 -$96,773 -$174,331 Values below are based on public sources (audits & 5500 Annual Reports)--this can ensure Participants' gains/losses per 29 CFR 2550.404a-5 are correct $ Lag 2012 2013 2014 2015 2016 2017Q1 TOTAL LAG "Under trust law, a trustee has a continuing duty to monitor trust investments and remove imprudent ones." 35% What % of the investment menu met or beat their benchmarks in 2016? "...emphasizes a duty to diversify, the avoidance of unjustified costs, and the importance of evaluating the portfolio as a whole…" 66% In 2016, what percent of the whole trust was invested in lagging funds? Supreme Court May 18, 2015 Ruling No In 2016, were >50% of assets invested in passive institutional shares? The Third Restatement of Trusts Prudent Investor Rule Adherence “The greater the trustee’s departure from one of the valid passive strategies, the greater is likely to be the burden of justification and also of continuous monitoring.” ABC, Inc. 401k Plan Federal regulation 2550.408b-2 requires reviewing providers to determine they bring value and are "necessary." Federal regulation 2550.404a-5 requires disclosures to investors so they can evaluate performance versus benchmarks. This document was produced to aid in these efforts. -65% -76% -76% -47% -90% -80% -70% -60% -50% -40% -30% -20% -10% 0% 2016 2015 3 YEAR 5 YEAR % of Funds Lagging Benchmarks (888)PlanLag www.FundLag.com AVG. % COST/YR +/- BENCHMARKS 2014-2016 -0.91% -1.02% Participants' Investment Cost v. Return Comparison Prepared using this plan's most recent public IRS/DOL Forms 5500 at www.dol.gov/efast Presented _______________ by R. Canipe, J. Holland or approved advisor
  • 2. Prepared from IRS Forms 5500 filings by Rick Canipe, EA, MBA IRS Enrolled Agent 77840; to verify the status, email epp@irs.gov or call 855.472.5540. www.Fix401k.com www.MiraCenter.com Data from Morningstar.com Prepared using this plan's most recent public IRS/DOL Forms 5500 at www.dol.gov/efast Presented _______________ by R. Canipe, J. Holland or approved advisor
  • 3. Confidential 6/5/2017 Page 3 21 22 23 24 25 26 27 28 29 30 31 32 33 34 35 36 37 38 39 40 41 42 43 44 45 46 47 48 49 50 51 52 53 54 55 56 57 58 59 60 61 62 63 64 65 66 67 68 69 F G H I J O P Q R S T X AD AE AG AI AJ AM AP AQ AT AW AX BA BD BE BF BH BK BL BM BN BO BP Patent Pending Serial Number 62368060 SA $ -$ 5500 VALUES 2016 2015 3 Year 5 Year 7,216,282.51$ $RIC DIFF 1$ -35% -29% -21% -25% 29% flows 2016 26,802.28$ 100% (1,277.87) 26,802.28$ 50% (8,919.60) 6,611,630 (3,246.57) 6,573,895 -$10,332.65 5,651,549 -$4,056.51 8,941,607 -$3,394.01 2016 2015 3 Year 5 Year 5 17 9% 6,628,977 (14,114) 6,602,175.00 13,401.14 (174,331) 6,611,630 -$96,773.13 $6,573,894.92 -$95,786.60 5,651,549 -$51,017.18 $8,941,607.28 $3,953,441.04 -$34,020.91 -65% -76% -76% -47% prospectus benchmark 2nd BM=1,0 Level 1 Index $ 336,292 name ticker trust assets 2017 DEITZ trust assets 2017 DEITZ 2016 return % of level 1 2017 lag cost trust assets 2016 DEITZ 50% of flows 2016 lag 2016 lag cost trust assets beg 2015 dietz from 5500 2015 lag 2015 lag cost from 5500 trust assets beg 2014 dietz from 5500 2014 lag 2014 lag cost from 5500 trust assets beg 2013 dietz from 5500 2013 lag 2013 lag cost from 5500 trust assets beg 2012 dietz from 5500 trust assets beg 2012 2012 lag 2012 lag cost from 5500 fd v bm 2016 fd v bm 2015 fd v bm 3y fd v bm 5y fd v bm 10y S&P 500 TR USD 0 X Yes 15,842$ MM S&P 500® Index R4 MIEAX 842,983 842,983.16$ 85,161.13 11% 754,758.00 1,532.01 (0.7) (5,279.86) 755,838.88 (0.60) (4,555.40) 751,525.03 (0.77) (5,768.84) 646,082.81 (0.82) (5,277.21) 1,022,200.96 378,020.82 (0.72) (7,347.42) (0.70) (0.60) (0.69) (0.72) (0.68) BBgBarc US Agg Bond TR USD 0 X No Prudential Total Return Bond A PDBAX 758,603 758,602.50$ 32,839.10 11% 722,829.00 1,467.20 1.9 723,864.15 (0.85) (6,122.88) 719,732.80 0.83 618,751.16 0.85 978,958.15 618,060.53 5.37 1.89 (0.85) 0.61 1.58 1.30 Russell 1000 Growth TR USD 0 X No 128,636$ MassMutual Select Growth Opps A MMAAX 641,239 641,239.34$ (46,789.50) 10% 685,247.00 1,390.92 (13.9) (95,186.11) 686,228.33 (2.21) (15,171.53) 682,311.78 (2.84) (19,348.47) 586,580.47 3.95 928,059.25 299,649.81 4.11 (13.89) (2.21) (6.51) (2.74) (0.50) Russell 1000 Value TR USD 0 X No 21,974$ Putnam Equity Income A PEYAX 629,123 629,122.69$ 74,961.10 8% 551,921.00 1,120.29 (3.8) (20,896.34) 552,711.40 0.65 549,556.87 (1.01) (5,540.03) 472,451.66 (0.90) (4,258.31) 747,490.16 276,091.05 1.51 (3.79) 0.65 (1.26) (0.67) 1.47 Russell 1000 Value TR USD 0 X No 30,291$ Invesco Comstock A ACSTX 525,527 525,526.52$ 79,389.70 7% (7,011.61) 444,333.00 901.91 0.5 444,969.32 (2.11) (9,375.92) 442,429.72 (4.33) (19,158.50) 380,354.91 2.72 601,779.14 224,658.49 1.39 0.49 (2.11) (2.04) (0.57) 0.30 Russell Mid Cap Growth TR USD 0 X No MassMutual Select Mid Cap Gr Eq II A MEFAX 465,161 465,161.24$ 24,458.39 7% 438,921.00 890.92 (1.8) (7,757.65) 439,549.57 5.57 437,040.90 0.48 375,722.17 (0.30) (1,128.97) 594,449.44 201,947.38 (1.76) (10,449.77) (1.77) 5.57 1.50 0.56 1.11 MSCI EAFE Value GR USD 0 X No MFS International Value R3 MINGX 453,424 453,423.84$ 17,218.18 7% 434,442.00 881.83 (1.7) (7,503.34) 435,064.16 11.69 432,581.09 6.22 371,888.08 3.78 588,383.34 245,367.07 (2.66) (15,641.26) (1.73) 11.69 5.50 3.71 4.52 BBgBarc US Agg Bond TR USD 0 X No 14,417$ Loomis Sayles Strategic Income A NEFZX 414,120 414,120.20$ 31,577.51 6% 380,996.00 773.35 5.6 381,541.62 (8.19) (31,265.83) 379,364.02 (0.32) (1,199.85) 326,137.60 12.90 515,999.14 298,110.43 9.34 5.62 (8.19) (1.18) 3.64 1.66 S&P MidCap 400 TR 0 X Yes 7,313$ MM S&P® Mid Cap Index Adm MDKYX 446,083 446,082.90$ 74,329.83 6% 370,250.00 751.54 (0.7) (2,604.95) 370,780.23 (0.48) (1,791.80) 368,664.05 (0.62) (2,288.81) 316,938.88 (0.78) (2,467.80) 501,445.37 232,328.29 - (0.70) (0.48) (0.60) - - Russell 2000 Growth TR USD 0 X No 42,604$ ClearBridge Small Cap Growth A SASMX 372,477 372,477.31$ 20,231.11 5% 350,822.00 712.10 (5.6) (19,516.24) 351,324.41 (3.45) (12,127.02) 349,319.27 (2.31) (8,085.34) 300,308.26 1.75 475,133.20 158,520.53 4.31 (5.56) (3.45) (3.75) (1.36) (0.15) Russell Mid Cap Value TR USD 0 X No 19,529$ RidgeWorth Ceredex Mid-Cap Value Eq A SAMVX 364,730 364,729.57$ 60,244.47 5% 303,254.00 615.55 (0.2) 303,688.29 (1.49) (4,526.75) 301,955.03 (4.05) (12,229.22) 259,589.42 (2.57) (6,678.56) 410,709.83 156,368.25 2.88 (0.17) (1.49) (1.92) (1.12) 1.23 MSCI EAFE NR USD 0 X Yes 4,263$ MM MSCI EAFE® International Index Adm MKRYX 261,752 261,751.72$ 2,294.68 4% 258,408.00 524.52 (0.1) 258,778.06 (0.45) (1,175.23) 257,301.12 (1.00) (2,570.08) 221,200.66 (1.18) (2,601.72) 349,972.98 217,261.91 - (0.11) (0.45) (0.53) - - Russell 2000 Value TR USD 0 X No 6,323$ JPMorgan Small Cap Value A PSOAX 317,087 317,086.59$ 72,802.90 4% (7,102.37) 243,296.00 493.84 (1.9) (4,568.75) 243,644.42 (0.33) (793.14) 242,253.85 (0.22) 208,264.59 1.64 329,506.15 128,284.20 2.13 (1.88) (0.33) (0.72) 0.23 0.83 MSCI ACWI NR USD 0 X No 41,534$ American Funds New World R3 RNWCX 238,373 238,372.64$ 8,265.27 3% 229,177.00 465.19 (4.3) (9,774.64) 229,505.20 (3.89) (8,933.35) 228,195.33 (8.10) (18,494.48) 196,178.54 (13.11) (25,716.91) 310,384.19 184,267.90 3.26 (4.27) (3.89) (5.42) (5.28) (0.79) Russell 2000 TR USD 0 X Yes 2,624$ MM Russell 2000® Small Cap Index Adm MCJYX 270,083 270,083.46$ 46,594.86 3% 222,585.00 451.80 (0.4) (927.93) 222,903.76 (0.26) (570.45) 221,631.57 (0.38) (840.84) 190,535.70 (0.69) (1,315.11) 301,456.36 137,631.77 - (0.42) (0.26) (0.35) - - BBgBarc US Government TR USD 0 X No JPMorgan Government Bond I HLGAX 136,176 136,175.59$ 1,992.06 2% 133,641.00 271.27 0.4 133,832.39 0.16 133,068.56 0.69 114,398.46 (1.02) (1,169.00) 180,995.71 124,801.04 1.52 0.44 0.16 0.43 0.34 0.54 BBgBarc US Agg Bond TR USD 0 X Yes 942$ BlackRock US Total Bond Index Investor A BMOAX 79,343 79,343.24$ 1,734.45 1% 77,295.00 156.89 (0.4) (315.44) 77,405.69 (0.47) (363.83) 76,963.91 (0.34) (262.13) 66,165.54 (0.61) (403.59) 104,683.92 72,071.59 (0.56) (582.46) (0.41) (0.47) (0.41) (0.48) (0.37) 0 #VALUE! #VALUE! 0% - - - - - - 1 #VALUE! #VALUE! 0% - - - - - - 0 #VALUE! #VALUE! 0% - - - - - - 0 #VALUE! #VALUE! 0% - - - - - - 0 #VALUE! #VALUE! 0% - - - - - - 0 #VALUE! #VALUE! 0% - - - - - - 0 #VALUE! #VALUE! 0% - - - - - - 0 #VALUE! #VALUE! 0% - - - - - - 0 #VALUE! #VALUE! 0% - - - - - - 0 #VALUE! #VALUE! 0% - - - - - - 0 #VALUE! #VALUE! 0% - - - - - - 0 #VALUE! #VALUE! 0% - - - - - - 0 #VALUE! #VALUE! 0% - - - - - - 0 #VALUE! #VALUE! 0% - - - - - - 0 #VALUE! #VALUE! 0% - - - - - - 0 #VALUE! #VALUE! 0% - - - - - - 0 #VALUE! #VALUE! 0% - - - - - - 0 #VALUE! #VALUE! 0% - - - - - - 0 #VALUE! #VALUE! 0% - - - - - - 0 #VALUE! #VALUE! 0% - - - - - - 0 #VALUE! #VALUE! 0% - - - - - - 0 #VALUE! #VALUE! 0% - - - - - - 0 #VALUE! #VALUE! 0% - - - - - - 0 #VALUE! #VALUE! 0% - - - - - - 0 #VALUE! #VALUE! 0% - - - - - - 0 #VALUE! #VALUE! 0% - - - - - - % Index Calc PlanGrader review: ABC, Inc. 401k Plan FT Act3yrin sequence # funds bmck10Patent pending PlanGrader for Lssi, LLC.xlsx
  • 4. Prepared from IRS Forms 5500 filings by Rick Canipe, EA, MBA IRS Enrolled Agent 77840; to verify the status, email epp@irs.gov or call 855.472.5540. www.Fix401k.com www.MiraCenter.com Data from Morningstar.com Prudent Investor Rule Adherence “The greater the trustee’s departure from one of the valid passive strategies, the greater is likely to be the burden of justification and also of continuous monitoring.” Federal regulation 2550.408b-2 requires reviewing providers to determine they bring value and are "necessary." Federal regulation 2550.404a-5 requires disclosures to investors so they can evaluate performance versus benchmarks. This document was produced to aid in these efforts. ABC, Inc. 401k PlanAmerican Law Institute Prudent Investor Rule "...emphasizes a duty to diversify, the avoidance of unjustified costs, and the importance of evaluating the portfolio as a whole…" 35% In 2016, what percent of the whole trust was invested in lagging funds? Supreme Court May 18, 2015 Ruling Yes In 2016, were >50% of assets invested in passive institutional shares? The Third Restatement of Trusts Values below are based on public sources (audits & 5500 Annual Reports)--this can ensure Participants' gains/losses per 29 CFR 2550.404a-5 are correct $ Lag 2012 2013 2014 2015 2016 2017Q1 TOTAL LAG "Under trust law, a trustee has a continuing duty to monitor trust investments and remove imprudent ones." 65% What % of the investment menu met or beat their benchmarks in 2016? -$1,278 -$31,227-$3,394 -$4,057 -$10,333 -$3,247 -$8,920 TOTAL PAID $274,151 $722,678 $1,532,565 $1,111,325 ? ? $ 3,640,719 Distributions 2012 2013 2014 2015 2016 2017Q1 -35% -29% -21% -25% -40% -35% -30% -25% -20% -15% -10% -5% 0% 2016 2015 3 YEAR 5 YEAR % of Funds Lagging Benchmarks (888)PlanLag www.FundLag.com AVG. % COST/YR +/- BENCHMARKS 2014- 2016 -0.16% -0.16% Participants' Investment Cost v. Return Comparison Prepared using this plan's most recent public IRS/DOL Forms 5500 at www.dol.gov/efast Presented _______________ by R. Canipe, J. Holland or approved advisor
  • 5. Prepared from IRS Forms 5500 filings by Rick Canipe, EA, MBA IRS Enrolled Agent 77840; to verify the status, email epp@irs.gov or call 855.472.5540. www.Fix401k.com www.MiraCenter.com Data from Morningstar.com Prepared using this plan's most recent public IRS/DOL Forms 5500 at www.dol.gov/efast Presented _______________ by R. Canipe, J. Holland or approved advisor