This document discusses various profiling tools that can be used to analyze MySQL performance, including Oprofile, perf, pt-pmp, and the MySQL Performance Schema. It provides examples of how these tools have been used to identify and resolve specific MySQL performance bugs. While the Performance Schema is useful, it does not always provide sufficient detail and other system-wide profilers like Oprofile and perf are still needed in some cases to pinpoint performance issues.


![www.percona.com
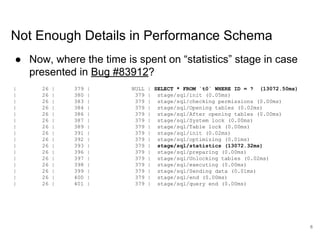
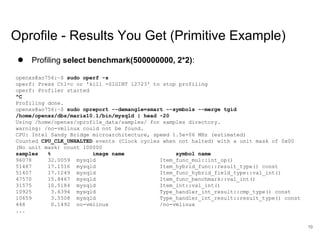
Not Enough Details in Performance Schema
Samples: 52K of event 'cpu-clock', Event
count (approx.): 13037500000
Overhead Command Shared Object Symbol
43.75% mysqld mysqld [.]
Item_func_mul::int_op
16.97% mysqld mysqld [.]
Item_func_benchmark::val_int
14.10% mysqld mysqld [.]
Item_int::val_int
13.50% mysqld mysqld [.]
Item_func_numhybrid::val_int
...
2.58% mysqld mysqld [.]
Item_func_numhybrid::result_type
...
30 SELECT `benchmark` ( ?, ... * ? )
(13055172.39?)
30 stage/sql/init (51.56?)
30 stage/sql/checking permissions
(2.27?)
30 stage/sql/Opening tables (1.00?)
30 stage/sql/After opening tables
(0.62?)
30 stage/sql/init (9.32?)
30 stage/sql/optimizing (7.41?)
30 stage/sql/executing (13055061.32?)
30 stage/sql/end (3.98?)
30 stage/sql/query end (2.34?)
30 stage/sql/closing tables (1.73?)
30 stage/sql/freeing items (4.22?)
30 stage/sql/cleaning up (1.13?)
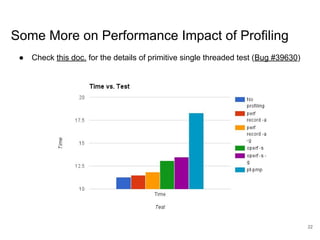
● Yes, this is for primitive select benchmark(500000000,2*2) from Bug #39630
● Performance Schema query is like 25 lines long to make it readable
5](https://image.slidesharecdn.com/applyingprofilerstomysqlfosdem2017-170201084946/85/Applying-profilers-to-my-sql-fosdem-2017-5-320.jpg)
![www.percona.com
pt-pmp (Poor Man’s Profiler)
● http://www.percona.com/doc/percona-toolkit/2.2/pt-pmp.html
pt-pmp [-i 1] [-s 0] [-b mysqld] [-p pidofmysqld] [-l 0] [-k file] [--version]
● It is based on original idea by Domas, http://poormansprofiler.org/
● One of the recent examples how it is used: Bug #78277 - InnoDB deadlock,
thread stuck on kernel calls from transparent page compression, “Open”
● When mysqld hangs or is slow, you can get some insight quickly: for
example, Bug #75028 (HandlerSocket “hangs” on shutdown)
● When there are stalls, use pt-pmp to find out why (or what threads mostly
do at the moment): Bug #69810
● Use in production as a last resort (may hang mysqld, --SIGCONT)
● pt-pmp surely slows server down :) Hints:
○ https://bugs.launchpad.net/percona-toolkit/+bug/1320168 - partial
workaround
○ Use quickstack instead of gdb (check this discussion)
11](https://image.slidesharecdn.com/applyingprofilerstomysqlfosdem2017-170201084946/85/Applying-profilers-to-my-sql-fosdem-2017-11-320.jpg)
![www.percona.com
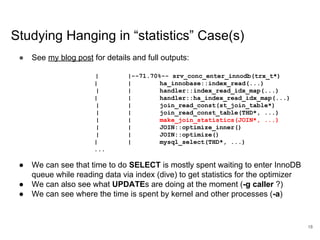
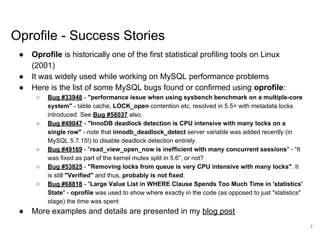
pt-pmp Applied to “statistics” Case of Bug #83912
MariaDB [test]> select * from t0 where id = 15;
+----+------+--------------------+
| id | c1 | c2 |
+----+------+--------------------+
| 15 | 290 | 0.7441205286831786 |
+----+------+--------------------+
1 row in set ( 52.27 sec)
1
select(libc.so.6), os_thread_sleep(os0thread.cc:303), srv_conc_enter_innodb_wi
th_atomics(srv0conc.cc:298),srv_conc_enter_innodb(srv0conc.cc:298),innobase
_srv_conc_enter_innodb(ha_innodb.cc:1906), ha_innobase::index_read(ha_innodb.
cc:1906),handler::index_read_idx_map(handler.cc:5441),handler::ha_index_rea
d_idx_map(handler.cc:2646),join_read_(handler.cc:2646),join_read__table(han
dler.cc:2646), make_join_statistics(sql_select.cc:3935),JOIN::optimize_inner(
sql_select.cc:1366), JOIN::optimize(sql_select.cc:1045), mysql_select(sql_sele
ct.cc:3430),handle_select(sql_select.cc:372),execute_sqlcom_select(sql_pars
e.cc:5896),mysql_execute_command(sql_parse.cc:2971),mysql_parse(sql_parse.c
c:7319),dispatch_command(sql_parse.cc:1488),do_command(sql_parse.cc:1109),d
o_handle_one_connection(sql_connect.cc:1349),handle_one_connection(sql_conn
ect.cc:1261),pfs_spawn_thread(pfs.cc:1860),start_thread(libpthread.so.0),cl
one(libc.so.6)
...
12](https://image.slidesharecdn.com/applyingprofilerstomysqlfosdem2017-170201084946/85/Applying-profilers-to-my-sql-fosdem-2017-12-320.jpg)
![www.percona.com
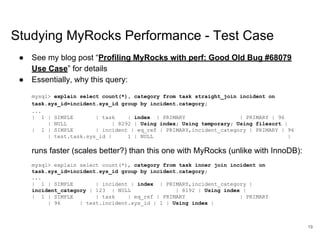
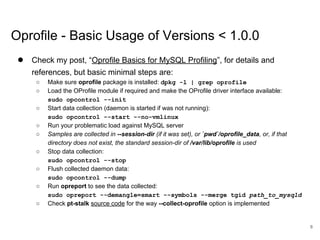
Is PMP Always Useful?
[openxs@fc23 ~]$ pt-pmp
Fri Jan 27 10:53:28 EET 2017
10
__io_getevents_0_4(libaio.so.1),os_aio_linux_collect(os0file.cc:5432),os_ai
o_linux_handle(os0file.cc:5432),fil_aio_wait(fil0fil.cc:6231),io_handler_th
read(srv0start.cc:546),start_thread(libpthread.so.0),clone(libc.so.6)
1
Type_handler_hybrid_field_type::cmp_type,Item_hybrid_func::cmp_type, Item_fu
nc_hybrid_field_type::val_int,Item_func_benchmark::val_int(item_func.cc:4482)
,Item::send(item.cc:6561),Protocol::send_result_set_row(protocol.cc:914),se
lect_send::send_data(sql_class.cc:2830),JOIN::exec_inner(sql_select.cc:2589
),JOIN::exec(sql_select.cc:2510),mysql_select(sql_select.cc:3444),handle_se
lect(sql_select.cc:372),execute_sqlcom_select(sql_parse.cc:5896),mysql_exec
ute_command(sql_parse.cc:2971),mysql_parse(sql_parse.cc:7319),dispatch_comm
and(sql_parse.cc:1488),do_command(sql_parse.cc:1109),do_handle_one_connecti
on(sql_connect.cc:1349),handle_one_connection(sql_connect.cc:1261),pfs_spaw
n_thread(pfs.cc:1860),start_thread(libpthread.so.0),clone(libc.so.6)
...
1
select(libc.so.6),os_thread_sleep(os0thread.cc:303),srv_master_sleep(srv0sr
v.cc:3139),srv_master_thread(srv0srv.cc:3139),start_thread(libpthread.so.0)
,clone(libc.so.6)
...
13](https://image.slidesharecdn.com/applyingprofilerstomysqlfosdem2017-170201084946/85/Applying-profilers-to-my-sql-fosdem-2017-13-320.jpg)
![www.percona.com
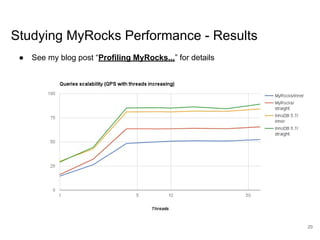
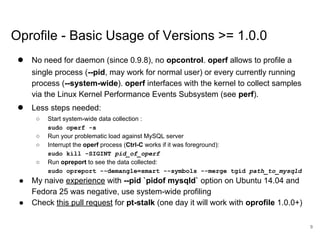
perf - Basic Usage
● Check my post, “perf Basics for MySQL Profiling”, for details and references,
but basic minimal steps are:
○ Make sure perf-related packages are installed (perf with RPMs) for your kernel:
sudo apt-get install linux-tools-generic
○ Make sure debug symbols are installed and software is built with -fno-omit-frame-pointer
○ Start data collection for some time using perf record:
sudo perf record -a [-g] [-F99] [-p `pidof mysqld`] sleep 30
Run your problematic load against MySQL server
○ Samples are collected in `pwd`/perf.data by default
○ Process samples and display the profile using perf report:
sudo perf report [-n] [-g] --stdio
● Alternatively, run in foreground and interrupt any time with Ctrl-C:
[root@centos ~]# perf record -ag
^C
● Or run in background and send -SIGINT when done:
[root@centos ~]# perf record -ag &
[1] 2353
[root@centos ~]# kill -sigint 2353
● Let’s see how it works alive… (demo). We’ll see perf top, perf record -g etc
15](https://image.slidesharecdn.com/applyingprofilerstomysqlfosdem2017-170201084946/85/Applying-profilers-to-my-sql-fosdem-2017-15-320.jpg)
![www.percona.com
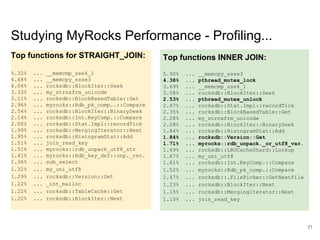
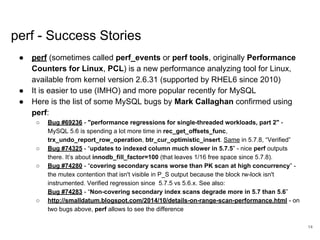
perf - Call Graphs
Use -g option of perf record to get call graphs/backtraces with perf, then:
openxs@ao756:~/dbs/maria10.1$ sudo perf report --stdio
...
31.02% mysqld mysqld [.] Item_func_mul::int_op()
|
--- Item_func_mul::int_op()
|
|--94.56%-- Item_func_hybrid_field_type::val_int()
| Item_func_benchmark::val_int()
| Item::send(Protocol*, String*)
| Protocol::send_result_set_row(List<Item>*)
| select_send::send_data(List<Item>&)
| JOIN::exec_inner()
| JOIN::exec()
| mysql_select(THD*, Item***, TABLE_LIST*, ...
| handle_select(THD*, LEX*, select_result*, unsigned
long)
| execute_sqlcom_select(THD*, TABLE_LIST*)
| mysql_execute_command(THD*)
| mysql_parse(THD*, char*, unsigned int, Parser_state*)
| dispatch_command(enum_server_command, THD*, char*,
...)
| do_command(THD*)
...
16](https://image.slidesharecdn.com/applyingprofilerstomysqlfosdem2017-170201084946/85/Applying-profilers-to-my-sql-fosdem-2017-16-320.jpg)
![www.percona.com
On perf vs Oprofile
● These days perf is, IMHO, better than oprofile/operf for MySQL profiling:
○ perf has a lot of features and requires less steps for basic usage
○ Call graphs are easier to get and more useful with perf
○ Classical oprofile (with daemon etc) has more severe impact on performance
○ In some environments operf just doesn’t work (while perf does):
[root@centos ~]# operf --version
Your kernel's Performance Events Subsystem does not support your processor
type.
Please use the opcontrol command instead of operf.
● Check the following blog post and discussion:
○ “perf: the good, the bad, the ugly”, by Robert Haas
○ Oprofile vs Perf from oprofile-list@lists.sf.net
● --collect-oprofile in pt-stalk may not work well for Galera (see lp:1152571)
● Time to add --collect-perf to pt-stalk!
● PMP is special (ease of use for specific tasks vs performance impact/hangs)
17](https://image.slidesharecdn.com/applyingprofilerstomysqlfosdem2017-170201084946/85/Applying-profilers-to-my-sql-fosdem-2017-17-320.jpg)