1. Classifying Sediment Transport and Correspondence with Bed Material in
the San Joaquin River, CA
By Trent Sherman
California State University Fresno; California Department of Water Resources
DISCUSSIONRESULTSAbstract
CONTACT
Trent Sherman
California State University Fresno
California Department of Water Resources
Email: tsherman91@mail.fresnostate.edu
Phone: (661)345-1988
We present evidence that the mode of
sediment transport in the San Joaquin
River varies as a function of longitudinal
location through time. A database of
geomorphic measurements was analyzed
to determine textural composition of the
gravel bedding to sand bedding transition
zone. To do this, 3 locations were chosen
to track sediment distribution and
discharge between spring of 2011 and
summer 2012. Rouse numbers were
calculated based on shear stress values in
order to find the mode of sediment
transport between the three locations.
Rouse number indicated that sediment
mobility increases with increasing
discharge, while the distribution shows a
downstream fining trend. An increase in
fine sediment supply has led to
questioning its provenance from
anthropogenic sources. In addition, this
survey has provided stratigraphic insight
that increased depositional energy does
not necessarily correspond to a
downstream coarsening of
contemporaneous facies.
• By calculating the 90th percentile of bed material at each
location, a fining downstream trend is observed.
• The 2mm profiles at DS Mile 35.5 and DS Mile 51.6 show
that the textural composition does not change significantly
when exposed to large discharge fluctuations.
• DS Mile 40 shows a significant bed coarsening during large
flow decreases.
• Rouse number indicates that sediment mobility increases as
discharge increases.
• Large sand grains never reached suspension; they travel
in mobile bed forms
The downstream fining trend shown by the 90th
percentile bed material is expected because of a loss in
hydraulic power over distance. DS Mile 40 shows an
anomaly in its 2mm grain distribution because as
discharge decreases, bed texture increases. Three
hypotheses have been proposed to explain this:
1) Low flow conditions cause fine sediment to be
trapped in abandoned mining pits within the river
that flush out during high flow conditions;
2) High flow conditions exceed bankfull flow and cause
erosion of fine sediments from flood plains;
3) A combination of these two explanations.
The next step is to research gravel mining pits for
evidence of hypothesis #1. Hypothesis #2 is less likely
due to the low energy state and dense vegetation of
most flood plains.
A possible source of error is that DS Mile 51.6 is below
the Chowchilla Bifurcation Structure. This study could
benefit from future research of how the structure
distributes its sediment between the main river
channel and the Chowchilla Bypass.
This study ultimately shows that increases in discharge
do not necessarily reflect a downstream coarsening of
contemporaneous depositional facies. This is important
in sedimentary geology because an increase in
depositional energy does not always correspond to
deposition of larger clasts; instead, a good stratigraphic
interpretation will consider increases in fine sediment
supply over a short term period such as in the case of
the San Joaquin River below Friant Dam.
1. Chanson, Hubert. Hydraulics of Open Channel Flow. Jordan Hill, GBR:
Butterworth-Heinemann, 2004. ProQuest ebrary. Web. 9 December 2014.
2. Erosion and Deposition.
http://www.physicalgeography.net/fundamentals/10w.html
Study area: section of 16
river miles, 15 miles west
of Fresno, CA
METHODS AND MATERIALS
𝑅𝑅𝑅𝑅𝑅𝑅𝑅𝑅𝑅𝑅 𝑁𝑁𝑁𝑁𝑁𝑁𝑁𝑁𝑁𝑁𝑁𝑁 𝑍𝑍 =
𝑊𝑊𝑠𝑠
𝐾𝐾𝑈𝑈∗
=
𝑃𝑃𝑃𝑃𝑃𝑃𝑃𝑃𝑃𝑃𝑃𝑃𝑃𝑃𝑃𝑃 𝑆𝑆𝑆𝑆𝑆𝑆𝑆𝑆𝑆𝑆𝑆𝑆𝑆𝑆 𝑆𝑆 𝑉𝑉𝑉𝑉𝑉𝑉𝑉𝑉𝑉𝑉𝑉𝑉𝑉𝑉𝑉𝑉
𝑉𝑉𝑉𝑉𝑉𝑉 𝐾𝐾𝐾𝐾𝐾𝐾𝐾𝐾𝐾𝐾𝐾𝐾 𝐶𝐶𝐶𝐶𝐶𝐶𝐶𝐶𝐶𝐶𝐶𝐶𝐶𝐶𝐶𝐶 ∗ 𝑆𝑆𝑆𝑆𝑆𝑆𝑆𝑆𝑆 𝑉𝑉𝑉𝑉𝑉𝑉𝑉𝑉𝑉𝑉𝑉𝑉𝑉𝑉𝑉𝑉
When Z ≤ 2.5, particles enter suspension by saltation
When Z ≤ 1.0, particles are in 100% suspension
Geologic Background and Setting
= DS Mile 35.5
= DS Mile 40
= DS Mile 51.6
REFERENCES
CONCLUSIONS
• California Department of Water Resources provided
a database of morphological measurements
• three locations were chosen based on their
proximity to Gravelly Ford
• Analyzed during spring of 2011 and 2012 (historic
high and low water years).
• Determined 2mm, 1mm, 0.5mm, 0.25mm sediment
distribution by sieve analysis
• Calculated Rouse Number to determine mode of
transport (Chanson, 1999)
(Above) Critical entrainment velocity graph from
PhysicalGeolgraphy.net
• The San Joaquin River is the second longest river in
California, at 366 miles
• Friant Dam was completed in 1942 at river mile
267.5, or “downstream mile 0” (DS Mile 0)
• Area of interest for geomorphic response to dam, as
an effort to revive Salmon population
• This study looks at post-dam morphology in a 16
mile section that constrains the transition between
gravel and sand bedding, about 10 miles west of
Fresno, CA.
• The transition zone is named Gravelly Ford, which is
located 38.5 miles downstream of Friant Dam (DS
Mile 38.5) at river mile 229
ACKNOWLEDGEMENTS
I would like to thank Matt Meyers and Dr. Mara Brady
for mentoring me through this project and inspiring my
fluvial morphologic studies. Gratitude is also expressed
to Alexis Phillips-Dowell, and Ca DWR for providing vital
data and funding for this research.
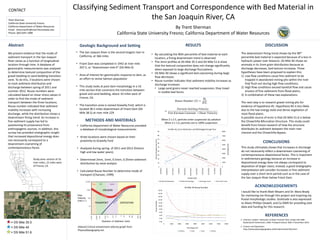
0
1000
2000
3000
4000
5000
6000
7000
8000
0
10
20
30
40
50
60
70
80
90
2/6/2011
3/28/2011
5/17/2011
7/6/2011
8/25/2011
10/14/2011
12/3/2011
1/22/2012
3/12/2012
5/1/2012
6/20/2012
Discharge(CFS)
PercentGreaterthan2mm
Sample Date
DS Mile 40_2mm Distribution and Discharge through Time
DS Mile 40 Sediement DS Mile 40 Discharge Discharge Trend Grain Size Trend
0.00
2.00
4.00
6.00
8.00
10.00
12.00
14.00
16.00
18.00
20.00
0 1000 2000 3000 4000 5000 6000 7000 8000
RouseNumber
Discharge (CFS)
DS Mile 40 Rouse Number
0.25mm 2mm 1mm 0.5mm