2015 SEG NSAP conference_Vp in near waterbottom_Copyright
1. Variations in compression wave velocities in near-waterbottom sediments
Alan J. Foley*, Svitzer Surveys
Summary
Geotechnical engineers performing site investigations in the
near seabed routinely discard geophysical data as inaccurate,
referring to these data as “remote sensing”. The reason for
this is that their results of in-situ testing or laboratory tests
on cores do not match the results of geophysical surveys.
This may be because geophysical measurements in
unconsolidated sediments are ambiguous or just plain
wrong. In an unconsolidated section, typically an active river
delta or bay with a high rate of deposition or large amount of
organic material, the start of the normally consolidated
section is difficult to determine and may be at a greater depth
than experience would indicate. This is highlighted by the
lack of definition of the seabed or "mudline" in drilling
terminology; definitions are made in terms of acoustic
contrast, i.e. p-wave impedance, visibility or navigability of
a vessel. There is no absolute definition of the seabed in
terms of load-bearing capacity or s-wave impedance,
primarily due to the difficulty of measuring s-wave signals
or testing the seabed.
However the drilling community, with its focus on formation
pressures and mudweights, has some insight into the
transition from an unconsolidated section into normal
compaction. In this highly saturated condition, with
saturation values in the 60 - 80% range, the pores of the
unconsolidated section are in hydraulic communication with
the seabed and pore pressures increase with depth on the
hydrostatic curve, any overpressure in this zone will be
dissipated through the water column. As depth increases
through this zone shear wave velocities through the
sediment, having commenced at very low values in the order
of tens or low hundreds of meters per second, rise. However
the behavior of p-wave velocities is quite different.
Commencing at the mudline p- wave velocities are in the
range of the overlying fluid, where clays in brine/sediment
mixture form sols. As burial depths increase the velocity in
the fluid column continues in the 1400 - 1500m/s range until
a point above the boundary of normal compaction when the
fluid velocity approaches the velocity of the sediment grains
of the formation asymptotically; in most cases this will be a
p-wave velocity decrease of as much as 30% relative to fluid
velocity. As burial depth of the sediment column increases
further sediment grain velocities increase until they surpass
those of the overlying fluid column and velocity increase
follows the normal compaction curve.
Introduction
In marine near-seabed environments there is a transition of
the mode of transmission of seismic signals as the sediment
compaction increases and saturation decreases. In the typical
marine seismic section acoustic signals are transmitted
through the water column to the seabed, thence signals are
transmitted to depth by the seabed sediment to reflectors
below the seabed. The two modes of transmission must
either coexist in a zone where both modes overlap, or
transition at a discrete interface where one mode ceases and
the other commences. Evidence of the dual mode
transmission is rarely observed in field data, but sufficient
occurrences of dual mode transmission in unconsolidated,
saturated soils are documented to support the tandem modes
transition from fluid to sediment grain transmission. The
boundary point between the two modes is the start of the
“normal” compaction curve. This is the point from which the
effective stress on the sediment column increases linearly
with depth and the sediment grains and pore spaces transmit
p-wave energy in tandem. At this interface pore pressures
can increase above the hydrostatic curve as sediment
becomes consolidated and allows hydraulic sealing of pores
from the seawater column. But where is this point and what
happens to acoustic signals above the start of normal
compaction?
Theory and Method
The underlying theory of this effect was described by Biot
in 1956. He proposed that p-wave velocities are controlled
by:
a) The velocity of elastic waves through the sediment matrix
b) The velocity of elastic waves through the pore fluid.
The implication of Biot’s work, and the subsequent Biot-
Gassman equations, is that there are three seismic wave
velocities in unconsolidated, fluid saturated sediment:
i) The s-wave velocity through the sediment matrix
ii) The p-wave velocity through the sediment matrix
iii) The p-wave velocity through the fluid within the matrix
This p-wave behavior is neither intuitive nor regularly
observed in practice. A brief review of the effect of this
behavior explains the lack of observation of these variations.
In any reflection or acoustic survey the first signal received
will be that transmitted by the fluid transmission route
through the near-seabed. The p-wave signal transmitted via
sediment grains is slower than that of the fluid column, often
by a factor of 2 or 3. Typical values of the fluid transmission
velocity are 1200 – 1500m/s whilst sediment grain values are
in the order of 400m/s. Therefore this lower velocity signal
appears later in the reflection record on normal incidence
travel paths and occurs rarely on offset receivers. In
2. P-wave variation in the seabed
boreholes and logged wells the highly saturated,
unconsolidated section is behind the well conductor and not
logged by any conventional sonic methods.
Thus, the only instance of seismic velocities measurement in
this unconsolidated zone is during site investigations.
Usually only s-wave velocities are considered as they are a
direct measurement of the stiffness or strength of the
formation. Methods used for velocity determination are:
Reflection using a streamer or seabed array
Refraction using a seabed detector array
Transmission using a borehole or seismic cone system
Surface wave analysis
Crosshole tomography
Reflection techniques are usually relied on in deepwater.
Examples
In rare cases both s-wave and p-wave velocities are
measured in the same location. I use two examples to
highlight the transition of p-wave velocities from those of
the fluid column to those of the sediment grain, in the Fraser
River Delta of Western Canada and in San Francisco Bay.
The Fraser River example illustrates an interesting
phenomenon. An asymptotic sonic velocity variation is
described by Bowers (2002) in addressing formation
overpressure. In figure 2, as the fluid p-wave velocities make
their asymptotic approach to those of the sediment grain, the
p-wave sediment grain velocity increases asymptotically
toward the fluid velocity. In the San Francisco Bay example,
the two transmission modes do not converge above the
bottom of the sampling hole.
Onshore in the Hanford boreholes the behavior of p-waves
measured by Redpath(2007) is compared with that of s-
waves in environments with differential compaction. The
huge velocity contrast of the s-waves is not registered by p-
waves. This may be attributed to p-wave transmission below
the water table.
To determine the reliability of measured velocities in
saturated sediment calculate Poisson’s Ratio from the
results. If measured Poisson’s Ratio values match the value
of the sediment type the measurements are valid. Most
lithified sediments have Poisson’s ratios in the 0.20 – 0.35
range whereas plastic mixtures, sols and incompressible
liquids approach 0.5. The behavior of mixtures of solids and
fluids is complex, especially if the solids are clay sized and
immersed in brine, and beyond the scope of this
presentation.
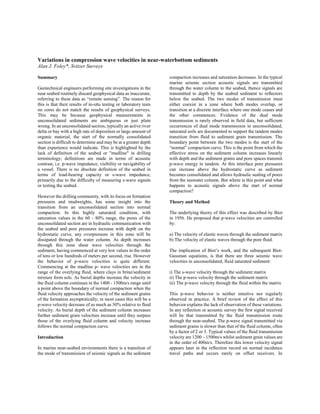
Figure 1: San Francisco Bay p-wave borehole velocity survey (USGS,
1992)