More Related Content
Similar to Nature_Somenath
Similar to Nature_Somenath (20)
Nature_Somenath
- 1. LETTERS
Near-surface wetland sediments as a source of
arsenic release to ground water in Asia
Matthew L. Polizzotto1
, Benjamin D. Kocar1
, Shawn G. Benner2
, Michael Sampson3
& Scott Fendorf1
Tens of millions of people in south and southeast Asia routinely
consume ground water that has unsafe arsenic levels1,2
. Arsenic is
naturally derived from eroded Himalayan sediments, and is
believed to enter solution following reductive release from solid
phases under anaerobic conditions. However, the processes gov-
erning aqueous concentrations and locations of arsenic release to
pore water remain unresolved, limiting our ability to predict
arsenic concentrations spatially (between wells) and temporally
(future concentrations) and to assess the impact of human activ-
ities on the arsenic problem3–9
. This uncertainty is partly attribu-
ted to a poor understanding of groundwater flow paths altered by
extensive irrigation pumping in the Ganges-Brahmaputra delta10
,
where most research has focused. Here, using hydrologic and
(bio)geochemical measurements, we show that on the minimally
disturbed Mekong delta of Cambodia, arsenic is released from
near-surface, river-derived sediments and transported, on a cent-
ennial timescale, through the underlying aquifer back to the river.
Owing to similarities in geologic deposition, aquifer source rock
and regional hydrologic gradients11–15
, our results represent a
model for understanding pre-disturbance conditions for other
major deltas in Asia. Furthermore, the observation of strong
hydrologic influence on arsenic behaviour indicates that release
and transport of arsenic are sensitive to continuing and impending
anthropogenic disturbances. In particular, groundwater pumping
for irrigation, changes in agricultural practices, sediment excava-
tion, levee construction and upstream dam installations will alter
the hydraulic regime and/or arsenic source material and, by exten-
sion, influence groundwater arsenic concentrations and the future
of this health problem.
There is general agreement that arsenic contamination in the
ground water of south and southeast Asia is a consequence of arsenic
release from sediment solids into pore water under anaerobic con-
ditions and ensuing microbially mediated Fe(III) and As(V) reduc-
tion3,7–9,11,14–18
. However, the location within the sediment profile, the
time period, and the influence of hydrology on arsenic release remain
unresolved; such information is crucial for defining remedial res-
ponses and predicting future arsenic concentrations.
We have formulated a coupled hydrologic and biogeochemical
model of arsenic release and transport within the arsenic-contami-
nated Mekong River floodplain of Cambodia that pre-dates the com-
plex influences of widespread irrigation. Our 50 km2
field area
includes .100 installed wells, lysimeters and surface water sites
and is typical of the region, with native wetlands contained between
delta river branches and a grey sand aquifer ($40 m thick) overlain
by a clay/silt layer (5–20 m thick); based on the wetland/river geo-
metry, the groundwater system can be approximated by a two-
dimensional cross-section perpendicular to the river. Although the
Mekong delta system in Cambodia has similar depositional history,
regional hydrology and biogeochemical conditions to other arsenic-
contaminated deltaic aquifers of Asia14
(Supplementary
Information), land use alteration, inclusive of irrigation, is minimal.
Thus, the hydrology of our system remains governed by natural
rather than anthropogenic processes.
As with other Asian river deltas, regional hydrology is controlled
by seasonal river fluctuations of ,8 m (Fig. 1). Groundwater levels
mimic river levels, and the fluctuation amplitude decreases with
distance from the Mekong River, indicating the strong influence of
the river on the floodplain aquifer. The hydraulic gradient between
the aquifer and river inverts annually: during the rising river stage,
the subsurface gradient is from the river to the floodplain aquifer, but
during the falling river stage, the gradient is towards the river
(Supplementary Figs 2 and 3). Changes in surface water levels are
clearly distinct from those observed at depth, producing temporally
variable but strong vertical gradients between the surface water and
underlying aquifer.
Despite seasonal hydraulic gradient inversions, a net annual head
difference of 1.4 m exists between the wetlands and the river, pro-
ducing a net downward gradient from the wetlands to the aquifer of
0.05–0.07 m m21
and a net horizontal gradient from the aquifer to
the river of 7 3 1025
m m21
(Supplementary Information); these
findings agree with those predicted for Bangladesh before irrigation
pumping10,19
. The calculated downward flux through the confining
clay layer is consistent with the independently calculated net hori-
zontal flux to the river, revealing annual water balance between
inflow and outflow. These observations indicate a groundwater travel
time from the wetlands to the river in the range of 200–2,000 yr, and
these results are supported by numerical modelling (Supplementary
Figs 4 and 5). The age of the aquifer, and associated sedimentary
organic carbon, is greater than 6,000 yr, based on both 14
C dating
and regional geologic history20–22
, and, accordingly, the aquifer has
been flushed by at least 3–30 pore volumes.
Arsenic concentrations within the aquifer range from 100 mg l21
to
.1,000 mg l21
, and average ,500 mg l21
(Supplementary Table 1).
Groundwater flow having effectively flushed the aquifer, either an
upstream source of arsenic must exist or arsenic must be continually
released from aquifer solids—or a combination of both must
occur—for arsenic to persist within the aquifer. Based on our yearly
aquifer groundwater fluxes and average aqueous As concentration of
500 mg l21
, (2–20) 3 105
kg of arsenic is removed from the aquifer
system within our field area annually via transport to the river. 14
C
dates indicate an average clay layer deposition rate of ,1–
3.3 mm yr21
over the past 6,000 yr, yielding a delivery rate of
approximately (6–20) 3 105
kg of arsenic to the field area annually
(Supplementary Information). Thus, quantities of arsenic influx (via
sediment deposition) and efflux (aqueous transport from aquifer to
river) are comparable, indicating that release of arsenic from solids
1
School of Earth Sciences, Stanford University, Stanford, California 94305, USA. 2
Department of Geosciences, Boise State University, Boise, Idaho 83705, USA. 3
Resource
Development International – Cambodia, PO Box 494, Phnom Penh, Cambodia.
Vol 454|24 July 2008|doi:10.1038/nature07093
505
©2008 Macmillan Publishers Limited. All rights reserved
- 2. and transport through the aquifer are in approximate balance with
depositional delivery.
Aqueous- and solid-phase concentration profiles, chemical gradi-
ents, biogeochemical signatures and groundwater flow paths indicate
that a large fraction of the arsenic entering solution is released from
solids via reductive processes in near-surface soils/sediments. Within
the aqueous phase, there is a steep gradient in arsenic concentrations
downwards in near-surface soil/clay sediments, from ,10 mg l21
at
thesurfacewater–soil interface, to ,600 mg l21
at a depth of4 m below
the surface in old river channel ponds (Fig. 2) and .900 mg l21
within
shallow pore water below a permanently saturated region of the wet-
lands. This increase in dissolved arsenic within the upper soil/sedi-
ment profile is mirrored by sharp changes in solid-phase arsenic
concentrations, with ,12 mg kg21
arsenic concentrations in the
youngest sediments near the water table, decreasing to ,4 mg kg21
in older, permanently saturated deeper clays. Within the aquifer,
solid-phase arsenic concentrations are lower (Fig. 2) and show little
variation with depth, similar to Bangladesh aquifer sands23
.
The highest near-surface concentrations of dissolved arsenic occur
in topographically low areas, as illustrated by old river channel ponds
Wetlands
Oxbow ponds
Oxbow ponds
Mekong
Bassac
Phnom
Penh
Mekong
TC11
Multi-level wells
Lysimeter site
Surface water levels
Sediment cores
Ponds
Wetlands
TC21
TC31
Cambodia
Thailand Laos
Mekong
River
Vietnam
100 km
Gulf of
Thailand
0 1 2 3 4 km
495,000
8
6
4
2
0
Waterlevel(mASL)
1,275,000
1,270,000
1,265,000
500,000 505,000 510,000
Mekong
TC11
TC21
TC31
Ponds
Wetlands
Mar. May Jul. Sep. Nov. Jan. Mar.
Time (month in 2005/06)
a b
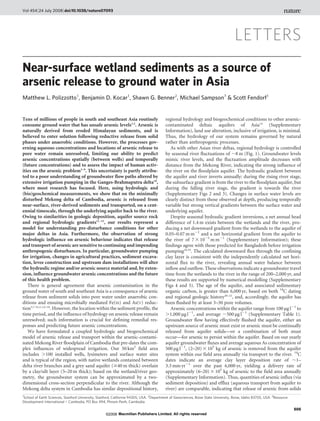
Figure 1 | Field area map and water levels. a, Our field area is located in the
upper Mekong delta of Cambodia. Each multi-level well symbol represents
3–5 wells sampled at varying depths. The base map29
is a ‘true colour’
composite of a Landsat image taken on 11 July 2001; the white dashed line
shows the areal extent of the central wetlands, and abandoned river channel
ponds are indicated. Axis tick marks represent metres in Universal
Transverse Mercator zone 48N. b, Year-long hydrographs for selected wells
(TC11, TC21 and TC31) and surface water level (Mekong River, abandoned
river channel ponds, and wetlands) monitoring sites, labelled in a. ASL,
above sea level.
b 5
4
3
2
1
0
50
100
250
500
750
1,000
Dissolved As
concentration (µg l–1)
0 200 400 600
As (µg l–1)
c
0 4 8 12
As (mg kg–1)
0
–20
–40
–60
0
–20
–40
–60
Elevation(mASL)
a
2,000 1,500 1,000 500 0
Distance from Mekong River (m)
Old river channel ponds Mekong
Figure 2 | Dissolved and solid-phase arsenic profiles throughout the field
area. a, Field area cross-section, showing groundwater arsenic
concentrations (As, grey and red filled circles; concentrations are
proportional to symbol size, see key). Green, zone of variable saturation; red
dashed line, ground surface; black dashed line, clay/silt-sand transition. Well
nest distances are normalized based on relative perpendicular distances from
ponds and Mekong River. b, Lysimeter arsenic concentrations (red filled
circles, see key for meaning of symbol size), showing increasing arsenic with
depth at the near-surface during downward flow conditions. Data taken on
21 December 2005. c, Solid-phase arsenic concentrations. The highest values
are found within the uppermost clay sediments; within the aquifer sands,
values average 2.8 mg kg21
(standard deviation, 1.65 mg kg21
). Error bars,
s.d. of replicate measurements.
LETTERS NATURE|Vol 454|24 July 2008
506
©2008 Macmillan Publishers Limited. All rights reserved
- 3. (Fig. 2), where recently high rates of sedimentary deposition are
coupled with long periods of water inundation and above-average
labile carbon delivery. Persistent reducing conditions result in Fe(III)
and As(V) reduction (for example, As(III) exists within both aqueous
and solid phases (Supplementary Fig. 9)), and concomitant average
solid-phase arsenic depletion of ,0.7 mg kg21
m21
over the initial
14 m of the flow path below the ground surface. Correspondingly,
dissolved arsenic concentrations increase by ,150 mg l21
m21
along
the initial 4 m of the flow path and then increase further by
,20 mg l21
m21
through the remaining clay to the aquifer sands,
values over two orders of magnitude greater than those along deep
aquifer flow lines. Organic carbon oxidation rates, as measured by
dissolved inorganic carbon (DIC) concentrations, further support
arsenic liberation via near-surface anaerobic microbial respiration;
DIC concentrations increase from 50 mg l21
in surface waters to
300 mg l21
at 5–10 m depth. Moreover, DIC is much younger
(,1,800 yr, values consistent with similar measurements in
Bangladesh aquifers3
) than the aquifer and must therefore be prim-
arily derived from more recent (that is, near-surface) organic carbon
sources.
Temporal variations in arsenic concentrations derived from sea-
sonal fluctuations are limited to discharge (proximate to river) and
recharge (shallow sediment) zones, highlighting the mobility of
arsenic across the reduced aquifer (Supplementary Fig. 8).
Recharge zone porewater arsenic concentrations are highest when
steep downward gradients induce water flow into the underlying
aquifer, indicative of reductive arsenic release from surficial sedi-
ments during seasonal saturation. Shallow pore waters containing
maximum arsenic values are depleted of oxygen and sulphate and
contain measurable dissolved ferrous iron and ammonium.
Arsenic undergoes desorption from solids upon Fe(III) and As(V)
reduction. Within basins of southeast Asia, it follows that arsenic
release from Himalayan-derived sediments will be initiated at the
point, in time and space, corresponding to the aerobic–anaerobic
transition. Rates of release will initially be high, owing to the large
pool of available solid-phase arsenic, and release will continue until
either arsenic is depleted from solids or reduction becomes limited
(owing to, for example, labile organic carbon depletion). Recent
observations of arsenic release in laboratory-manipulated experi-
ments with sediments from the oxic–anoxic interface in West
Bengal18
and increasing arsenic with groundwater age over the upper
20 m of a Bangladesh aquifer24
support this model. Within our
Mekong delta field area, we note transitions to anaerobic conditions
and ensuing iron and arsenic reduction at or near the water table—
where we also observe the steepest gradients in arsenic release to the
pore water, as similarly noted for an arsenic-contaminated Red River
delta site25
.
Observed near-surface sources of arsenic neither preclude, nor
necessarily conflict with, continued arsenic release at depth through
native or introduced carbon sources3,26–28
. However, arsenic release
from older, deeper aquifer sediments will most probably occur at
much slower rates than from fresh near-surface wetland sediments,
as evidenced by relative solid and aqueous geochemical gradients.
Thus, high concentrations observed in older waters at the base of the
aquifer (Figs 2, 3), particularly those more distant from the Mekong
River, may reflect slow release from aquifer sediments at depth, as
suggested previously8,16,17
, or a receding plume from a (potentially
historic) high release zone located within the wetlands at the flow
path origin.
Although the processes conspiring to produce the observed arsenic
profiles are complex, it is evident that hydrology-driven arsenic
release and transport from near-surface sediments represents an ap-
preciable—and potentially dominant—source of arsenic to the aqui-
fer, a finding with important implications for management of the
arsenic problem. Moreover, these results suggest a shift in the appro-
priate model from dominant geochemical control towards substan-
tial hydrologic control of arsenic in southeast Asian ground water.
Because groundwater pumping is minimal and large areas remain
undeveloped and uncultivated at our field site, observed hydrologic
and geochemical gradients are naturally derived and contrast with
local gradients dominated by groundwater pumping, such as those in
Bangladesh. Therefore, at our field site, arsenic cycling pre-dates
human influence, and our results provide a potential baseline model
for understanding modern arsenic contamination where land use
changes have transpired. Aquifer arsenic concentrations are con-
trolled in part by biogeochemical release from near-surface sedi-
ments and hydrologic transport, processes that at present combine
to deliver arsenic at levels comparable to its efflux from the aquifer.
As a result, impending or continuing changes (including upstream
damming, changing land use, increased irrigation and clay excava-
tion) that disrupt the hydrologic regime, associated biogeochemical
conditions, or arsenic source material will have potentially significant
consequences for arsenic concentrations in the aquifer. Although the
specific impact of human activities on arsenic concentrations will be
Elevation(m)
3,000 2,000 1,000
Distance from Mekong River (m)
0
Wetlands Ponds
10
100
400
390
60–750
130–240
100
170–220
320–1200
1200
480
960
12–75
950
Sediment As
input:
6 × 10¹¹
–
2 × 10¹²
µg yr–1
Net horizontal hydraulic gradient, 7 × 10⁻⁵ m m–1
Netverticalhydraulicgradient,0.07mm–1
Arsenic (µg l–1)
0 8004000 800400
Mekong
–50
10
–20
0
–30
–40
650 540
80–120 900–1100
0–30
300–550
920 670–850
450–930
920–1200
460
400
390
60–750
170–220
320–1200
1200
480
960
950
650 540
900–1100
0–30
300–550
920 670–850
450–930
920–1200
460
0–710
100 130–240
100
12–75
80–120
0–7
Aqueous
As output:
4 × 10¹¹
–
4 × 10¹²
µg yr–1
Figure 3 | Field area cross-section with groundwater flow paths and
arsenic concentrations. Well water arsenic concentrations are depicted by
the numbers within the cross-section, and these are contoured by kriging;
temporal variations within wells are averaged, and ranges are representative
of wells of equivalent depths and locations. Modelled net annual
groundwater flow lines are depicted by blue arrows within the cross-section;
net annual vertical gradients are 0.07 m m21
in the downward direction and
net annual horizontal gradients are 7 3 1025
m m21
towards the river.
Arsenic inputs to the field area via sedimentation are approximately
equivalent to arsenic outputs via groundwater discharge.
NATURE|Vol 454|24 July 2008 LETTERS
507
©2008 Macmillan Publishers Limited. All rights reserved
- 4. influenced by local site conditions, the coupling of regional hydro-
logy with arsenic behaviour provides a framework for understanding
and predicting current and future groundwater quality.
METHODS SUMMARY
Our field area is located in Kien Svay District, Kandal Province, Cambodia, in the
upper reaches of the Mekong River delta. Wells were installed using a locally
developed, manually driven, direct rotary method, and were backfilled with sand
and native clay; lysimeters were installed into auger-dug holes and backfilled
with native clay. The majority of wells were sampled once in the dry season and
once in the wet season, and a subset of wells were sampled .4 times throughout
the year. Lysimeters were sampled approximately twice a month. Water samples
were analysed by standard methods. Intact sediment samples were obtained
during well drilling, preserved in anaerobic pouches, and stored at 4 uC. Water
levels in wells were measured weekly using an electronic measuring tape and
surface water levels were measured weekly using a weighted measuring tape from
points of fixed height. All water levels were calibrated to the Mekong River
Commission stage levels following elevation surveying. Aquifer parameters were
established by slug tests, constant-head permeameter tests, particle size analyses
and daily tidal monitoring.
Full Methods and any associated references are available in the online version of
the paper at www.nature.com/nature.
Received 22 May 2007; accepted 15 May 2008.
1. Smith, A. H., Lingas, E. O. & Rahman, M. Contamination of drinking-water by
arsenic in Bangladesh: A public health emergency. Bull. World Health Organ. 78,
1093–1103 (2000).
2. Yu, W. H., Harvey, C. M. & Harvey, C. F. Arsenic in groundwater in Bangladesh: A
geostatistical and epidemiological framework for evaluating health effects and
potential remedies. Wat. Resour. Res. 39, art no. 1146 (2003).
3. Harvey, C. F. et al. Arsenic mobility and groundwater extraction in Bangladesh.
Science 298, 1602–1606 (2002).
4. Aggrawal, P. K., Basu, A. R. & Julkarni, K. M. Comment on ‘Arsenic mobility and
groundwater extraction in Bangladesh’. Science 300, 584b (2003).
5. van Geen, A., Zheng, Y., Stute, M. & Ahmed, K. M. Comment on ‘Arsenic mobility
and groundwater extraction in Bangladesh’. Science 300, 584c (2003).
6. Harvey, C. F. et al. Response to comments on ‘Arsenic mobility and groundwater
extraction in Bangladesh’. Science 300, 584d (2003).
7. van Geen, A. et al. Spatial variability of arsenic in 6000 tubewells in a 25 km2
area
of Bangladesh. Wat. Resour. Res. 39, art no. 1140 (2003).
8. McArthur, J. M. et al. Natural organic matter in sedimentary basins and its relation
to arsenic in anoxic groundwater: The example of West Bengal and its worldwide
implications. Appl. Geochem. 19, 1255–1293 (2004).
9. Polizzotto, M. L., Harvey, C. F., Sutton, S. R. & Fendorf, S. Processes conducive to
the release and transport of arsenic into aquifers of Bangladesh. Proc. Natl Acad.
Sci. USA 102, 18819–18823 (2005).
10. Harvey, C. F. et al. Groundwater dynamics and arsenic contamination in
Bangladesh. Chem. Geol. 228, 112–136 (2006).
11. Berg, M. et al. Arsenic contamination of ground and drinking water in Vietnam: A
human health threat. Environ. Sci. Technol. 35, 2621–2626 (2001).
12. Japan International Cooperation Agency. The Study on Groundwater Development
in Southern Cambodia (Kokusai Kogyo Co., Tokyo, Japan, 2002).
13. Stanger, G., Truong, T. V., Ngoc, K. S. L. T. M., Luyen, T. V. & Thanh, T. T. Arsenic in
groundwatersof the Lower Mekong.Environ.Geochem. Health27,341–357(2005).
14. Polya, D. A. et al. Arsenic hazard in shallow Cambodian groundwaters. Mineral.
Mag. 69, 807–823 (2005).
15. Berg, M. et al. Magnitude of arsenic pollution in the Mekong and Red River Deltas
– Cambodia and Vietnam. Sci. Tot. Environ. 372, 413–425 (2007).
16. Nickson, R. et al. Arsenic poisoning of Bangladesh groundwater. Nature 395, 338
(1998).
17. Smedley, P. L. & Kinnibugh, D. G. A review of the source, behaviour, and
distribution of arsenic in natural waters. Appl. Geochem. 17, 517–568 (2002).
18. Islam, F. S. et al. Role of metal-reducing bacteria in arsenic release from Bengal
delta sediments. Nature 430, 68–71 (2004).
19. Klump, S. et al. Groundwater dynamics and arsenic mobilization in Bangladesh
assessed using noble gases and tritium. Environ. Sci. Technol. 40, 243–250
(2006).
20. Ta, T. K. O. et al. Holocene delta evolution and sediment discharge of the Mekong
River, Southern Vietnam. Quat. Sci. Rev. 21, 1807–1819 (2002).
21. Nguyen, V. L., Ta, T. K. O. & Tateishi, M. Late Holocene depositional environments
and coastal evolution of the Mekong River Delta, Southern Vietnam. J. Asian Earth
Sci. 18, 427–439 (2000).
22. Tamura, T. et al. Depositional facies and radiocarbon ages of a drill core from the
Mekong River lowland near Phnom Penh, Cambodia: Evidence for tidal
sedimentation at the time of Holocene maximum flooding. J. Asian Earth Sci. 29,
585–592 (2007).
23. Swartz, C. H. et al. Mobility of arsenic in a Bangladesh aquifer: Inferences from
geochemical profiles, leaching data, and mineralogical characterization. Geochim.
Cosmochim. Acta 68, 4539–4557 (2004).
24. Stute, M. et al. Hydrological control of As concentrations in Bangladesh
groundwater. Wat. Resour. Res. (in the press).
25. Postma, D. K. et al. Arsenic in groundwater of the Red River floodplain, Vietnam:
Controlling geochemical processes and reactive transport modeling. Geochim.
Cosmochim. Acta 71, 5054–5071 (2007).
26. Rowland, H. A. L. et al. The control of organic matter on microbially mediated iron
reduction and arsenic release in shallow alluvial aquifers, Cambodia. Geobiology 5,
281–292 (2007).
27. Lear, G., Song, B., Gault, A. G., Polya, D. A. & Lloyd, J. R. Molecular analysis of
arsenate-reducing bacteria within Cambodian sediments following amendment
with acetate. Appl. Environ. Microbiol. 73, 1041–1048 (2007).
28. Pederick, R. L., Gault, A. G., Charnock, J. M., Polya, D. A. & Lloyd, J. R. Probing the
biogeochemistry of arsenic: Response of two contrasting aquifer sediments from
Cambodia to stimulation by arsenate and ferric iron. J. Environ. Sci. Health A 42,
1763–1774 (2007).
29. Landsat map ID 039-880, 11 July 2001 (Global Land Cover Facility, University of
Maryland); downloaded for Path 126, Row 052 using the Earth Science Data
Interface Æhttp://glcfapp.umiacs.umd.edu:8080/esdi/index.jspæ.
Supplementary Information is linked to the online version of the paper at
www.nature.com/nature.
Acknowledgements This work was supported by Stanford University, US NSF and
US EPA STAR. We thank K. Ouch, K. Phan, co-workers at Resource Development
International, G. Li, M. Meyer, M. Busbee and A. Aziz for field and laboratory
assistance; S. Ganguly for modelling assistance; and A. Boucher for help with
spatial analyses.
Author Contributions All authors contributed to the intellectual design, execution,
interpretation and analyses presented in this study. M.L.P. assessed groundwater
hydrology and geochemistry; B.D.K. analysed near-surface biogeochemistry; S.G.B.
established the hydrologic framework (field layout and data collection) and
conducted the modelling; M.S. facilitated the field work and provided the scientific
history of the area; S.F. provided the project impetus, biogeochemical deduction,
and, with S.G.B. and M.L.P., site selection. M.L.P., S.G.B. and S.F. wrote the
manuscript with input from B.D.K.
Author Information Reprints and permissions information is available at
www.nature.com/reprints. Correspondence and requests for materials should be
addressed to S.F. (fendorf@stanford.edu).
LETTERS NATURE|Vol 454|24 July 2008
508
©2008 Macmillan Publishers Limited. All rights reserved
- 5. METHODS
Well installation, sediment collection and lysimeter installation. Wells were
installed using a local drilling method by manually rotating a 1.5-inch-diameter
pipe with a 4-inch-diameter open cutting tip. Lengths of 3 m were added sequen-
tially to extend the pipe to desired well depths (up to 60 m), and water was
pumped downward through the middle to physically displace the sediment.
Once drilling was complete, the pipe was removed from the hole and 1.25-
inch-diameter PVC tubing was installed to create the wells. At each location,
3–5 wells were put in, spanning the following depths: shallow (8–12 m), medium
(20–30 m) and deep (36–60 m). Discrete, pre-fabricated well screens were used at
the bottom of the PVC; screening intervals were 6–8 m for shallow wells and 4 m
for medium and deep wells. Once the PVC was installed, holes were backfilled
with coarse sand and capped with clay and/or cement.
Because of the potential for homogenization and oxidation of drill cuttings, an
alternative, intact coring procedure was used at selected locations for sediment
retrieval. A 0.75-inch open core device fitted with a polycarbonate sleeve and
core-catcher was deployed through the drilling pipe at 3 m intervals and driven
into the undisturbed sediment below the drilling tip. Once retrieved, samples
were immediately capped and sealed in O2-impermeable pouches with
AnaeroPacks (Mitsubishi Gas Chemical) to prevent oxidation of the sediments.
Sediment samples were stored and transported at 4 uC.
In order to monitor near-surface porewater chemistry at discrete depths,
ceramic cup lysimeters were installed in a sediment profile in the abandoned
river channel ponds at depths of 0.1, 0.5, 1, 2 and 4 m. Holes were dug with a
hand auger and soil cores were collected in undisturbed sediments below the
extent of augering; samples were preserved as above. Following lysimeter
installation, holes were backfilled with native clay.
Clay sediment samples for 14
C analysis were obtained at multiple depths from
a ,16 m pit created by a mechanical excavator. Samples were collected from the
pit wall using 0.5 m copper pipes that were pounded horizontally into the sedi-
ments. The pipes were dug out and ends were immediately sealed in the field with
paraffin wax. The central portions of the cores were used for 14
C analyses con-
ducted at the NSF-University of Arizona AMS facility.
Water level measurements. Hydraulic heads in each well were measured weekly
with an electronic water level tape. Surface water levels were also measured
weekly with a weighted measuring tape from points of fixed height. All reference
points for water level measurements were spatially linked by vertical surveying
with an auto level (manufacturer reported 2.5 mm accuracy per double km run);
field error was ,5 mm on closed loops.
Elevations were referenced with Mekong River stage levels provided by the
Mekong River Commission. Distance-weighted averages from the Phnom Penh
port (upstream of our site) and the Neak Luong (downstream) stations were
used to calibrate the absolute elevation of our water level monitoring site in the
Mekong River, and the remainder of the water level measurements throughout
our field area were adjusted accordingly.
Water sampling. Wells were sampled with a peristaltic pump at flow rates of
,1 l min21
. A multiparameter probe equipped with a flow-through cell was
placed in the outflow line to monitor dissolved oxygen, pH, conductivity, tem-
perature and Eh. Wells were purged before sample collection until multipara-
meter stabilization was observed (typically 30–130 min). If a well could not be
pumped continuously (that is, low yield), it was pumped dry and the re-infil-
trated water was collected on the following day.
Groundwater samples were filtered with 0.45 mm filters and collected in acid-
washed bottles. Samples for cations and total arsenic concentrations were acidi-
fied with trace-metal grade HCl to pH , 2. Samples for anion analyses were
pretreated with a Bio-Rad AG50W-X8 cation exchange resin in hydrogen form
(Bio-Rad Laboratories) to prevent oxidative metal precipitation and subsequent
anion scavenging. Arsenic speciation in the field was performed by acidification
of ground water to pH 3, followed by treatment with a Bio-Rad AG1-X8 anion
exchange resin in acetate form to remove As(V). Dissolved organic carbon
(DOC), nitrate and ammonium samples were acidified with HCl and sterilized
with HgCl2. The majority of wells were sampled once during the wet season and
once during the dry season. A subset of wells along a transect from the Mekong
River was sampled approximately monthly.
Lysimeters were allowed to equilibrate with pore water for 30 d before sample
collection; during this time, samples were routinely collected and discarded.
Each lysimeter was subsequently sampled bimonthly from August 2005 to
September 2006. Pore water was drawn by suction (2800 mbar) into bottles,
each containing 15 ml of trace-metal grade 3 M HCl for preservation of As and
Fe.
Surface water was collected in a churn bucket at the water–air interface and
sampling was performed as with the groundwater samples. Surface water sam-
ples were obtained monthly.
Analytical measurements. Measurements on aqueous samples were conducted
in the field and in the laboratory. Field measurements were performed for
arsenic, alkalinity, ferrous iron, nitrate, sulphate and sulphide; all but alkalinity
and dissolved sulphide were duplicated in the laboratory. Alkalinity measure-
ments were performed by pH-verified colorimetric titration. Ferrous iron,
nitrate, sulphate and sulphide were measured using standard colorimetric spec-
troscopic methods.
In the laboratory, aqueous-phase arsenic concentrations were analysed by
hydride generation inductively-coupled-plasma atomic emission spectroscopy
(HG-ICP-AES). Arsenate was reduced to arsenite with KI, and arsine gas was
subsequently formed by reaction with a 0.6% NaBH4/0.5% NaOH solution.
Detection limits were 5 mg l21
arsenic. 14
C measurements of DIC were performed
at the University of Waterloo Environmental Isotopes Laboratory. Elemental
solid-phase concentrations were determined after microwave digestion.
Sediment samples were chemically dissolved in 3:1 concentrated
HNO3:concentrated HF and the resulting solution was evaporated to dryness.
Following reconstitution in HCl, concentrations were measured by ICP-AES.
doi:10.1038/nature07093
©2008 Macmillan Publishers Limited. All rights reserved