More Related Content
Similar to TGS Arcis- Canada Curvature Attributes and Applications Poster
Similar to TGS Arcis- Canada Curvature Attributes and Applications Poster (20)
TGS Arcis- Canada Curvature Attributes and Applications Poster
- 1. A TGS COMPANY
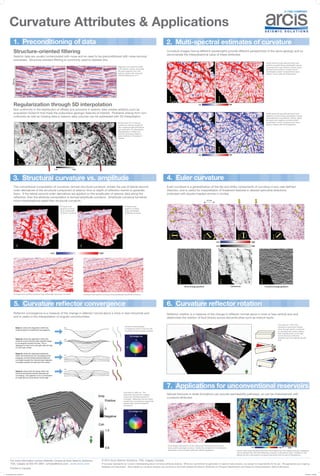
Curvature Attributes & Applications
1. Preconditioning of data
Structure-oriented filtering
Seismic data are usually contaminated with noise and so need to be preconditioned with noise removal
processes. Structure-oriented filtering is commonly used to address this.
Regularization through 5D interpolation
Non-uniformity in the distribution of offsets and azimuths in seismic data creates artifacts such as
acquisition footprint that mask the subsurface geologic features of interest. Problems arising from non-
uniformity as well as missing data in seismic data volumes can be addressed with 5D interpolation.
Segment of an inline from (left)
a 3D seismic volume, and (right)
the same segment from the
seismic volume with structure-
oriented filtering run on it
Stratal slices 32 ms through
coherence volumes computed
from amplitude data (left) before,
and (right) after 5D interpolation.
Regularization of offset and
azimuth information leads to
better definition of features of
interest.
2. Multi-spectral estimates of curvature
Curvature images having different wavelengths provide different perspectives of the same geology and so
demonstrate the interpretational value of these attributes.
Stratal slices through (left) principal most-
positive curvature (long-wavelength) volume
computed from input seismic volume, (right)
principal most-positive curvature (short
wavelength) volume computed from input
seismic volume after 5D interpolation.
Stratal slices through (left) principal most-
negative curvature (long-wavelength) volume
computed from input seismic volume, (right)
principal most-negative curvature (short-
wavelength) volume computed from input
seismic volume after 5D interpolation.
3. Structural curvature vs. amplitude
The conventional computation of curvature, termed structural curvature, entails the use of lateral second-
order derivatives of the structural component of seismic time or depth of reflection events to generate
them. If the lateral second-order derivatives are applied on the amplitudes of seismic data along the
reflectors, then the attribute computation is termed amplitude curvature. Amplitude curvature furnishes
more interpretational detail than structural curvature.
Principal most-positive curvature long-wavelength structural curvature
Principal most-
positive curvature
(long-wavelength)
structural curvature
Principal most-
positive curvature
(long-wavelength)
amplitude curvature
Principal most-positive curvature long-wavelength amplitude curvature
5. Curvature reflector convergence
Reflector convergence is a measure of the change in reflector normal about a more or less horizontal axis
and is useful in the interpretation of angular unconformities.
Case-1: where the deposition within the
channel shows no significant convergence.
Case-2: where the deposition within the
channel is such that the west channel margin
is converging towards the east. This is
displayed in color to the far right with the help
of a 2D color wheel.
Case-3: where the deposited sediments
within the channel are not converging at the
margings, but the levee/overbank deposits
converge towards the channel (west deposits
converge towards the east and vice-versa.)
Case-4: where both the strata within the
channel and levee/overbank deposits are
converging. This appears to be a combination
of cases (b) and (c) as shown to the right.
Time slice at 1600 ms. The
sediments indicated by magenta
arrows are thinning towards the
northeast. Reflectors that are nearly
parallel (low convergence magnitude)
appear white and are rendered
transparent
Cartoons demonstrating
convergence within a channel with
or without levee/overbank deposits
6. Curvature reflector rotation
Reflector rotation is a measure of the change in reflector normal about a more or less vertical axis and
determines the rotation of fault blocks across discontinuities such as wrench faults.
Time slice at 1.190 x from
coherence volume and vertical
slices through seismic amplitude
co-rendered with vector rotation.
Red indicates down to the right
across the fault, while blue
indicates up to the right across the
fault
7. Applications for unconventional reservoirs
Natural fractures in shale formations can provide permeability pathways, so can be characterized with
curvature attributes.
Chair display with seismic on the vertical and horizon slice from the k1
most-positive principal curvature. Notice the correlation of the difference
lineaments on the curvature with their seismic signatures. Horizon slice at the Muskwa level (Horn River Basin) from the relative acoustic impedance
volume derived from thin-bed reflectivity inversion of 3D seismic data. Overlaid on this
display are the most-positive curvature lineaments with the use of transparency.
4. Euler curvature
Euler curvature is a generalization of the dip and strike components of curvature in any user-defined
direction, and is useful for interpretation of lineament features in desired azimuthal directions.
(indicated with double-headed arrows in circles)
For more information contact Satinder Chopra at Arcis Seismic Solutions,
TGS, Calgary at 403.781.5851, schopra@arcis.com. www.arcis.com
© 2013 Arcis Seismic Solutions, TGS, Calgary, Canada
This poster represents our current understanding about curvature attribute analysis. While we recommend its application to seismic data analysis, we accept no responsibility for its use. We appreciate your ongoing
feedback and discussion. More details on curvature analysis can be found in the book entitled 3D Seismic Attributes for Prospect Identification and Reservoir Characterization, (SEG Publication).
Printed in Canada
CurvaturePoster_white_24x36.indd 1 2013-09-13 2:08 PM