SPG_SEG_2016_Beijing_Seismic Expression of Polygonal Fault System
•
0 likes•202 views


Recommended
More Related Content
What's hot
What's hot (20)
Similar to SPG_SEG_2016_Beijing_Seismic Expression of Polygonal Fault System
Similar to SPG_SEG_2016_Beijing_Seismic Expression of Polygonal Fault System (20)
SPG_SEG_2016_Beijing_Seismic Expression of Polygonal Fault System
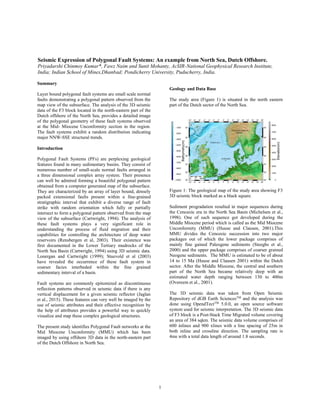
- 1. 1 Seismic Expression of Polygonal Fault Systems: An example from North Sea, Dutch Offshore. Priyadarshi Chinmoy Kumar*, Fawz Naim and Sunit Mohanty, AcSIR-National Geophysical Research Institute, India; Indian School of Mines,Dhanbad; Pondicherry University, Puducherry, India. Summary Layer bound polygonal fault systems are small scale normal faults demonstrating a polygonal pattern observed from the map view of the subsurface. The analysis of the 3D seismic data of the F3 block located in the north-eastern part of the Dutch offshore of the North Sea, provides a detailed image of the polygonal geometry of these fault systems observed at the Mid- Miocene Unconformity section in the region. The fault systems exhibit a random distribution indicating major NNW-SSE structural trends. Introduction Polygonal Fault Systems (PFs) are perplexing geological features found in many sedimentary basins. They consist of numerous number of small-scale normal faults arranged in a three dimensional complex array system. Their presence can well be admired forming a beautiful polygonal pattern obtained from a computer generated map of the subsurface. They are characterized by an array of layer bound, densely packed extensional faults present within a fine-grained stratigraphic interval that exhibit a diverse range of fault strike with random orientation which fully or partially intersect to form a polygonal pattern observed from the map view of the subsurface (Cartwright, 1994). The analysis of these fault systems plays a very significant role in understanding the process of fluid migration and their capabilities for controlling the architecture of deep water reservoirs (Rensbergen et al, 2003). Their existence was first documented in the Lower Tertiary mudrocks of the North Sea Basin (Cartwright, 1994) using 3D seismic data. Lonergan and Cartwright (1999); Stuevold et al (2003) have revealed the occurrence of these fault system in coarser facies interbeded within the fine grained sedimentary interval of a basin. Fault systems are commonly epitomized as discontinuous reflection patterns observed in seismic data if there is any vertical displacement for a given seismic reflector (Jaglan et al., 2015). These features can very well be imaged by the use of seismic attributes and their effective recognition by the help of attributes provides a powerful way to quickly visualize and map these complex geological structures. The present study identifies Polygonal Fault networks at the Mid Miocene Unconformity (MMU) which has been imaged by using offshore 3D data in the north-eastern part of the Dutch Offshore in North Sea. Geology and Data Base The study area (Figure 1) is situated in the north eastern part of the Dutch sector of the North Sea. Figure 1: The geological map of the study area showing F3 3D seismic block marked as a black square. Sediment progradation resulted in major sequences during the Cenozoic era in the North Sea Basin (Michelsen et al., 1998). One of such sequence got developed during the Middle Miocene period which is called as the Mid Miocene Unconformity (MMU) (Huuse and Clausen, 2001).This MMU divides the Cenozoic succession into two major packages out of which the lower package comprises of mainly fine gained Paleogene sediments (Steeghs et al., 2000) and the upper package comprises of coarser grained Neogene sediments. The MMU is estimated to be of about 14 to 15 Ma (Huuse and Clausen 2001) within the Dutch sector. After the Middle Miocene, the central and southern part of the North Sea became relatively deep with an estimated water depth ranging between 130 to 400m (Overeem et al., 2001). The 3D seismic data was taken from Open Seismic Repository of dGB Earth SciencesTM and the analysis was done using OpendTectTM 5.0.0, an open source software system used for seismic interpretation. The 3D seismic data of F3 block is a Post-Stack Time Migrated volume covering an area of 384 sqkm. The seismic data volume comprises of 600 inlines and 900 xlines with a line spacing of 25m in both inline and crossline direction. The sampling rate is 4ms with a total data length of around 1.8 seconds.
- 2. SEG/SPG 2016 International Geophysical Conference Methodology & Analysis Taking into account the fact that any distortion effects whether near-surface or relating to amplitude or phase responses, should be taken care, the seismic data was optimally conditioned. We began to condition the data by computing dip-azimuth volume from the existing seismic data volume. This volume is called as steering cube (Tingdhal 1999; Tingdhal et al., 2001) which was prepared by using a phase based dip calculation algorithm that utilizes seismic phase attribute. Once the steering cube got prepared, a median statistical filter known as Dip-steered Median Filter (DSMF) was applied on the seismic data using the pre-processed steering cube. This resulted in a smoothed seismic volume (Figure 3(b)) thereby improving the continuity of the seismic reflectors and removing the background random noise. Seismic data generally exhibit a diffused character closer to a fault zone (Jaglan et al., 2015). Thus to optimize for this and improving the sharpness of the faults an intermediate filter called as dip- steered diffusion filter (DSDF) was applied which resulted a diffusion seismic volume. Both of these (DSMF and DSDF) seismic volumes were combined using a logical expression that gave rise to a fault enhanced seismic (FES) data (Figure 3(c)). This fault enhanced seismic data was used as an input for seismic attribute analysis. The Time Slice was then analyzed to visualize the fault networks. It was observed that these fault networks showed their prominence at t = 1.3 seconds (Figure 4) covering the NW, SW and NE parts of the block. Keeping in mind these facts and with the available geological markers, a suitable horizon from the top of the formation (MMU) (Figure 5) was picked at every 5th inline and crossline. Taking into account the fact that horizon picked on the seismic data would get contaminated by the miss-picks which could result in misleading interpretation, the horizon was filtered using median filtering technique. Fault signatures are generally more pronounced with high discontinuity or low similarity in seismic events. A similarity attribute volume that gives a direct measurement of discontinuities in the seismic events, was computed using fault enhanced seismic data as input. This attribute is very sensitive to phase changes, which makes it very useful to highlight vertical displacements associated with faults. When this attribute was visualized over time slice t = 1.3 seconds (Figure 6), the polygonal networks of the fault were imaged in a more enhanced way, most of which was observed in the NWSW and NE part of the block. Similarly, volumetric curvature attributes (most positive and most negative) (Figure 7 (A & B)) were computed using pre-computed dip field. These attributes were then corendered (opacity = 50%) using similarity attribute volume (Figure 7(C)) to correlate the areas of low similarity with that of the curvature images. Figure 3: Inline 425 from the seismic data volume showing (a) Original seismic volume, (b) Dip-Steered Median Filter seismic volume (DSMF), and (c) Fault Enhanced Seismic data volume (FES).The fault enhanced seismic data shows a sharper definition of faults thereby improving visualization. The attributes were also visualized over the horizon picked at the top of the formation (Figure 8). Fault discontinuities were clearly brought though this analysis. Most of them were pronounced in NWSW and NESE areas of the block. The similarity attribute volume was corendered (opacity=50%) with most positive and most negative curvature attributes and displayed over the horizon slice in- order to correlate the fault images obtained from the similarity attribute with that of the curvature images. Subsequently the rose plot (Figure 9) was prepared in-order to understand the orientation of these irregular fault geometries. From the rose plot it was observed that, the polygonal fault system exhibits a wide range of strike pattern indicating the major EW trend.
- 3. SEG/SPG 2016 International Geophysical Conference Figure 4: Visualization of Polygonal Fault networks over Time slice at time t = 1.3 seconds. The fault networks are indicated by green ovals, displayed using grey color scale and these networks much more prominent at this time level. Figure 5: Horizon slice for the Mid Miocene Unconformity top. The horizon was tracked in every 5th inline and crossline from the seismic data volume. Conclusions The analysis of 3D seismic data of F3 block suggests that, the Mid Miocene Unconformity is characterized by the layer-bound fault system which is polygonal in nature. The seismic attribute study bought out clearly the polygonal nature of these layer bound fault system. Further research can be carried out to understand the response of these fault systems for understanding the fluid migration mechanism and reservoir architecture. Figure 6: Time Slice at t = 1.3 seconds obtained from similarity volume using fault enhanced seismic volume as an input. The fault networks are characterized by low similarity, indicated within squared boxes and displayed using similarity color scales. Acknowledgments The authors provide their sincere thanks to the Department of Applied Geophysics, Indian School of Mines, Dhanbad for providing support and encouragements to carry out this work. Thanks to dGB Earth ScienceTM for making seismic data freely available for the public and for providing their software for academic research. A special thanks to Miss Karabi Talukdar for her support and encouragements. References Cartwright, J.A, 1994. Episodic basin-wide hydrofracturing of overpressured early Cenozoic mudrock sequences in the North Sea Basin. Marine and Petroleum Geology, 11(5), pp.587-607. Huuse, M., and Clausen, O.R., 2001. Morphology and origin of major Cenozoic boundaries: eastern Danish North Sea. Basin Research, 13, pp.17-41. Jaglan, H., Qayyum, F. and Helen, H., 2015. Unconventional seismic attributes for fracture characterization. First Break, 33 (3), pp.101-109. Lonergan, L. and Cartwright, J.A., 1999. Polygonal faults and their influence on deep-water sandstone reservoir geometries, Alba Filed, United Kingdom Central North Sea. AAPG bulletin, 83(3), pp.410-432. Overeem, I., Weltje, G.J., Bishop-Kay, C. and Kroonenberg, S.B., 2001. The Late Cenozoic Eridanos delta system in the Southern North Sea Basin: a climate signal in sediment supply?. Basin Research, 13(3), pp.292- 312.
- 4. SEG/SPG 2016 International Geophysical Conference Steeghs, P., Overeem, I. and Tigrek, S., 2000. Seismic volume attribute analysis of the Cenozoic succession in the L08 block (Southern North Sea). Global and Planetary Change, 27(1), pp.245-262. Stuevold, L.M., Faerseth, R.B., Arnesen, L. Cartwright, J. and Moller, N., 2003. Polygonal faults in the Ormen Lange field, More basin, offshore mid Norway. Geological Society, London, Special Publications, 216(1), pp.263-281. Figure 7: Time Slice at t = 1.3 seconds obtained from (a) most positive (b) most negative volumetric curvature attribute and (c) corendering similarity with volumetric curvature attributes shows that the areas of minimum similarity correlates with that of the curvature images. Tingdhal, K.M., 1999. Improving seismic detectibility using intrinsic directionality; Technical Report, Earth Sciences Center, Goteborg University, B194. Tingdhal, K.M., Brill, A. H. and de Groot, P. E. M., 2001. Improving seismic chimney detection using directional attributes, Journal of Petroleum Science and Engineering, 29, pp.205-211. Figure 8: Horizon Display of similarity attribute corendered with most positive and most negative attribute to correlate the fault signatures with that of the curvature images. Figure 9: Rose Plot showing the random distribution of the polygonal fault networks. Note that the polygonal fault networks shows a random strike distribution indicating major EW trend.