1. Atomic water channel controlling remarkable properties of a single
brain microtubule: Correlating single protein to its
supramolecular assembly
Satyajit Sahu a
, Subrata Ghosh a
, Batu Ghosh c
, Krishna Aswani d
, Kazuto Hirata b
,
Daisuke Fujita a
, Anirban Bandyopadhyay a,n
a
Nano Characterization Unit, National Institute for Materials Science, 1-2-1 Sengen, Tsukuba, Ibaraki 305-0047, Japan
b
Vortex Dynamics Group, National Institute for Materials Science, 1-2-1 Sengen, Tsukuba, Ibaraki 305-0047, Japan
c
Materials and Nano-architectronics, National Institute for Materials Science, 1-2-1 Sengen, Tsukuba, Ibaraki 305-0047, Japan
d
Surface Characterization Group, Nano Characterization Unit Advanced Key Technologies Division, National Institute for Materials Science, 1-2-1 Sengen,
Main Bldg, Room-815 Tsukuba, 305-0047, Japan
a r t i c l e i n f o
Article history:
Received 7 January 2013
Received in revised form
20 February 2013
Accepted 21 February 2013
Available online 15 March 2013
Keywords:
Microtubule
Tubulin protein
Scanning tunneling microscopy
Four probe electronic device
Atomic force microscopy
Resonance spectroscopy
a b s t r a c t
Microtubule nanotubes are found in every living eukaryotic cells; these are formed by reversible
polymerization of the tubulin protein, and their hollow fibers are filled with uniquely arranged water
molecules. Here we measure single tubulin molecule and single brain-neuron extracted microtubule
nanowire with and without water channel inside to unravel their unique electronic and optical properties
for the first time. We demonstrate that the energy levels of a single tubulin protein and single microtubule
made of 40,000 tubulin dimers are identical unlike conventional materials. Moreover, the transmitted ac
power and the transient fluorescence decay (single photon count) are independent of the microtubule
length. Even more remarkable is the fact that the microtubule nanowire is more conducting than a single
protein molecule that constitutes the nanowire. Microtubule's vibrational peaks condense to a single mode
that controls the emergence of size independent electronic/optical properties, and automated noise
alleviation, which disappear when the atomic water core is released from the inner cylinder. We have
carried out several tricky state-of-the-art experiments and identified the electromagnetic resonance peaks of
single microtubule reliably. The resonant vibrations established that the condensation of energy levels and
periodic oscillation of unique energy fringes on the microtubule surface, emerge as the atomic water core
resonantly integrates all proteins around it such that the nanotube irrespective of its size functions like a
single protein molecule. Thus, a monomolecular water channel residing inside the protein-cylinder displays
an unprecedented control in governing the tantalizing electronic and optical properties of microtubule.
& 2013 Elsevier B.V. All rights reserved.
1. Introduction
In spite of incredible claims, the carbon nanotube could not
revolutionize the industry due to complicacy in isolating metallic
and semiconducting nanotube, and the DNA adventure (Dekker and
Ratner, 2001; Fink and Schönenberger, 1999; Rakitin et al., 2001;
Storm et al., 2001; Zhang et al., 2002) turned critical due to its
extreme conformational-fluctuations on the atomic scale. The 25 nm
wide and from 200 nm to 25 μm long microtubule nanotube stores
cellular dynamics codes as doped drugs inside its main constituent
tubulin protein similar to ATGC that stores DNA's genetic code.
Nature has a catalog of microtubule's cellular code, in all eukaryotes,
plants, animals, fungi and Protista kingdom for 3.5 billion years. It
forms a complex network inside neurons and living cells controlling
fundamental life functions via massively parallel and hierarchical
information processing (Barabási and Albert, 1999; Butts, 2009;
Gerhart et al., 1997; Moriya et al., 2001; Song et al., 2005; Strogatz,
2001). Since single tubulin and microtubule properties were never
studied extensively, here we cater state-of-the-art technologies to
unravel the electronics and information processing in these systems
(Mange and Tomassini, 1998; Sipper, 2002; Teuscher et al., 2003;
Zhang and Gao, 2012). As microtubules are dipped into an extremely
noisy cellular soup (Braun et al., 2003; Roberts et al., 2011; Shibata
and Ueda, 2008; Szendro et al., 2001a, 2001b), the properties studied
therein contain artifacts, while noise-free bio-material studies are
irrelevant to real bio-systems (Roberts et al., 2011). Yet, microtubule is
a rigid elastic string unlike DNA and its composition of lattice
mixtures is many folds more resourceful than carbon nanotube with
no isolation issues—a prime candidate for the state-of-the-art inves-
tigations to unravel its embedded nanotechnologies.
The naturally produced drug molecules were automatically
doped inside the tubulin protein to add unique properties to the
Contents lists available at SciVerse ScienceDirect
journal homepage: www.elsevier.com/locate/bios
Biosensors and Bioelectronics
0956-5663/$ - see front matter & 2013 Elsevier B.V. All rights reserved.
http://dx.doi.org/10.1016/j.bios.2013.02.050
n
Corresponding author. Tel.: þ81 298592167.
E-mail addresses: anirban.bandyo@gmail.com,
anirban.bandyopadhyay@nims.go.jp (A. Bandyopadhyay).
Biosensors and Bioelectronics 47 (2013) 141–148
2. microtubule while keeping the original properties intact. During
design and construction of microtubule for a particular species
following this route (Nielsen et al., 2010, 2006; Redeker et al.,
2004), the microtubule structure remained unchanged. The origin
of this flexibility is unknown. Moreover, the fusion of DNA-like
coding via drug-molecules and carbon nanotube like modulation
of property by changing lattice parameters requires identification
of its true nano-material class. Consequent theoretical predictions
of its remarkable properties (Sahu et al., 2011) were not
verified experimentally. In this first comprehensive documenta-
tion, we underpin both the fundamental and the applied poten-
tials of this nanotube. We compare single tubulin and
microtubule's properties when water channel resides in its core
and then after releasing the water in a controlled manner. The
water channel couples helically wrapped tubulins such that even
though microtubule is a complex composition of several distinct
structural symmetries only the single tubulin property defines the
microtubule property.
Protein is a single chain polymer, but folds into various patterns,
called secondary structures; switching of these structures into an
astronomically large number of combinations is restricted via
allowed and blocked symmetries. Tubulin protein has two parts,
α and β, both appear similar, connected face-to-face, see Fig. 1a.
They assemble in a hexagonal close packing into a 2D sheet which
folds into a hollow cylinder wrapped around a water channel
(see Fig. 1a).
2. Results and discussion
2.1. Identical energy levels of tubulin protein and microtubule
Since combined excitation emission spectroscopy (CEES) pro-
vides fluorescence as a function of excitation and emission, the
exact peak locations are identified, from which the allowed
energy-level transitions in tubulin protein and microtubule were
calculated (Fig. 1b). By density-variation-CEES-study, the threshold
density 60 μM/ml is determined at which tubulin proteins and
microtubules start interacting with each other, synchronously. So
tubulin and microtubule solution were kept at a very low density
(o10 μM/ml) (Dierolf and O’Donnell, 2010; Dierolf and Koerdt,
2000). Due to synchronization, fluorescence intensity oscillates
periodically; onset of such oscillation in tubulin solution is shown
in Fig. 1c. For microtubule solution, periodic oscillation disappears
at lower than its threshold density (Fig. 1d). Identical energy level
transitions of a single tubulin dimer and microtubule (Fig. 1b right)
are the outcome of an unprecedented phenomenon. The remark-
able fact that 30,000–40,000 dimers assemble into microtubule
without changing the fundamental energy levels depicts that the
energy levels of all tubulins interact but do not modify the levels in
the polymer form. Band theory of metal, insulator or semiconduc-
tor is not applicable here, since two distinct transitions in Fig. 1b,
eventually converge to the same levels so that emissions are
always the same irrespective of the energy absorption in a single
Fig. 1. Optical properties of tubulin and microtubule: (a) Structure and basic parameters of a single tubulin and microtubule. (b) Combined excitation emission spectroscopy
(CEES) of tubulin (left), microtubule (middle) and extracted energy level transitions in the right (tubulin and microtubule have similar energy levels). Green and blue
transitions are two distinct transitions seen in CEES. (c) The three peaks of the CEES spectrum of tubulin are individually pumped, decay in total emission-intensity is plotted
over time. Excitation and emission points are N (274 nm, 330 nm), O (274 nm, 671 nm) and M (561 nm, 330 nm). (d) Temporal relaxation of three peaks of the CEES spectrum
of the microtubule, measured and plotted similarly as tubulin.(For interpretation of the references to color in this figure legend, the reader is referred to the web version of
this article.)
S. Sahu et al. / Biosensors and Bioelectronics 47 (2013) 141–148142
3. tubulin or microtubule. This behavior argues microtubule and
tubulin as strong candidates for the spontaneous noise alleviation.
2.2. Binary condensation of vibration and non-linear ultra-fast
relaxation
The optical study shows that external energy pumped into
different levels converge into one similar to the energy condensa-
tion (Mesquita et al., 1993; Moskalenko et al., 1980; Rotaru et al.,
1999), one could alternately model this behavior with fractured
band structure (Grigor’kin and Dunaevskiĭ, 2007; Michalski and
Mele, 2008; Prodan and Prodan, 2009). The temporal relaxations
for three fluorescence peaks for 900 s suggest that for tubulin and
microtubule, even intensity variation follows the same trend; in
the absence of synchronization, it is an exponential decay process.
Microtubule's synchrony is a profoundly documented phenom-
enon (Ahmad et al., 1994; Carlier et al., 1987), an optical study
suggests that tubulin's global synchrony-behavior encompassing
all proteins is responsible for the observed properties of protein-
built polymer microtubule. In other words, the incredible micro-
tubule properties are encoded in the structure of the tubulin
protein.
Fig. 2a shows that increasing the intensity of LASER power
increases the emission linearly for tubulin. Therefore, neither single
tubulin-dynamics survives for long, nor does it demonstrate any
non-linear properties. However, similar studies with microtubule
show that the emission intensity increases non-linearly, which
means that the pumped energy vibrates all tubulins in the micro-
tubule to a particular energy level that does not allow absorption of
energy from outside, eventually, microtubule emits entire energy
imparted to it. Literatures argue that non-linearity suggests optical
cavity (Agarwal et al., 2005; Jelínek and Pokorný, 2001; Oulton
et al., 2008; van Vugt et al., 2009), therefore, the correlation
between condensation of energy levels and the cavity effect need
to be carefully articulated. This particular finding supports our CEES
observation that band structures of tubulin and microtubule are the
same. The tubulins couple inside microtubule synchronously alle-
viating the noise or excess energy injected into it and at the same
time, coupling induced energy level condensation defines the
property of a single tubulin as the property of entire microtubule
(except the relaxation time). Raman spectrum underpins the
molecular origin of synchrony in tubulin and microtubule. Particu-
lar vibrational peaks of tubulin (Audenaert et al., 1889) survive in
microtubule (Fig. 2b and c) along with the new atomic vibrations
characteristic of a microtubule. The additional vibrational modes of
microtubule are related to the elastic string properties. The elastic
atomic residues located in the tubulins and distributed all over the
microtubule oscillate in harmony to transport and drain out excess
energy; this contributes to identical energy transmissions in the
CEES spectrum.
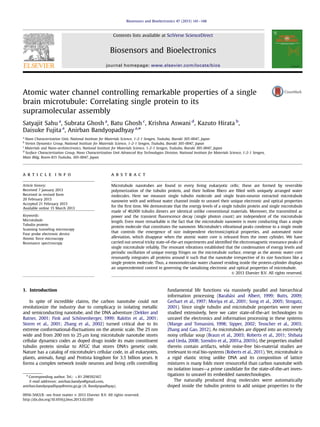
In the 2D surface Raman profile of a single microtubule (Fig. 2d),
particular vibrational frequency is assigned a particular color, thus,
localizations of two similar colored dots, red and green exhibit the
convergence of vibrational energy into two particular regions. Thus,
the distribution of red and green dots along the microtubule length
confirms that the vibrations surviving for pico-seconds and nano-
seconds are homogeneously distributed all over the length of the
microtubule, tubulins are coherently vibrating. Finally, in Fig. 2(e)
10 20 30 40
0
2k
4k
6k
8k
10k
Count(photonnumber)
Time (nanosec)
Microtubules
Tubulin
Surface profile
Time evolution
600 2200
600 2200
Raman shift (cm-1
)
Single MT
Fig. 2. Raman and single photon count (TCSPC) studies: (a) With the increasing laser power, excitation (276 nm)-emission spectra are plotted for the 20 mM solution of
microtubule; the arrow shows increase in emission intensity. Inset shows a comparative plot of intensity variation with laser power for tubulin (green) and microtubule
(black). We have calculated Q-factor or ratio of peak to the full width half maxima (FWHM) for all laser exposure (red). (b) Raman spectra for tubulin (blue, Si surface blank
spectrum) and (c) Raman spectrum for microtubule (blue, Si) in solution dropped on a Si-substrate. (d) 2D Raman profile on a single microtubule pointed with a white arrow
in a four-probe device (inset, shown with white circle). Each pixel on this 2D plot represents a Raman plot shown below; several such plots were measured successively with
time (the green 2D plot, time increases top to bottom) in the range 600–2200 cm−1
. (e) The measured TCSPC data obtained with 259 nm excitation, 330 nm emission for
tubulin (open circle) and microtubule (red line); is fitted with four exponential functions, t1 is ∼0.3 ns, t2 is ∼2 ns, t3 is 5–6 ns, t4 is neglected as it is in micro-seconds.
(For interpretation of the references to color in this figure legend, the reader is referred to the web version of this article.)
S. Sahu et al. / Biosensors and Bioelectronics 47 (2013) 141–148 143
4. time correlated single photon counts (TCSPC) were plotted for
microtubule and tubulin protein to find that the relaxation times
in the nano- and pico- second domains are also identical. During
optical measurements in solution microtubule length was approxi-
mately 1–2 μm, since 1 μm long microtubule has 1625 tubulin
dimers, hence experimental evidences confirm that even after
assembling into microtubule the energy levels and the relaxation
behavior of tubulin protein do not change.
2.3. Tunneling image and atomic resolution study of single tubulin
and single microtubule with and without water
We begin the electronic study with tubulin protein imaging. Only
HOPG isolates single proteins during adsorption. Sometimes, two
single protein dimers are paired; by rotating the STM tip-scan angle
(Fig. 3a) tubulins were separated. To measure the electronic property,
tubulin molecules were immobilized on the HOPG substrate at 77 K.
As standard protocol, the current voltage characteristic (IV) was first
measured on the HOPG substrate, then on the single tubulin
molecule and finally the STM tip was moved back to the substrate
and measured IV again. The cyclic process was repeated to confirm
reproducibility. Fig. 3(a,b) shows how IV is measured along the length
of a single tubulin dimer to find that the central region of the dimer
suppresses the conductivity significantly. This is an interesting
observation, while studying single molecules it is always observed
(Bandyopadhyay et al., 2006, 2010; Bandyopadhyay and Wakayama,
2007) that the tunneling conductivity between the substrate and the
STM tip is less than that measured across the molecule. However, this
is just opposite for the tubulin protein. Since, to the best of our
knowledge this is the first report of electronic property for a single
protein unit, therefore, it is not possible to confirm at this point,
whether this is a general feature of the proteins or it is typical for the
tubulin protein. However, in spite of insulation by 4 nm tubulin the
remarkable electronics of 25 mm wide microtubule (Pizzi et al., 2011;
Priel et al., 2006) is a crucial transformation since one should not
expect any tunneling at all.
The IV of single tubulin molecule suggests that it is insulating,
but current increases linearly with the increasing bias. Since
Fig. 3. STM studies of a single tubulin and single microtubule: (a) The STM image of a single tubulin at þ2 V, 50 pA, the scale bar is ∼1.8 nm, the line shows where current–
voltage (IV) was measured. (b) IV characteristics across single tubulin protein (1 ms delay, 1 ms stabilization time), the trace color and dots on the tubulin STM image are kept
same. Inset shows a dI/dV plot using lock in amplifier, frequency∼1 kHz. (c) IV characteristics on a single microtubule þ2.7 V, 10 pA, across the points shown in the STM
image of microtubule (shown in inset top), scale bar ∼150 nm. Number denotes measurement sequence, blue and green plots correspond to massive current flow on the
microtubule. AFM image is shown in inset below, the scale bar is ∼25 nm. (d) STM images of microtubule edge (þ2.7 V, 10 pA; left, scale bar ∼20 nm) and isolated
protofilaments (þ2.7 V, 10 pA; right, scale bar ∼7 nm). (e) Transmission Electron Microscope (TEM) image of a ruptured microtubule whose water channel is released.
(f) TEM image of a single microtubule when water channel exists, one can see horizontal fringes.(For interpretation of the references to color in this figure legend, the reader
is referred to the web version of this article.)
S. Sahu et al. / Biosensors and Bioelectronics 47 (2013) 141–148144
5. linearity suppresses the normal exponential behavior, it suggests
filtering of the current by the single protein molecule. For the ac
measurement, the STM feedback loop is switched off (Oulton et al.,
2008), using external circuit single tubulin ac conductivity is
measured, which is much lower than the dc conductivity. The
differential dI/dV output shows multiple non-linear current beha-
viors in the inset of Fig. 3b, reflecting its capacitive storage
properties. By varying the tip bias during STM scanning it is seen
that the contrast changes homogeneously over α and β tubulins,
therefore, the charge that constitutes tubulin potential is always
homogeneously delocalized all over the protein structure.
To get microtubule we reconstitute Porcene brain neuron extracted
tubulins as described in Section 3. An extensive AFM and STM
measurements are carried out on the SiO2 and HOPG surfaces
respectively. Single tubulin protein is an insulator but single micro-
tubule is 1000 times more conducting as shown in Fig. 3c. To
understand the reason, the UHV condition is sustained at 77 K as
water molecules are released from the microtubule core—a typical end
part of a water-extracted microtubule is shown in Fig. 3d. Water-
extracted microtubule behaves like an insulator as shown in Fig. 3d
(right), therefore, the interstitial water channel inside microtubule is
solely responsible for the 1000 times more conductivity than tubulin.
The large tunneling current across 25 nm wide microtubule (insulator)
is not via tubulin-water-tubulin route, the water core should act as a
current source by storing charges. Dried microtubule does not show
energy levels identical to tubulin protein, therefore, the water channel
holds the proteins in a mechanism that does not allow splitting of
energy levels of tubulins.
Microtubule solution is dropped on the SiO2 substrate and four
electrodes are grown on top of it as shown in Fig. 4a so that the
longitudinal conductivity and other electronic measurements are
carried out (Makarovski et al., 2007; Samitsu et al., 2005; Walton
et al., 2007; Zheng et al., 2004). During four probe measurements
since current is sent from outer two electrodes and voltage drop is
measured across the two central electrodes, the 300 MΩ contact
resistance is nullified, and the measured resistance drops below
1 MΩ (Park, 2011). To understand the localized density of states on
the microtubule, it is imaged at 77 K at different tip biases to find
that electron density (Bandyopadhyay and Acharya, 2008; Smith
et al., 1990) is homogeneously distributed over the entire proto-
filament and any induced potential fluctuation is delocalized all over
the length (Fig. 3d (right)). The delocalization feature is responsible
for four-probe unique conductivity, and automated noise manage-
ment; again, delocalization disappears if water channel is removed.
Then, at a higher bias 42 V, proto-filaments disintegrate in one scan.
In the atomic force microscope (AFM) measurement, protofilaments
do not break apart. In the AFM images, only helical tubulin rings are
visible, while STM images show only longitudinal protofilaments,
when water is inside, otherwise, it is a disintegrated mass of proteins.
This suggests that the water channel (Fig. 3c inset) controls micro-
tubule's internal conductivity and force modulation. In TEM, both
helical ring and longitudinal fringes due to the water channel are
visible, if water channel is released the fringes disappear and rings
split (Fig. 3e, f).
2.4. Four-probe electrode based electronic measurement of single
microtubule device
The challenges associated with the microtubule's IV measure-
ment are discussed in the supporting online materials (Minoura
and Muto, 2006). Here we compare two cases (i) the device is
earthed and (ii) under floating condition, which estimates the
amount of charge storage at the junction. Microtubule exhibits
a perfectly square hysteresis behavior (Fig. 4a,b) (Damjanovic,
2006), it means the dipole moments of tubulin proteins rotate
synchronously by ±231, which plays a vital role in switching the
conductivity or memory states. The hysteresis area increases with
the maximum applied bias during an IV measurement, however,
the flat region does not disappear, and the flatness suggests an
alleviation of noise. The flatness originates during normalization,
the raw data suggest a small-angle slope in IV. Fig. 4c shows that
the square-nature survives even under extreme noise. However,
when a current source is used to measure IV, the device does not
show the square IV feature; beyond a certain input current, the
Fig. 4. Electronic studies of single microtubule with two-probe and four-probe: (a) The AFM image of a typical device design is shown, Au 200 nm wide 200 nm high
electrodes are to be grown, (b) Maximum bias variation, during IV-scan, all measured at 71 K. (c) Bias and temperature variation of memory-state measured by random-
cooling and heating, temperatures are noted inset. (d) The temperature is increased 70–300 K at 1 K/min and conductivity variation is plotted, dipole distribution on
microtubule surface is shown at right. (e) Transmission loss against a ∼300 MΩ resistance, due to microtubule resonance plotted as a function of frequency shows a dip at
9.8 MΩ.
S. Sahu et al. / Biosensors and Bioelectronics 47 (2013) 141–148 145
6. voltage output varied linearly, thus, the microtubule develops a
unique polarization beyond a threshold charge injection. The
dielectric studies on single microtubule device suggest that
microtubule has extremely large charge density 4.3 e/Å (Sanab
ria, 2005). This value is 106
times more than the conventional
inorganic semiconductors and 102
times lower than any metal,
therefore, classifying microtubule as metal, insulator or semicon-
ductor is incorrect (for the details of single microtubule conduc-
tivity measurement, see supporting information online). Thermal
noise flips the encoded conductivity of a single microtubule rand
omly, however, above 0.1 K/min heat injection, the conductivity
oscillates as shown in Fig. 4d. Thus, microtubule's automated noise
alleviation has a limit, under an extreme noise it is programmed to
oscillate around the encoded conductivity.
2.5. Automated noise alleviation and ac response of single
microtubule device
The most critical challenge to study ac response (Egard et al., 2010;
He et al., 2008) of a nanotube is the normalization (see Fig. S2(a–e)
online, detailed ac characterization is discussed online). Fig. 4e shows
that even ac power transmission is independent of the length of
the microtubule. Since proteins have incredibly large number of
transmission-channels and only a few respond under typical mea-
surements. Accurate identification required measuring the same
resonance peaks via different experimental setups, thus, statistically
dominant peaks were isolated as the most probable resonance peaks
by checking thousands of noise and actual peaks one by one. The
measurement of microtubule ac resonance requires a shielded
environment as shown in Fig. 5a. Three distinct circuits were used
as shown in Fig. 5b–e. Fig. 5b shows a circuit that sends ac signal
to the microtubule and then measures the dc resistance loss, the
frequency causing sharp increase in conductivity is the resonance
peak. Using Fig. 5c circuit, the transmittance and reflectance of
microtubule are plotted between 1 KHz and 20 GHz, therein at
particular frequencies, the transmittance is large. At these particular
frequencies, the microtubule sends ac signal with almost no resis-
tance (much less than 0.04 Ω). In Fig. 5d, e the transmittance
measurement is repeated, however, the ac input signal is bifurcated
using paired electrodes to induce an additional capacitive effect, so
that the contact effects of pseudo capacitive and inductive elements
are nullified. Three circuit outputs are shown in Fig. 5f, the common
peaks are taken into account as absolute resonance peak. Note that
there are several harmonics for each peak and if water channel is
released, no resonance peak is observed for the single microtubule.
2.6. Multiple comparative measurements of resonance band of single
microtubule
With the eight primary resonance peaks, the microtubule is truly
a vibrating resonant string (Jelı́nek et al., 1999; Jelínek and Pokorný,
2001) and this vibration survived when we dipped microtubules
in serum, hence living cells will exhibit these features. Microtubule
develops a positive and a negative polarity, and automatically
generates a potential gradient across its length, as a result, its
resistance differs if we use positive or negative voltage to measure
conductivity (Tran et al., 1997). In trillions of cells inside our body,
this particular electric field gradient along with autto-watt power
(1 fA, 90 mV) drive microtubules in a complex pattern to execute
several tasks, an additional MHz source could externally tune the
dynamic instability, which is the signature of several diseases. From
the comparative study of tubulin protein and single microtubule, it is
evident that if the nature changes only one property of a single
tubulin, the property of entire microtubule would change. It enables
nature to add a particular single molecule to tubulin to create cells of
a species that survive −30 1C or change the doped molecule to enable
it surviving at 60 1C for other species, and this practice is visible in
the plant, animal, fungi and Protista kingdom, but remained unno-
ticed. Microtubule is a generic platform in which nature has
synthesized peculiarities of robust species living around us.
3. Experimental section (details in the supporting online
material)
Microtubules are extracted from Porcine's brain by Cytoskele-
ton (Denver, CO), we purchased tubulin protein including all
associated tubulin-to-microtubule conversion kits, and reconsti-
tuted microtubule in our laboratory. Purified microtubule subunits
(tubulins) were preserved at −80 1C. To polymerize tubulin (Borisy
et al., 1975; Fygenson et al., 1994), into 6.5 μm long microtubules,
160 μl of Microtubule cushion buffer (60% v/v glycerol, 80 mM
Frequency (MHz)
ΔR
12 20 22 30 101 113 185 204
Fig. 5. Resonance studies of a single microtubule device: (a) An electronically shielded six-probe electronic characterization setup. (b) Circuit for manual resonance peak
detection. (c) Resonance peak measurement circuit for transmittance and reflectance measurements of an ac signal. (d) Bifurcated-electrode based microtubule chip design.
(e) Electronic circuit for bifurcated-electrode based resonance measurement. (f) Resistance-loss for resonance measurements with three circuits noted with colored circles as
a function of frequency measured from 1 kHz to 1.3 GHz. Statistically most-occurred peaks are noted above.
S. Sahu et al. / Biosensors and Bioelectronics 47 (2013) 141–148146
7. PIPES pH 6.8, 1 mM EGTA, 1 mM MgCl2) was added to 830 μl of
general tubulin buffer (80 mM PIPES pH 7, 1 mM EGTA, 2 mM
MgCl2) and 10 μl of 100 mM GTP solution. This mixture is kept in
an ice bath for 10 min. From this mixture, 200 μl solution is added
to 1 mg of tubulin and again it is incubated in an ice bath for
10 min. Afterwards this stock is placed in an incubator at 35–37 1C
for 40 min. Now, to stabilize microtubules 20 μl of Paclitaxal
dissolved in anhydrous DMSO is added to the solution and it is
incubated for a further 10 min at 37 1C. The microtubule length is
tuned ∼4–20 μm.
To prepare film, the solution is diluted 8 times using micro-
tubules cushion buffer and paclitaxol DMSO solution and dropped
on a 451 tilted Si (100) substrate and interdigited electrodes were
kept on a −20 1C bath overnight. An electric field is applied across
the substrate for parallel alignment of the microtubules. The
excess microtubule solution is removed from the substrate using
a filter paper (Whatman), this is the best route to carry out STM
and AFM studies. Now the substrate is dipped into General Tubulin
Buffer and once again dried blowing N2 in the similar fashion. The
process is repeated twice. The substrate is placed in a refrigerator
for 3 h to dry out the surface partially. Reconstitution of α and β
tubulin into αβ heterodimer of dimensions 46 Â 80 Â 65 Å3
is
confirmed via UHV-AFM and UHV-STM with an atomic sharp tip
that has 0.01 Å tip, we also confirmed the 13 proto-filaments in the
microtubules produced by Raman and STM/AFM imaging.
4. Conclusion
We have studied Combined Excitation Emission Spectroscopy
(CEES) and Raman for single tubulin protein, microtubule nano-
wire with and without water to find that the emission peaks in the
CEES plot as well as nano-seconds decay profile of fluorescence are
identical for isolated tubulin protein and the microtubule nano-
wire. Using AFM attached tip-enhanced Raman spectroscopy we
have determined that only a particular vibrational mode of the
microtubule is populated. These three results suggest that the
microtubule's optical and thermal vibrations are programmed
inside a single tubulin dimer, and that is eventually reflected
when we measure the single microtubule of any particular length.
To advance our conclusion further, we studied single protein
molecule and microtubule using STM and found that 25 nm
wide microtubule is more conducting than the 4 nm wide single
tubulin, which is significant. If the water channel is released, the
microtubule becomes an insulator once again, thus, the water
channel controls the conductivity of the microtubule. If we
combine two conclusions noted above, water channel and protein
molecule together control the emergent properties of the
material, the only possible relation that could couple water
molecule and protein is an electromagnetic resonant oscillation,
so we measured ac resonance properties to find a large number of
resonance peaks for the microtubule. In the future, we study these
resonance peaks for wireless communication, coherence and
synchrony, to understand the information processing in the
brain and in the living cell, to unravel a world beyond chemical-
only-biology.
Author Contributions
A.B designed research; S.S designed and built the microtubule
device; S.S, A.B, K.H and S.G performed the experiments; A.B and
S.S analyzed the data; A.B wrote the paper and D.F reviewed
the work.
Acknowledgment
The authors acknowledge Eiichiro Watanabe and Daiju Tsuya of
Nanotechnology Innovation Station, NIMS Sengen-site Nano-foun-
dry sponsored by Ministry of Science, Education, Culture and
Sports (MEXT), Govt. of Japan. The current research work is funded
by the Asian office of Aerospace R&D, Govt. of USA FA2386-11-1-
0001AOARD104173 and FA2386 -10-1-4059 AOARD-10-4059.
Appendix A. Supporting information
Supplementary data associated with this article can be found in
the online version at http://dx.doi.org/10.1016/j.bios.2013.02.050.
References
Ahmad, F.J., Joshi, H.C., Centonze, V.E., Baas, P.W., 1994. Neuron 12, 271–280.
Agarwal, R., Barrelet, C.J., Lieber, C.M., 2005. Nano Letters 5, 917–920.
Audenaert, R., Heremans, L., Heremans, K., Engelborghs, Y., 1889. Biochimica et
Biophysica Acta—Protein Structure and Molecular Enzymology 996, 110–115.
Barabási, A.L., Albert, R., 1999. Science 286, 509–512.
Butts, C.T., 2009. Science 325, 414–416.
Braun, H.A., Voigt, K., Huber, M.T., 2003. Biosystems 71, 39–50.
Bandyopadhyay, A., Miki, K., Wakayama, Y., 2006. Applied Physics Letters 89,
243503–243506.
Bandyopadhyay, A., Sahu, S., Fujita, D., Wakayama, Y., 2010. Physical Chemistry
Chemical Physics 12, 2198–2208.
Bandyopadhyay, A., Wakayama, Y., 2007. Applied Physics Letters 90, 023512–023514.
Borisy, G., Marcum, J., Olmsted, J., Murphy, D., Johnson, K., 1975. Annals of the
New York Academy of Sciences 253, 107–132.
Bandyopadhyay, A., Acharya, S., 2008. Proceedings of the National Academy of
Sciences of the United States of America 105 (2008), 3668–3672.
Carlier, M., Melki, R., Pantaloni, D., Hill, T., Chen, Y., 1987. Proceedings of the
National Academy of Sciences of the United States of America 84, 5257–5261.
Damjanovic, D., 2006. The Science of Hysteresis, vol. 3, pp. 337–465.
Dekker, C., Ratner, M.A., 2001. Physics World 14, 29–33.
Dierolf, V., O’Donnell, K., 2010. Rare earth doped III-nitrides for optoelectronic
and spintronic applicationsTopics in Applied Physics, vol. 124. Springer,
The Netherlands, pp. 221–268.
Dierolf, V., Koerdt, M., 2000. Physical Review B 61, 8043–8052.
Egard, M., Johansson, S., Johansson, A.C., Persson, K.M., Dey, A., Borg, B., Thelander,
C., Wernersson, L.E., Lind, E., 2010. Nano Letters 10, 809–812.
Fygenson, D.K., Braun, E., Libchaber, A., 1994. Physical Review E 50, 1579–1588.
Fink, H.W., Schönenberger, C., 1999. Nature 398, 407–410.
Grigor’kin, A., Dunaevskiĭ, S., 2007. Physics of the Solid State 49, 585–590.
Gerhart, J., Kirschner, M., Moderbacher, E.S., 1997. Cells, Embryos, and Evolution.
Blackwell Science, Malden, MA.
He, R., Feng, X., Roukes, M., Yang, P., 2008. Nano Letters 8, 1756–1761.
Jelínek, F., Pokorný, J., 2001. Electromagnetic Biology and Medicine 20, 75–80.
Jelı́nek, F., Pokorný, J., Šaroch, J., Trkal, V., Hašek, J., Palán, B., 1999. Bioelectrochem-
istry and Bioenergetics 48, 261–266.
Moriya, S., Tanaka, K., Ohkuma, M., Sugano, S., Kudo, T., 2001. Journal of Molecular
Evolution 52, 6–16.
Mange, D., Tomassini, M., 1998. Bio-inspired Computing Machines: Towards Novel
Computational Architectures. Presses polytechniques et universitaires
romandes, Lausanne.
Mesquita, M.V., Vasconcellos, A.R., Luzzi, R., 1993. Physical Review E 48, 4049–4059.
Moskalenko, S., Miglei, M., Khadshi, P., Pokatilov, E., Kiselyova, E., 1980. Physics
Letters A 76, 197–200.
Michalski, P., Mele, E.J., 2008. Physical Review B 77, 085429.
Makarovski, A., Zhukov, A., Liu, J., Finkelstein, G., 2007. Physical Review B 76,
R161405.
Minoura, I., Muto, E., 2006. Biophysics Journal 90, 3739–3748.
Nielsen, M., Gadagkar, S., Gutzwiller, L., 2010. BMC Evolutionary Biology 10, 113.
Nielsen, M.G., Caserta, J.M., Kidd, S.J., Phillips, C.M., 2006. Evolution and Develop-
ment 8, 23–29.
Oulton, R.F., Sorger, V.J., Genov, D., Pile, D., Zhang, X., 2008. Nature Photonics 2,
496–500.
Prodan, E., Prodan, C., 2009. Physical Review Letters 103, 248101.
Pizzi, R., Strini, G., Fiorentini, S., Pappalardo, V., Pregnolato M., 2011. Focus on
Artificial Neural Networks cap. In: Flores John, A. (Ed.), ISBN: 978-1-61324-285-
8. Nova Science Publisher Inc., vol. 9, pp. 191–207.
Priel, A., Ramos, A.J., Tuszynski, J.A., Cantiello, H.F., 2006. Biophysics Journal 90,
4639–4643.
Park, H., 2011. Contact Limiting Effects of Nanowire Devices, Ph.D. Thesis, Rhode
Island, Brown University.
Roberts, E., Magis, A., Ortiz, J.O., Baumeister, W., Luthey-Schulten, Z., 2011. PLOS
Computational Biology 7, e1002010.
S. Sahu et al. / Biosensors and Bioelectronics 47 (2013) 141–148 147
8. Redeker, V., Frankfurter, A., Parker, S.K., Rossier, J., DetrichIII, 2004. Biochemistry
43, 12265–12274.
Rakitin, A., Aich, P., Papadopoulos, C., Kobzar, Y., Vedeneev, A., Lee, J., Xu, J., 2001.
Physical Review Letters 86, 3670–3673.
Rotaru, V., Lajoie-Mazenc, I., Tollon, Y., Raynaud-Messina, B., Jean, C., Détraves, C.,
Julian, M., Moisand, A., Wright, M., 1999. Biology of the Cell 91, 393–406.
Storm, A., Van Noort, J., De Vries, S., Dekker, C., 2001. Applied Physics Letters 79,
3881–3883.
Shibata, T., Ueda, M., 2008. Biosystems 93, 126–132.
Szendro, P., Vincze, G., Szasz, A., 2001a. European Biophysics Journal 30, 227–231.
Szendro, P., Vincze, G., Szasz, A., 2001b. Electromagnetic Biology and Medicine 20,
215–229.
Song, C., Havlin, S., Makse, H.A., 2005. Nature 433, 392–395.
Strogatz, S.H., 2001. Nature 410, 268–276.
Sipper, M., 2002. Machine Nature: The Coming Age of Bio-inspired Computing.
McGraw-Hill, New York.
Sahu, S., Ghosh, S., Fujita, D., Bandyopadhyay, A., 2011. Journal of Computational
and Theoretical Nanoscience 8, 509–515.
Sanabria, H., 2005. Impedance Spectroscopy of Polyelectrolytes: Case Study of
Alpha-Beta Tubulin Suspensions, Ph.D. Thesis, University of Houston.
Smith, D., Hörber, J., Binnig, G., Nejoh, H., 1990. Nature 344, 641–644.
Samitsu, S., Shimomura, T., Ito, K., Fujimori, M., Heike, S., Hashizume, T., 2005.
Applied Physics Letters 86, 233103.
Tran, P., Walker, R., Salmon, E., 1997. Journal of Cell Biology 138, 105–117.
Teuscher, C., Mange, D., Stauffer, A., Tempesti, G., 2003. Biosystems 68, 235–244.
van Vugt, L.K., Zhang, B., Piccione, B., Spector, A.A., Agarwal, R., 2009. Nano Letters
9, 1684–1688.
Walton, A., Allen, C., Critchley, K., Górzny, M.Ł., Brydson, R., Hickey, B., Evans, S.,
2007. Nanotechnology 18, 065204.
Zhang, D., Gao, Z., 2012. Robotics and Computer-Integrated Manufacturing 28,
484–492.
Zhang, Y., Austin, R., Kraeft, J., Cox, E., Ong, N., 2002. Physical Review Letters 89,
198102.
Zheng, G., Lu, W., Jin, S., Lieber, C.M., 2004. Advanced Materials 16, 1890–1893.
S. Sahu et al. / Biosensors and Bioelectronics 47 (2013) 141–148148