SlideShare a Scribd company logo
1 of 11
Download to read offline
Global
Markets
Research
Elara Securities (India) Private Limited
Karan Taurani•karan.taurani@elaracapital.com• +91 22 6164 8513
Rounak Ray • rounak.ray@elaracapital.com • +91 22 4204 8684
Consumption to wax with Cricket World Cup
Favourable timings to boost viewership
India is hosting the Cricket World Cup (CWC) after 12 years (through 5
October-19 November 2023). For the first time, India will host all the
matches solo – Earlier, other Asian nations have co-hosted with India.
Favorable timings (matches will begin at 10:30 IST/14:00 IST) may boost
consumption of the property on TV/digital platforms.
Expect the CWC to generate ~INR 20-22bn in ad revenue on TV/digital
platforms combined. And digital revenues for CWC may prop
significantly this year as: 1) timings are favorable (viewers may watch
the first half of the match on OTT) and 2) CWC will be available free for
all mobile users on Disney+ Hotstar app. In terms of TV advertising,
expect a 6% CAGR versus the prior edition of the CWC in CY19. For the
digital medium, CAGR may touch 21% versus 2019 levels.
Consumer discretionary – Win-win proposition
The CWC may positively impact online food ordering for aggregators
such as Zomato/Swiggy. Through 2019 and prior world cups, JUBI
alone saw a boost in SSSG (higher SSSG growth of ~3% in the CWC
quarter) due to best experience offered in food delivery. But this time,
expect other categories – burgers, fried chicken and biryani – to
perform well, led by higher penetration of online aggregators, and likely
replication of JUBI’s delivery experience. Also, pizza may see significant
demand (preferred by large groups). But the segment is highly
fragmented with many competitors in the fray, which may dampen
prospects of a big delta/advantage for JUBI in this CWC. QSR/food tech
companies may see a positive impact of 6-8% (2%-3% higher quarterly
growth in Q3FY24) from higher orders during the CWC (six weeks).
The alcobev industry may see a boost in consumption as beer volumes
have an on-premise share of ~30% – Premium beer such as Corona,
Heineken, Bira and Budweiser could see strong growth. Within spirits,
scotch whiskey and upper prestige could see a boost in volume growth
due to higher on premise share (~40%). We estimate positive impact of
4%/6% (1.5%-2% higher quarterly growth in Q3FY24) for overall
whiskey/beer volumes in October-November due to the CWC.
Bars/pubs may see better occupancy, which may positively impact
alcobev volume growth in Q3FY24.
TV advertising (non-cricket) may be strained
In the past year, many consumer tech companies (edtech, fintech,
foodtech and e-commerce) have shifted focus to profitability, thus
curtailing ad spends. This has hurt the market as regards ad spend
growth on TV/digital. These verticals have not yet made a come-back in
terms of larger ad budgets, and the market is depending on larger,
traditional verticals such as FMCG, Auto and Telecom. Expect TV ad
spends for GEC-based players – Zee Entertainment Enterprises (Z IN)
and Sun TV (SUNTV IN) – to see a mild strain in Q3FY24, due to spends
being diverted to cricket. But the positive impact from the festival season
may largely offset this hit. The mix of advertisers has also changed –
from new-age plays to traditional verticals – which has hit the overall
pricing (sports and GEC). ZOMATO, UBBL, DEVYANI, WLDL and UNSP
seem to be the key beneficiaries from the overlap between the WC and
the festive season which will boost overall consumption.
India | Consumer Discretionary 18 September 2023
Sector Update/Target price change
Consumer Discretionary
CWC digital adex – Expect 21% CAGR in
CY19-23E
Source: Company, Elara Securities Estimate
India: Total adex may grow 9% in CY23E
Source: Pitch Madison, Elara Securities Estimate
JUBI’s SSSG during CWC quarter in
2015/2019 higher than annual SSSGs
CWC
edition
Time zone
favorable to
Indians?
JUBI
SSSG YoY during
CWC quarter-
Annual
SSSG YoY
2015 No 6.6 (4.5)
2019 Yes 4.5 1.7
CWC
edition
Time zone
favorable to
Indians?
UBBL
Volume growth
YoY during
CWC quarter-
Annual
volume
growth YoY
2015 No 2 9
2019 Yes 5.6 (4.2)
CWC
edition
Time zone
favorable to
Indians?
UNSP
P&A Volume
growth YoY
during CWC
quarter
Annual P&A
volume
growth YoY
2015 No 7.4 7.8
2019 Yes 10.6 10.2
Source: Company, Elara Securities Research
9
4.5
11.5
9.5
0
2
4
6
8
10
12
14
TV Digital
(INR
bn)
ICC World Cup ad spends split between TV
and digital
CY19 CY23E
CAGR of 6%
CAGR of 21%
7.4
14.6
11.0
(19.9)
37.1
21.0
4.0
14.016.1
9.0
(30)
(20)
(10)
0
10
20
30
40
CY17
CY18
CY19
CY20
CY21
CY22
H1CY23
H2CY23
CY23
(Madison
Estimate)
CY23E
(Revised)
(%)
India: Total adex growth (YoY)
Consumer Discretionary
2 Elara Securities (India) Private Limited
Peer valuations
Company Ticker Rating Mcap CMP Target Upside P/E (x) EV/EBITDA (x) ROE (x)
(INR bn) (INR) (INR) (%) FY24E FY25E FY26E FY24E FY25E FY26E FY24E FY25E FY26E
Zomato Zomato IN Buy 886 103 130 26 (1,637.8) 148.1 66.7 (274.4) 126.1 48.6 (0.3) 3.0 6.3
United Spirits UNSP IN Reduce 763 1,049 1,060 1 64.5 55.1 47.4 40.9 35.7 31.3 16.5 16.2 15.8
United Breweries UBBL IN Reduce 426 1,611 1,510 (6) 82.0 54.7 45.9 49.3 34.6 29.2 11.9 15.8 16.3
Jubilant FoodWorks JUBI IN Accumulate 352 533 560 5 78.9 62.0 52.8 28.3 24.1 21.2 18.9 19.9 19.3
Westlife Foodworld WESTLIFE IN Reduce 153 983 940 (4) 106.0 82.2 65.5 35.4 29.4 25.3 23.6 24.8 24.4
Note: We roll over to Dec-24E TP of INR 560 and INR 940 for JUBI (on 57x one-year forward P/E) and WLDL (on 31x one-year forward EV/EBITDA, pre IndAS)
respectively; pricing as on 15 September 2023; rating as per last published report; Source: Company, Elara Securities Estimate
Consumer Discretionary
Consumer
Discretionary
3
Elara Securities (India) Private Limited
Cricket World Cup adex
CWC 2023E to yield ~20% more TV adex than 2019
The upcoming CWC may generate at least 20% more in
TV adex than it did in 2019. Sports advertising revenue
has witnessed a CAGR of ~20% in CY15-22. And for 2023
CWC, advertising yields are at a mild premium vs 2019
pricing levels, indicating that the same pricing structure is
being maintained. Most International Cricket Council (ICC)
event sponsors are Indian brands and have committed
substantial investments.
Digital adex: CWC 2023E to grow at least 70% versus
CWC 2019
In contrast, digital adex for 2023E CWC may likely grow at
least 70% more than the prior editions led by: 1) favorable
timings (viewers may watch the first half of the match on
OTT), 2) CWC will be available free for all mobile users on
Disney+ Hotstar app and 3) better growth in digital
advertising versus traditional media. CWC 2023 may see a
similar growth as in digital ad spends during the Indian
Premier League (IPL) in 2023. While the absolute value of
digital advertising may not be as high as TV advertising,
the growth rate may be higher. Cricket has gained
popularity on digital platforms, and lower advertising
prices on digital channels have allowed many brands to
participate. In 2019 CWC, digital advertising-led revenue
ranged within INR 4,000-INR 5,000mn. Asia Cup may
generate TV adex within INR 3,000-INR 4,000mn.
Exhibit 1: CWC digital adex to see 21% CAGR in CY19-23E
Source: Company, Elara Securities Estimate
Consumption boost during CWC
Sales/volume growth higher in CWC quarter
Consumer Discretionary, especially Food & Beverages and
Alcobev, has seen a correlation with the past two CWCs
(in 2015/2019). Per our findings, SSSG/volume growth in
the CWC quarter surpassed the annual SSSG/volume
growth in the past two CWCs. JUBI’s annual SSSG dipped
4.5% YoY in FY15 whereas in the CWC quarter, the SSSG
rose 6.6% YoY. In 2019 CWC quarter too, JUBI’s SSSG was
much higher at 4.5% YoY versus an annual average SSSG
of 1.7% YoY in FY20. For Alcobev, the delta was visible (on
high ‘on-premise’ growth) more for beer – UBBL’s annual
volume pared 4.2% YoY in FY20 but volume grew 5.6%
YoY in CWC quarter.
9
4.5
11.5
9.5
0
2
4
6
8
10
12
14
TV Digital
(INR
bn)
ICC World Cup ad spends split between TV and
digital
CY19 CY23E
CAGR of 6%
CAGR of 21%
Exhibit 2: JUBI – SSSG during CWC quarter in 2015/2019 higher than respective annual SSSGs
CWC edition Event date Location
Time
zone
favorable
to
Indians?
JUBI UBBL UNSP
SSSG
YoY
during
CWC
quarter-
Annual
SSSG
YoY
Volume
growth
YoY
during
CWC
quarter-
Annual
volume
growth
YoY
P&A
Volume
growth
YoY
during
CWC
quarter
Annual
P&A
volume
growth
YoY
2011 Feb 2011-April 2011 India, Sri Lanka and Bangladesh Yes 33.2 37.4 - - - -
2015 Feb 2015-March 2015 Australia & New Zealand No 6.6 (4.5) 2 9 7.4 7.8
2019 May 2019-July 2019 England Yes 4.5 1.7 5.6 (4.2) 10.6 10.2
Source: Company, Elara Securities Research
Consumer Discretionary
4 Elara Securities (India) Private Limited
Adex in India
Expect ~8-9% growth in CY23E including CWC
As regards the overall advertising space, H1CY23
witnessed a modest growth of 2.5-3.5% YoY. Ad revenue
for Zee/Sun TV declined in H1, while Viacom saw a sharp
growth even after excluding the impact of the IPL.
Overall, traditional TV broadcasters faced challenges and
TV advertising demand has been relatively soft. Within the
digital advertising landscape, investments have become
fragmented, given substantial allocations to performance
marketing, retail media and e-commerce, among others.
Google faced increased competition from other forms of
digital advertising. Going ahead over the medium term,
normalized growth rate in digital advertising may be ~15-
20%, while TV may see more modest growth of 2-4%. The
overall growth rate for the advertising industry in CY23E
may be ~8-9% including positive impact of the World Cup
(~2%). Fintech and service tech sectors may also see a
revival.
Exhibit 3: India – Total adex may grow 9% in CY23E
Source: Pitch Madison, Elara Securities Estimate
Exhibit 3: India – TV adex may grow 6% (including
CWC) in CY23E
Source: Pitch Madison, Elara Securities Estimate
Exhibit 3: India – Digital adex may grow 17.5% in CY23E
Source: Pitch Madison, Elara Securities Estimate
Exhibit 4: Digital adex contribution up to 38% in CY22
from 18% in CY17
Source: Pitch Madison, Elara Securities Research
7.4
14.6
11.0
(19.9)
37.1
21.0
4.0
14.0 16.1
9.0
(30)
(20)
(10)
0
10
20
30
40
CY17
CY18
CY19
CY20
CY21
CY22
H1CY23
H2CY23
CY23
(Madison
Estimate)
CY23E
(Revised)
(%)
India: Total adex growth (YoY)
4.3
19.2
7.9
(11.0)
25.1
8.9 9.3
6.0
(20)
(10)
0
10
20
30
CY17
CY18
CY19
CY20
CY21
CY22
CY23
(Madison
Estimate)
CY23E
(Revised)
(%)
India: TV adex growth (YoY)
27.2 25.8
32.1
9.7
49.9
35.3
25.0
17.5
0
10
20
30
40
50
60
CY17
CY18
CY19
CY20
CY21
CY22
CY23
(Madison
Estimate)
CY23E
(Revised)
(%)
India: Digtal adex growth (YoY)
37 38 37 42 38 34
35 32 30 22 22
21
18 19 23 31 34 38
4 4 3
2 2 2
6 6 5 2 3 4
1 1 2 0 0 1
0%
20%
40%
60%
80%
100%
CY17 CY18 CY19 CY20 CY21 CY22
Vertical-wise contribution to overall ad spend in India
TV Print Digital Radio OOH Cinema (Only onscreen Ad)
Consumer Discretionary
Consumer
Discretionary
5
Elara Securities (India) Private Limited
Rise in FMCG ad spend boosting overall industry adex
FMCG seems to be an exception to the trend of declining
advertising expenditures. Through H1FY23, advertising
and promotion (A&P) expenses of publicly-listed FMCG
companies have, on an average, increased 11% YoY.
Profitability in the FMCG sector has primarily been led by
price hikes and a stabilization of inflation.
Thus, FMCG companies have allocated a significant
portion of profits in adex to boost volumes. This rise in
advertising spending by FMCG companies has provided a
welcome boost to the advertising industry. This trend is
anticipated to persist in the next six months, with FMCG
advertisers being the primary consumers of the larger
advertising volumes available in the market.
Exhibit 4: FMCG companies have increased their A&P
spends in Q1FY24
Source: Company, Elara Securities Research
Decrease in viewership time hitting show ratings
In the general entertainment channel (GEC) space, the
ratings of impact shows have consistently declined,
primarily because the amount of time viewers spend on
TV has dropped. CY23 YTD CMGR (compounded monthly
growth rate) of GEC (Urban + Rural) impressions has been
flat. This has created a challenging cost-versus-return
equation, as the investment required to produce these
shows is significantly higher than the potential returns.
However, some shows such as Kaun Banega Crorepati
(KBC) have been able to secure advertising sales worth
>INR 4,000mn, this season. Shows such as the Indian Idol
and KBC may continue to perform well, but other
programs may face challenges due to low ratings.
Currently, the industry is focused on driving volume
growth. And the yield growth in non-fiction
programming may drop 8-9% compared with pre-COVID
level. Marquee properties in the non-fiction genre are also
experiencing lower yields versus pre-COVID period.
In certain genres such as GECs, the supply of advertising
gross rating points (GRP) has decreased as the time spent
by the viewers on TV has dropped consistently. Despite
the fact that there are currently 210mn households with
TV connections, the key factor is real viewership versus TV
availability at home. While the number of TV connections
has increased, the viewership time spent on TV has pared.
Exhibit 4: CY23 YTD CMGR of GEC (Urban + Rural)
impressions has been flat
Source: BARC, Elara Securities Research
FMCG bridging the void created by start-ups
The advertising GRP available in the market is not
distributed evenly. Some shows experience exceptionally
high demand, while others face very low demand.
Consequently, for specific shows, advertising yields may
be on the rise, but overall, the yields across the industry
are decreasing. The drop in the yields in fictional
programming is lower, and yields are actually increasing
for the top-performing fictional shows. Overall, the yields
are down by ~2-3% compared with pre-COVID levels.
Interestingly, the void left by large venture capital-funded
advertisers is being bridged by FMCG companies. The
advertising inventory is being filled, but it is not at the
same value as before, reflecting the evolving dynamics of
the advertising market. The FMCG sector is expected to
continue investing in GECs. Thus, a crucial monitorable is
how cricket events impact non-fiction programming (KBC
and Indian Idol).
Viacom may gain market share from existing plays in
regional markets
Television penetration varies significantly across different
regions of India. In states such as Tamil Nadu (TN) and
Andhra Pradesh, TV penetration is quite high, reaching
~97-98%. In contrast, TV penetration is notably lower in
regions such as Jharkhand. Pricing in the southern
markets has seen a modest single-digit inflation, and
demand is strong in such areas.
9.5
7.8
5.6
17.6
9.9
8.6
6.5
18.4
0
4
8
12
16
20
Hindustan
Unilever
Marico Dabur Emami
(%)
A&P spends as % of revenue
Q1FY23 Q1FY24
-23
-13
-10
-9
-6
-3
-3
-4
2
-2 10
6
2
5
3
(30)
(25)
(20)
(15)
(10)
(5)
0
5
10
15
0
5,000
10,000
15,000
20,000
25,000
30,000
35,000
40,000
45,000
50,000
June-22
July-22
August-22
September-22
October-22
November-22
December-22
January-23
February-23
March-23
April-23
May-23
June-23
July-23
August-23
(%)
(AMA
'000)
GEC (Urban + Rural) impressions
Average AMA' 000 Average AMA YoY growth
Consumer Discretionary
6 Elara Securities (India) Private Limited
Marathi and Bangla markets are also considered
interesting and have unique dynamics. The Bangla
market, in particular, has become a duopoly, with Star and
Zee dominating. Other channels in this region have
struggled, and the aggregate GRPs of all the other
channels have decreased.
West Bengal is a crucial market for many mass-market
advertisers, which often have no alternatives but to work
with these two dominant players. A similar situation exists
in the Marathi market. In the southern markets, unlike in
the Hindi-speaking markets (HSM), Star India has a
significant impact on non-fiction content. Disney+ has
shown consistent viewership and ratings. Zee has a
strong presence in South India and West Bengal. And Sun
TV is powerful in Tamil Nadu but not as much in Andhra
Pradesh and Karnataka.
Viacom operates channels in regional languages such as
Kannada, Tamil, and Bangla. The addition of Kevin Vaz
from Star India to Viacom is expected to bring new
strategies and focus to these regional markets, potentially
allowing Viacom to gain market share from existing
players.
Yields in FTA channels lower but demand robust
The demand for free-to-air (FTA) channels continues to be
robust in the television advertising landscape. But it is
important to note that yields in FTA channels tend to be
lower, and there seems to be a glass ceiling in terms of
improving these yields.
Most FTA brands are highly mass-market in nature, and
their ROI expectations are quite stringent. The FTA market
is primarily dominated by Hindi-language channels and
represents ~INR 10,000mn in terms of market size. Within
the overall TV advertising expenditure, ~65% is allocated
to Hindi-language channels, while regional channels
account for ~30% of the TV ad spend. Given the mass-
market nature and cost-consciousness of advertisers in the
FTA segment, there are limitations on the quantum of rise
in advertising yields, in this space.
Exhibit 5: FTA adex at INR 10bn in CY22
Source: Pitch Madison, Elara Securities Research
Gaming platforms – Approach cautious
Gaming platforms are investing in the Asia Cup, although
not to the same extent as before, primarily due to
concerns around the impact of the Goods and Services
Tax (GST). Gaming platforms are adopting a wait-and-
watch approach and are expected to have a clearer
picture by end-November. The e-commerce advertising
market is on track to form a substantial portion, ~12-13%,
of the digital adex.
Sony Liv focusing on impact shows; Zee5 led by catch-
up TV content
Sony Liv has adopted an impact sales strategy, focusing
on large-scale impact shows and effectively monetizing
them. The platform is actively attracting audiences to
Connected Television (CTV), and there has been
significant improvement in CTV viewership. Sony Liv
targets premium audiences on CTVs.
In OTT (over-the-top), there is a trend of platforms
opening their paywalls, and offering content on a hybrid
model. This means that there is a substantial amount of
inventory available on OTT platforms for monetization.
Additionally, premium OTT content that is not available
on traditional TV is also being offered for monetization.
Zee5’s strategy is led by catch-up TV content, while Sony
Liv emphasizes on original content.
FTA
Adex, 10
Non FTA
Adex,
296
FTA and non FTA adex as of CY22 (INR bn)
Consumer Discretionary
Consumer
Discretionary
7
Elara Securities (India) Private Limited
Coverage History
Date Rating Target Price Closing Price
1 12-Sept-2023 Buy INR 130 INR 99
Date Rating Target Price Closing Price
9 31-Jan-2022 Accumulate INR 1,750 INR 1,619
10 27-Apr-2022 Accumulate INR 1,850 INR 1,506
11 21-Oct-2022 Reduce INR 1,700 INR 1,642
12 10-Feb-2023 Reduce INR 1,500 INR 1,481
13 5-May-2023 Reduce INR 1,400 INR 1,399
14 31-Jul-2023 Reduce INR 1,510 INR 1,540
Date Rating Target Price Closing Price
8 27-Jan-2022 Buy INR 1,050 INR 842
9 27-Jul-2022 Buy INR 1,000 INR 793
10 25-Jan-2023 Accumulate INR 920 INR 769
11 19-May-2023 Accumulate INR 900 INR 817
12 21-Jul-2023 Reduce INR 1,060 INR 1,039
1
0
20
40
60
80
100
120
Sep-22
Oct-22
Oct-22
Oct-22
Nov-22
Nov-22
Dec-22
Dec-22
Jan-23
Jan-23
Feb-23
Feb-23
Mar-23
Mar-23
Apr-23
Apr-23
May-23
May-23
May-23
Jun-23
Jun-23
Jul-23
Jul-23
Aug-23
Aug-23
Sep-23
Zomato
Not Covered Covered
2
3
4
5
6
7
8 9
10
11
12
13
14
700
900
1,100
1,300
1,500
1,700
1,900
Jul-20
Sep-20
Nov-20
Jan-21
Mar-21
May-21
Jul-21
Sep-21
Nov-21
Jan-22
Mar-22
May-22
Jul-22
Sep-22
Nov-22
Jan-23
Mar-23
May-23
Jul-23
Sep-23
United Breweries
Not Covered Covered
2
3
4 5
6
7
8
9
10
11
12
350
450
550
650
750
850
950
1,050
1,150
Jul-20
Oct-20
Jan-21
Apr-21
Jul-21
Oct-21
Jan-22
Apr-22
Jul-22
Oct-22
Jan-23
Apr-23
Jul-23
United Spirits
Not Covered Covered
Consumer Discretionary
8 Elara Securities (India) Private Limited
Date Rating Target Price Closing Price
7 2-Feb-2022 Buy INR 4,110 INR 3,302
8 3-Mar-2022 Buy INR 4,000 INR 2,800
19-Apr-2022 Buy INR 800* INR 560*
9 28-Jul-2022 Buy INR 840 INR 565
10 1-Feb-2023 Buy INR 630 INR 456
11 17-May-2023 Buy INR 600 INR 481
12 25-Jul-2023 Accumulate INR 510 INR 477
13 15-Sep-2023 Accumulate INR 560 INR 533
*Stock Split From INR.10/- to INR.2/-
Date Rating Target Price Closing Price
6 3-Feb-2022 Accumulate INR 570 INR 497
7 3-Mar-2022 Accumulate INR 540 INR 453
8 29-Jul-2022 Accumulate INR 650 INR 584
9 9-Nov-2022 Accumulate INR 885 INR 781
10 1-Dec-2022 Accumulate INR 850 INR 719
11 9-May-2023 Accumulate INR 815 INR 768
12 27-Jul-2023 Reduce INR 880 INR 898
13 15-Sep-2023 Reduce INR 940 INR 983
1
2
3
4 5
6
7
8
9
10 11 12
13
0
200
400
600
800
1,000
Oct-19
Dec-19
Feb-20
Apr-20
Jun-20
Aug-20
Oct-20
Dec-20
Feb-21
Apr-21
Jun-21
Aug-21
Oct-21
Dec-21
Feb-22
Apr-22
Jun-22
Aug-22
Oct-22
Dec-22
Feb-23
Apr-23
Jun-23
Aug-23
Jubilant FoodWorks
Not Covered Covered
1
2 3
4
5
6
7
8
9
10
11
12
13
0
200
400
600
800
1,000
1,200
Oct-19
Dec-19
Feb-20
Apr-20
Jun-20
Aug-20
Oct-20
Dec-20
Feb-21
Apr-21
Jun-21
Aug-21
Oct-21
Dec-21
Feb-22
Apr-22
Jun-22
Aug-22
Oct-22
Dec-22
Feb-23
Apr-23
Jun-23
Aug-23
Westlife Foodworld
Not Covered Covered
Elara Securities (India) Private Limited
Global
Markets
Research
9
9
Disclosures & Confidentiality for non U.S. Investors
The Note is based on our estimates and is being provided to you (herein referred to as the “Recipient”) only for information purposes. The sole purpose of this Note
is to provide preliminary information on the business activities of the company and the projected financial statements in order to assist the recipient in understanding
/ evaluating the Proposal. Nothing in this document should be construed as an advice to buy or sell or solicitation to buy or sell the securities of companies referred
to in this document. Each recipient of this document should make such investigations as it deems necessary to arrive at an independent evaluation of an investment
in the securities of companies referred to in this document (including the merits and risks involved) and should consult its own advisors to determine the merits and
risks of such an investment. Nevertheless, Elara Securities (India) Private Limited or any of its affiliates is committed to provide independent and transparent
recommendation to its client and would be happy to provide any information in response to specific client queries. Elara Securities (India) Private Limited or any of
its affiliates have not independently verified all the information given in this Note and expressly disclaim all liability for any errors and/or omissions, representations
or warranties, expressed or implied as contained in this Note. The user assumes the entire risk of any use made of this information. Elara Securities (India) Private
Limited or any of its affiliates, their directors and the employees may from time to time, effect or have effected an own account transaction in or deal as principal or
agent in or for the securities mentioned in this document. They may perform or seek to perform investment banking or other services for or solicit investment banking
or other business from any company referred to in this Note. Each of these entities functions as a separate, distinct and independent of each other. This Note is
strictly confidential and is being furnished to you solely for your information. This Note should not be reproduced or redistributed or passed on directly or indirectly
in any form to any other person or published, copied, in whole or in part, for any purpose. This Note is not directed or intended for distribution to, or use by, any
person or entity who is a citizen or resident of or located in any locality, state, country or other jurisdiction, where such distribution, publication, availability or use
would be contrary to law, regulation or which would subject Elara Securities (India) Private Limited or any of its affiliates to any registration or licensing requirements
within such jurisdiction. The distribution of this document in certain jurisdictions may be restricted by law, and persons in whose possession this document comes,
should inform themselves about and observe, any such restrictions. Upon request, the Recipient will promptly return all material received from the company and/or
the Advisors without retaining any copies thereof. The Information given in this document is as of the date of this report and there can be no assurance that future
results or events will be consistent with this information. This Information is subject to change without any prior notice. Elara Securities (India) Private Limited or any
of its affiliates reserves the right to make modifications and alterations to this statement as may be required from time to time. However, Elara Securities (India) Private
Limited is under no obligation to update or keep the information current. Neither Elara Securities (India) Private Limited nor any of its affiliates, group companies,
directors, employees, agents or representatives shall be liable for any damages whether direct, indirect, special or consequential including lost revenue or lost profits
that may arise from or in connection with the use of the information. This Note should not be deemed an indication of the state of affairs of the company nor shall
it constitute an indication that there has been no change in the business or state of affairs of the company since the date of publication of this Note. The disclosures
of interest statements incorporated in this document are provided solely to enhance the transparency and should not be treated as endorsement of the views
expressed in the report. Elara Securities (India) Private Limited generally prohibits its analysts, persons reporting to analysts and their family members from
maintaining a financial interest in the securities or derivatives of any companies that the analysts cover. The analyst for this report certifies that all of the views
expressed in this report accurately reflect his or her personal views about the subject company or companies and its or their securities, and no part of his or her
compensation was, is or will be, directly or indirectly related to specific recommendations or views expressed in this report.
Any clarifications / queries on the proposal as well as any future communication regarding the proposal should be addressed to Elara Securities (India) Private
Limited. It is important to note that any dispute with respect to this research report, would not have access to stock exchange investor redressal forum or arbitration
mechanism.
Elara Securities (India) Private Limited was incorporated in July 2007 as a subsidiary of Elara Capital (India) Private Limited.
Elara Securities (India) Private Limited is a SEBI registered Stock Broker in the Capital Market and Futures & Options Segments of National Stock Exchange of India
Limited [NSE], in the Capital Market Segment of BSE Limited [BSE] and a Depository Participant registered with Central Depository Services (India) Limited [CDSL].
Elara Securities (India) Private Limited’s business, amongst other things, is to undertake all associated activities relating to its broking business.
The activities of Elara Securities (India) Private Limited were neither suspended nor has it defaulted with any stock exchange authority with whom it is registered in
last five years. However, during the routine course of inspection and based on observations, the exchanges have issued advise letters or levied minor penalties on
Elara Securities (India) Private Limited for minor operational deviations in certain cases. Elara Securities (India) Private Limited has not been debarred from doing
business by any Stock Exchange / SEBI or any other authorities; nor has the certificate of registration been cancelled by SEBI at any point of time.
Elara Securities (India) Private Limited offers research services primarily to institutional investors and their employees, directors, fund managers, advisors who are
registered or proposed to be registered.
Details of Associates of Elara Securities (India) Private Limited are available on group company website www.elaracapital.com
Elara Securities (India) Private Limited is maintaining arms-length relationship with its associate entities.
Research Analyst or his/her relative(s) may have financial interest in the subject company. Elara Securities (India) Private Limited does not have any financial interest
in the subject company, whereas its associate entities may have financial interest. Research Analyst or his/her relative does not have actual/beneficial ownership of
1% or more securities of the subject company at the end of the month immediately preceding the date of publication of Research Report. Elara Securities (India)
Private Limited does not have actual/beneficial ownership of 1% or more securities of the subject company at the end of the month immediately preceding the date
of publication of Research Report. Associate entities of Elara Securities (India) Private Limited may have actual/beneficial ownership of 1% or more securities of the
subject company at the end of the month immediately preceding the date of publication of Research Report. Research Analyst or his/her relative or Elara Securities
(India) Private Limited or its associate entities does not have any other material conflict of interest at the time of publication of the Research Report.
Research Analyst or his/her relative(s) has not served as an officer, director or employee of the subject company.
Research analyst or Elara Securities (India) Private Limited have not received any compensation from the subject company in the past twelve months. Associate
entities of Elara Securities (India) Private Limited may have received compensation from the subject company in the past twelve months. Research analyst or Elara
Securities (India) Private Limited or its associate entities have not managed or co-managed public offering of securities for the subject company in the past twelve
months. Research analyst or Elara Securities (India) Private Limited or its associates have not received any compensation for investment banking or merchant banking
or brokerage services from the subject company in the past twelve months. Research analyst or Elara Securities (India) Private Limited or its associate entities may
have received any compensation for products or services other than investment banking or merchant banking or brokerage services from the subject company or
third party in connection with the Research Report in the past twelve months.
Disclaimer & Standard warning
Registration granted by SEBI and certification from NISM in no way guarantee performance of the intermediary or
provide any assurance of returns to investors.
Investment in securities market are subject to market risks. Read all the related documents carefully before investing.
Elara Securities (India) Private Limited
10
Disclaimer for non U.S. Investors
The information contained in this note is of a general nature and is not intended to address the circumstances of any particular individual or entity. Although we
endeavor to provide accurate and timely information, there can be no guarantee that such information is accurate as of the date it is received or that it will
continue to be accurate in the future. No one should act on such information without appropriate professional advice after a thorough examination of the
particular situation.
Disclaimer for U.S. Investors
This material is based upon information that we consider to be reliable, but Elara Capital Inc. does not warrant its completeness, accuracy or adequacy and it
should not be relied upon as such.
This material is not intended as an offer or solicitation for the purchase or sale of any security or other financial instrument. Securities, financial instruments or
strategies mentioned herein may not be suitable for all investors. Any opinions expressed herein are given in good faith, are subject to change without notice,
and are only correct as of the stated date of their issue. Prices, values or income from any securities or investments mentioned in this report may fall against the
interests of the investor and the investor may get back less than the amount invested. Where an investment is described as being likely to yield income, please
note that the amount of income that the investor will receive from such an investment may fluctuate. Where an investment or security is denominated in a
different currency to the investor’s currency of reference, changes in rates of exchange may have an adverse effect on the value, price or income of or from that
investment to the investor. The information contained in this report does not constitute advice on the tax consequences of making any particular investment
decision. This material does not take into account your particular investment objectives, financial situations or needs and is not intended as a recommendation of
particular securities, financial instruments or strategies to you. Before acting on any recommendation in this material, you should consider whether it is suitable
for your particular circumstances and, if necessary, seek professional advice.
Certain statements in this report, including any financial projections, may constitute “forward-looking statements.” These “forward-looking statements” are not
guarantees of future performance and are based on numerous current assumptions that are subject to significant uncertainties and contingencies. Actual future
performance could differ materially from these “forward-looking statements” and financial information.
Elara Securities (India) Private Limited
Global
Markets
Research
11
11
India
Elara Securities (India) Pvt. Ltd.
One International Center, Tower 3, 21st Floor,
Senapati Bapat Marg, Elphinstone Road (West)
Mumbai – 400 013, India
Tel : +91 22 6164 8500
Europe
Elara Capital Plc.
6th Floor, The Grove,
248A Marylebone Road,
London, NW1 6JZ, United Kingdom
Tel : +44 20 7486 9733
USA
Elara Securities Inc.
230 Park Avenue, Suite 2415, New
York, NY 10169, USA
Tel: +1 212 430 5870
Fax: +1 212 208 2501
Asia / Pacific
Elara Capital (Asia) Pte.Ltd.
One Marina Boulevard,
Level 20,
Singapore 018989
Tel : +65 6978 4047
Harendra Kumar Managing Director harendra.kumar@elaracapital.com +91 22 6164 8571
Sales
Ashok Agarwal India ashok.agarwal@elaracapital.com +91 22 6164 8558
Hitesh Danak India hitesh.danak@elaracapital.com +91 22 6164 8543
Karan Rathod India karan.rathod@elaracapital.com +91 22 6164 8570
Lekha Nahar India lekha.nahar@elaracapital.com +91 22 6164 8512
Prashin Lalvani India prashin.lalvani@elaracapital.com +91 22 6164 8544
Shraddha Shrikhande India shraddha.shrikhande@elaracapital.com +91 22 6164 8567
Sudhanshu Rajpal India sudhanshu.rajpal@elaracapital.com +91 22 6164 8508
Joshua Saldanha Asia joshua.saldanha@elaracapital.com +91 22 6164 8541
Anita Nazareth Corporate Access, Conference & Events anita.nazareth@elaracapital.com +91 22 6164 8520
Tina D’souza Corporate Access tina.dsouza@elaracapital.com +91 22 6164 8595
Quantitative, Alternatives, Sales Trading & Dealing
Sunil Jain Quantitative & Alternates sunil.jain@elaracapital.com +91 22 6164 8531
Nandish Patel Quantitative & Alternates nandish.patel@elaracapital.com +91 22 6164 8564
Biren Mehta Head - Sales Trading biren.mehta@elaracapital.com +91 22 6164 8500
Kalpesh Parekh India kalpesh.parekh@ElaraCapital.com +91 22 6164 8555
Manoj Murarka India manoj.murarka@elaracapital.com +91 22 6164 8551
Anil Pawar India anil.pawar@elaracapital.com +91 22 6164 8552
Nilesh Chheda India nilesh.chheda@elaracapital.com +91 22 6164 8554
Nupur Barve India nupur.barve@elaracapital.com +91 22 6164 8532
Research
Dr Bino Pathiparampil Head of Research Healthcare, Pharmaceuticals, Strategy bino.pathiparampil@elaracapital.com +91 22 6164 8689
Amit Purohit Analyst Dairy, FMCG, Paints amit.purohit@elaracapital.com +91 22 6164 8594
Ankita Shah Analyst Infrastructure, Ports & Logistics, Industrials ankita.shah@elaracapital.com +91 22 6164 8516
Biju Samuel Analyst Quantitative & Alternate Strategy biju.samuel@elaracapital.com +91 22 6164 8505
Gagan Dixit Analyst Aviation, Chemicals, Oil & Gas gagan.dixit@elaracapital.com +91 22 6164 8504
Garima Kapoor Economist garima.kapoor@elaracapital.com +91 22 6164 8527
Harshit Kapadia Analyst Capital Goods, Consumer Electronics harshit.kapadia@elaracapital.com +91 22 6164 8542
Jay Kale, CFA Analyst Auto & Auto Ancillaries jay.kale@elaracapital.com +91 22 6164 8507
Karan Taurani Analyst Media & Entertainment, Alcobev, QSR, Internet karan.taurani@elaracapital.com +91 22 6164 8513
Prakhar Agarwal Analyst Banking & Financials prakhar.agarwal@elaracapital.com +91 22 6164 8502
Prashant Biyani Analyst Agrochemicals, Fertilisers, Sugar prashant.biyani@elaracapital.com +91 22 6164 8581
Prerna Jhunjhunwala Analyst Textiles, Retail prerna.jhunjhunwala@elaracapital.com +91 22 6164 8519
Ravi Sodah Analyst Cement, Building Materials, Metals & Mining ravi.sodah@elaracapital.com +91 22 6164 8517
Ruchi Mukhija Analyst IT Services ruchi.mukhija@elaracapital.com +91 22 6164 8583
Rupesh Sankhe Analyst Utilities, Renewables, Capital Goods, Real Estate rupesh.sankhe@elaracapital.com +91 22 6164 8518
Shweta Daptardar Analyst Diversified Financials, Non Lending Financials shweta.daptardar@elaracapital.com +91 22 6164 8559
Reena Shah Jr. Analyst Aviation, Chemicals, Oil & Gas reena.shah@elaracapital.com +91 22 6164 8591
Saurabh Mitra Sr. Associate Cement, Building Materials, Metals & Mining saurabh.mitra@elaracapital.com +91 22 6164 8546
Aditya Jaiswal Associate Strategy aditya.jaiswal@elaracapital.com +91 22 4204 8683
Amogh Deshpande Associate Aviation, Chemicals, Oil & Gas amogh.deshpande@elaracapital.com +91 22 4204 8664
Ash Shah Associate Infrastructure, Ports & Logistics ash.shah@elaracapital.com +91 22 6164 8500
Bhavi Shah Associate Cement, Building Materials, Metals & Mining bhavi.shah@elaracapital.com +91 22 6164 8521
Gaurang Sakare Associate Healthcare, Pharmaceuticals gaurang.sakare@elaracapital.com +91 22 4204 8618
Heet Van Associate Healthcare, Pharmaceuticals heet.van@elaracapital.com +91 22 6164 8545
Himanshu Dhyawala Associate Diversified Financials, Non Lending Financials himanshu.dhyawala@elaracapital.com +91 22 4204 8661
Kartik Solanki Associate Banking & Financials kartik.solanki@elaracapital.com +91 22 4204 8604
Ketul Dalal Associate Auto & Auto Ancillaries ketul.dalal@elaracapital.com +91 22 4204 8693
Keval Shah Associate Strategy keval.shah@elaracapital.com +91 22 4204 8669
Mudit Kabra Associate Capital Goods, Consumer Electronics mudit.kabra@elaracapital.com +91 22 4204 8611
Nemish Sundar Associate Capital Goods, Consumer Electronics nemish.sundar@elaracapital.com +91 22 6164 8500
Nishant Chowhan, CFA Associate Auto & Auto Ancillaries nishant.chowhan@elaracapital.com +91 22 4204 8667
Palak Shah Associate Banking & Financials palak.shah@elaracapital.com +91 22 6164 8500
Ragini Pande Associate Utilities, Renewables ragini.pande@elaracapital.com +91 22 6164 8500
Rohit Harlikar Associate Dairy, FMCG, Paints rohit.harlikar@elaracapital.com +91 22 6164 8562
Rounak Ray Associate Media & Entertainment, Alcobev, QSR, Internet rounak.ray@elaracapital.com +91 22 4204 8684
Seema Nayak Associate IT Services seema.nayak@elaracapital.com +91 22 4204 8687
Shweta Roy Associate Economics shweta.roy@elaracapital.com +91 22 6164 8500
Subhankar Sanyal Associate Economics subhankar.sanyal@elaracapital.com +91 22 4204 8688
Tanvi Tambat Associate Real Estate tanvi.tambat@elaracapital.com +91 22 6164 8537
Vaibhav Chechani Associate IT Services vaibhav.chechani@elaracapital.com +91 22 4204 8682
Vidhi Puj Associate Dairy, FMCG, Paints vidhi.puj@elaracapital.com +91 22 4204 8692
Vinayak Patil Database vinayak.patil@elaracapital.com +91 22 6164 8510
Priyanka Sheth Editor priyanka.sheth@elaracapital.com +91 22 6164 8568
Prakriti Singh Editor prakriti.singh@elaracapital.com +91 22 6164 8500
Gurunath Parab Production gurunath.parab@elaracapital.com +91 22 6164 8515
Jinesh Bhansali Production jinesh.bhansali@elaracapital.com +91 22 6164 8537
Access our reports on Bloomberg: Type RESP ESEC <GO> Also available on Thomson & Reuters
Elara Securities (India) Private Limited
Registered Office Address: One International Center, Tower 3, 21st Floor, Senapati Bapat Marg,
Elphinstone Road (West) Mumbai – 400 013, India Tel : +91 22 6164 8500
CIN: U74992MH2007PTC172297 | SEBI Research Analyst Registration No.: INH000000933
Member of BSE Limited and National Stock Exchange of India Limited | SEBI REGN. NO.: INZ 000 238236
Member of Central Depository Services (India) Limited | SEBI REGN. NO.: IN-DP-370-2018
Investor Grievance Email ID: investor.grievances@elaracapital.com - Tel. +91 22 6164 8509
Compliance Officer: Mr. Anand Rao - Email ID: anand.rao@elaracapial.com - Tel. +91 22 6164 8509

More Related Content

Similar to World Cup- Consumption Sector Update .pdf

Digital Media: A Blockbuster in the Making
Digital Media: A Blockbuster in the MakingDigital Media: A Blockbuster in the Making
Digital Media: A Blockbuster in the MakingSocial Samosa
 
Media and Entertainment Sector Report - December 2018
Media and Entertainment Sector Report - December 2018Media and Entertainment Sector Report - December 2018
Media and Entertainment Sector Report - December 2018India Brand Equity Foundation
 
Media and Entertainment Sector Report - November 2018
Media and Entertainment Sector Report - November 2018Media and Entertainment Sector Report - November 2018
Media and Entertainment Sector Report - November 2018India Brand Equity Foundation
 
DENTSU - 2023 Global Ad Spend Forecasts.pdf
DENTSU - 2023 Global Ad Spend Forecasts.pdfDENTSU - 2023 Global Ad Spend Forecasts.pdf
DENTSU - 2023 Global Ad Spend Forecasts.pdfdigitalinasia
 
Global Entertainment & Media Outlook 2023–2027 - India perspective
Global Entertainment & Media Outlook 2023–2027 - India perspective Global Entertainment & Media Outlook 2023–2027 - India perspective
Global Entertainment & Media Outlook 2023–2027 - India perspective Social Samosa
 
2019 Global Entertainment & Media Outlook: 2019-2023
2019 Global Entertainment & Media Outlook: 2019-20232019 Global Entertainment & Media Outlook: 2019-2023
2019 Global Entertainment & Media Outlook: 2019-2023Social Samosa
 

Similar to World Cup- Consumption Sector Update .pdf (20)

Media and Entertainment Sector Report May 2018
Media and Entertainment Sector Report May 2018Media and Entertainment Sector Report May 2018
Media and Entertainment Sector Report May 2018
 
Entertainment Sectore Report - October 2016
Entertainment Sectore Report - October 2016Entertainment Sectore Report - October 2016
Entertainment Sectore Report - October 2016
 
Entertainment Sectore Report - October 2016
Entertainment Sectore Report - October 2016Entertainment Sectore Report - October 2016
Entertainment Sectore Report - October 2016
 
Entertainment Sectoral Report - Septembe 2016
Entertainment  Sectoral Report - Septembe 2016Entertainment  Sectoral Report - Septembe 2016
Entertainment Sectoral Report - Septembe 2016
 
Media and Entertainment Sector Report June 2018
Media and Entertainment Sector Report June 2018Media and Entertainment Sector Report June 2018
Media and Entertainment Sector Report June 2018
 
Digital Media: A Blockbuster in the Making
Digital Media: A Blockbuster in the MakingDigital Media: A Blockbuster in the Making
Digital Media: A Blockbuster in the Making
 
Entertainment Sector Reports November-2016
Entertainment Sector Reports November-2016Entertainment Sector Reports November-2016
Entertainment Sector Reports November-2016
 
Media and Entertainment Sector Report - December 2018
Media and Entertainment Sector Report - December 2018Media and Entertainment Sector Report - December 2018
Media and Entertainment Sector Report - December 2018
 
Media and Entertainment Sector Report - November 2018
Media and Entertainment Sector Report - November 2018Media and Entertainment Sector Report - November 2018
Media and Entertainment Sector Report - November 2018
 
DENTSU - 2023 Global Ad Spend Forecasts.pdf
DENTSU - 2023 Global Ad Spend Forecasts.pdfDENTSU - 2023 Global Ad Spend Forecasts.pdf
DENTSU - 2023 Global Ad Spend Forecasts.pdf
 
Media and Entertainment Sector Report - August 2018
Media and Entertainment Sector Report - August 2018Media and Entertainment Sector Report - August 2018
Media and Entertainment Sector Report - August 2018
 
Media and Entertainment Sector Report October 2017
Media and Entertainment Sector Report October 2017Media and Entertainment Sector Report October 2017
Media and Entertainment Sector Report October 2017
 
Entertainment Sectore Report - December 2016
Entertainment Sectore Report - December 2016Entertainment Sectore Report - December 2016
Entertainment Sectore Report - December 2016
 
Global Entertainment & Media Outlook 2023–2027 - India perspective
Global Entertainment & Media Outlook 2023–2027 - India perspective Global Entertainment & Media Outlook 2023–2027 - India perspective
Global Entertainment & Media Outlook 2023–2027 - India perspective
 
Media and Entertainment Sector Report November 2017
Media and Entertainment Sector Report November 2017Media and Entertainment Sector Report November 2017
Media and Entertainment Sector Report November 2017
 
Media and Entertainment Sector Report November 2017
Media and Entertainment Sector Report November 2017Media and Entertainment Sector Report November 2017
Media and Entertainment Sector Report November 2017
 
2019 Global Entertainment & Media Outlook: 2019-2023
2019 Global Entertainment & Media Outlook: 2019-20232019 Global Entertainment & Media Outlook: 2019-2023
2019 Global Entertainment & Media Outlook: 2019-2023
 
Entertainment Sector Report April-2017
Entertainment Sector Report April-2017Entertainment Sector Report April-2017
Entertainment Sector Report April-2017
 
Entertainment Sector Report June 2017
Entertainment Sector Report June 2017Entertainment Sector Report June 2017
Entertainment Sector Report June 2017
 
Entertainment Sector Report - March 2017
Entertainment Sector Report - March 2017Entertainment Sector Report - March 2017
Entertainment Sector Report - March 2017
 

More from Social Samosa

TAM_AdEx-Cross_Media_Report-Banking_Finance_Investment_(BFSI)_2023.pdf
TAM_AdEx-Cross_Media_Report-Banking_Finance_Investment_(BFSI)_2023.pdfTAM_AdEx-Cross_Media_Report-Banking_Finance_Investment_(BFSI)_2023.pdf
TAM_AdEx-Cross_Media_Report-Banking_Finance_Investment_(BFSI)_2023.pdfSocial Samosa
 
Honasa Consumer Limited Impact Report 2024.pdf
Honasa Consumer Limited Impact Report 2024.pdfHonasa Consumer Limited Impact Report 2024.pdf
Honasa Consumer Limited Impact Report 2024.pdfSocial Samosa
 
The+State+of+Careers+In+Retention+Marketing-2.pdf
The+State+of+Careers+In+Retention+Marketing-2.pdfThe+State+of+Careers+In+Retention+Marketing-2.pdf
The+State+of+Careers+In+Retention+Marketing-2.pdfSocial Samosa
 
TAM Sports_IPL 17 Till Match 37_Celebrity Endorsement _Report.pdf
TAM Sports_IPL 17 Till Match 37_Celebrity Endorsement _Report.pdfTAM Sports_IPL 17 Till Match 37_Celebrity Endorsement _Report.pdf
TAM Sports_IPL 17 Till Match 37_Celebrity Endorsement _Report.pdfSocial Samosa
 
Social Samosa Guidebook for SAMMIES 2024.pdf
Social Samosa Guidebook for SAMMIES 2024.pdfSocial Samosa Guidebook for SAMMIES 2024.pdf
Social Samosa Guidebook for SAMMIES 2024.pdfSocial Samosa
 
Kantar AI Summit- Under Embargo till Wednesday, 24th April 2024, 4 PM, IST.pdf
Kantar AI Summit- Under Embargo till Wednesday, 24th April 2024, 4 PM, IST.pdfKantar AI Summit- Under Embargo till Wednesday, 24th April 2024, 4 PM, IST.pdf
Kantar AI Summit- Under Embargo till Wednesday, 24th April 2024, 4 PM, IST.pdfSocial Samosa
 
TAM AdEx 2023 Cross Media Advertising Recap - Auto Sector
TAM AdEx 2023 Cross Media Advertising Recap - Auto SectorTAM AdEx 2023 Cross Media Advertising Recap - Auto Sector
TAM AdEx 2023 Cross Media Advertising Recap - Auto SectorSocial Samosa
 
TAM Sports IPL 17 Advertising Report- M01 - M23
TAM Sports IPL 17 Advertising Report- M01 - M23TAM Sports IPL 17 Advertising Report- M01 - M23
TAM Sports IPL 17 Advertising Report- M01 - M23Social Samosa
 
TAM Sports-IPL 17 Advertising Report- M01 - M15.xlsx - IPL 17 FCT (Commercial...
TAM Sports-IPL 17 Advertising Report- M01 - M15.xlsx - IPL 17 FCT (Commercial...TAM Sports-IPL 17 Advertising Report- M01 - M15.xlsx - IPL 17 FCT (Commercial...
TAM Sports-IPL 17 Advertising Report- M01 - M15.xlsx - IPL 17 FCT (Commercial...Social Samosa
 
TAM AdEx - 2023 Cross Media Advertising Recap - FMCG Sector.pdf
TAM AdEx - 2023 Cross Media Advertising Recap - FMCG Sector.pdfTAM AdEx - 2023 Cross Media Advertising Recap - FMCG Sector.pdf
TAM AdEx - 2023 Cross Media Advertising Recap - FMCG Sector.pdfSocial Samosa
 
TAM Sports-IPL 17 Advertising Report- M01 - M07.xlsx - IPL 17 FCT (Commercial...
TAM Sports-IPL 17 Advertising Report- M01 - M07.xlsx - IPL 17 FCT (Commercial...TAM Sports-IPL 17 Advertising Report- M01 - M07.xlsx - IPL 17 FCT (Commercial...
TAM Sports-IPL 17 Advertising Report- M01 - M07.xlsx - IPL 17 FCT (Commercial...Social Samosa
 
LinkedIn-Deep-Sales-Playbook-Report-.pdf
LinkedIn-Deep-Sales-Playbook-Report-.pdfLinkedIn-Deep-Sales-Playbook-Report-.pdf
LinkedIn-Deep-Sales-Playbook-Report-.pdfSocial Samosa
 
Brand Trust Report 2024 TRA Report Listings
Brand Trust Report 2024 TRA Report ListingsBrand Trust Report 2024 TRA Report Listings
Brand Trust Report 2024 TRA Report ListingsSocial Samosa
 
TAM AdEx-A Pixelated view into Digital Advertising Trends for Y 2023.pdf
TAM AdEx-A Pixelated view into Digital Advertising Trends for Y 2023.pdfTAM AdEx-A Pixelated view into Digital Advertising Trends for Y 2023.pdf
TAM AdEx-A Pixelated view into Digital Advertising Trends for Y 2023.pdfSocial Samosa
 
Cricket Playbook for Growth Marketers: Adjust x Glance report
Cricket Playbook for Growth Marketers: Adjust x Glance reportCricket Playbook for Growth Marketers: Adjust x Glance report
Cricket Playbook for Growth Marketers: Adjust x Glance reportSocial Samosa
 
TheOrmaxSportsAudienceReport2024-MediaHighlights.pdf
TheOrmaxSportsAudienceReport2024-MediaHighlights.pdfTheOrmaxSportsAudienceReport2024-MediaHighlights.pdf
TheOrmaxSportsAudienceReport2024-MediaHighlights.pdfSocial Samosa
 
Voter engagement - Election iCubesWire Report
Voter engagement - Election iCubesWire ReportVoter engagement - Election iCubesWire Report
Voter engagement - Election iCubesWire ReportSocial Samosa
 
TAM AdEx report - Print Advertising 2023
TAM AdEx report - Print Advertising 2023TAM AdEx report - Print Advertising 2023
TAM AdEx report - Print Advertising 2023Social Samosa
 
D2C Advantage X Toolkit MMA Global & Publicis Commerce
D2C Advantage X Toolkit MMA Global & Publicis CommerceD2C Advantage X Toolkit MMA Global & Publicis Commerce
D2C Advantage X Toolkit MMA Global & Publicis CommerceSocial Samosa
 
Report on the future of Digital Advertising in India
Report on the future of Digital Advertising in IndiaReport on the future of Digital Advertising in India
Report on the future of Digital Advertising in IndiaSocial Samosa
 

More from Social Samosa (20)

TAM_AdEx-Cross_Media_Report-Banking_Finance_Investment_(BFSI)_2023.pdf
TAM_AdEx-Cross_Media_Report-Banking_Finance_Investment_(BFSI)_2023.pdfTAM_AdEx-Cross_Media_Report-Banking_Finance_Investment_(BFSI)_2023.pdf
TAM_AdEx-Cross_Media_Report-Banking_Finance_Investment_(BFSI)_2023.pdf
 
Honasa Consumer Limited Impact Report 2024.pdf
Honasa Consumer Limited Impact Report 2024.pdfHonasa Consumer Limited Impact Report 2024.pdf
Honasa Consumer Limited Impact Report 2024.pdf
 
The+State+of+Careers+In+Retention+Marketing-2.pdf
The+State+of+Careers+In+Retention+Marketing-2.pdfThe+State+of+Careers+In+Retention+Marketing-2.pdf
The+State+of+Careers+In+Retention+Marketing-2.pdf
 
TAM Sports_IPL 17 Till Match 37_Celebrity Endorsement _Report.pdf
TAM Sports_IPL 17 Till Match 37_Celebrity Endorsement _Report.pdfTAM Sports_IPL 17 Till Match 37_Celebrity Endorsement _Report.pdf
TAM Sports_IPL 17 Till Match 37_Celebrity Endorsement _Report.pdf
 
Social Samosa Guidebook for SAMMIES 2024.pdf
Social Samosa Guidebook for SAMMIES 2024.pdfSocial Samosa Guidebook for SAMMIES 2024.pdf
Social Samosa Guidebook for SAMMIES 2024.pdf
 
Kantar AI Summit- Under Embargo till Wednesday, 24th April 2024, 4 PM, IST.pdf
Kantar AI Summit- Under Embargo till Wednesday, 24th April 2024, 4 PM, IST.pdfKantar AI Summit- Under Embargo till Wednesday, 24th April 2024, 4 PM, IST.pdf
Kantar AI Summit- Under Embargo till Wednesday, 24th April 2024, 4 PM, IST.pdf
 
TAM AdEx 2023 Cross Media Advertising Recap - Auto Sector
TAM AdEx 2023 Cross Media Advertising Recap - Auto SectorTAM AdEx 2023 Cross Media Advertising Recap - Auto Sector
TAM AdEx 2023 Cross Media Advertising Recap - Auto Sector
 
TAM Sports IPL 17 Advertising Report- M01 - M23
TAM Sports IPL 17 Advertising Report- M01 - M23TAM Sports IPL 17 Advertising Report- M01 - M23
TAM Sports IPL 17 Advertising Report- M01 - M23
 
TAM Sports-IPL 17 Advertising Report- M01 - M15.xlsx - IPL 17 FCT (Commercial...
TAM Sports-IPL 17 Advertising Report- M01 - M15.xlsx - IPL 17 FCT (Commercial...TAM Sports-IPL 17 Advertising Report- M01 - M15.xlsx - IPL 17 FCT (Commercial...
TAM Sports-IPL 17 Advertising Report- M01 - M15.xlsx - IPL 17 FCT (Commercial...
 
TAM AdEx - 2023 Cross Media Advertising Recap - FMCG Sector.pdf
TAM AdEx - 2023 Cross Media Advertising Recap - FMCG Sector.pdfTAM AdEx - 2023 Cross Media Advertising Recap - FMCG Sector.pdf
TAM AdEx - 2023 Cross Media Advertising Recap - FMCG Sector.pdf
 
TAM Sports-IPL 17 Advertising Report- M01 - M07.xlsx - IPL 17 FCT (Commercial...
TAM Sports-IPL 17 Advertising Report- M01 - M07.xlsx - IPL 17 FCT (Commercial...TAM Sports-IPL 17 Advertising Report- M01 - M07.xlsx - IPL 17 FCT (Commercial...
TAM Sports-IPL 17 Advertising Report- M01 - M07.xlsx - IPL 17 FCT (Commercial...
 
LinkedIn-Deep-Sales-Playbook-Report-.pdf
LinkedIn-Deep-Sales-Playbook-Report-.pdfLinkedIn-Deep-Sales-Playbook-Report-.pdf
LinkedIn-Deep-Sales-Playbook-Report-.pdf
 
Brand Trust Report 2024 TRA Report Listings
Brand Trust Report 2024 TRA Report ListingsBrand Trust Report 2024 TRA Report Listings
Brand Trust Report 2024 TRA Report Listings
 
TAM AdEx-A Pixelated view into Digital Advertising Trends for Y 2023.pdf
TAM AdEx-A Pixelated view into Digital Advertising Trends for Y 2023.pdfTAM AdEx-A Pixelated view into Digital Advertising Trends for Y 2023.pdf
TAM AdEx-A Pixelated view into Digital Advertising Trends for Y 2023.pdf
 
Cricket Playbook for Growth Marketers: Adjust x Glance report
Cricket Playbook for Growth Marketers: Adjust x Glance reportCricket Playbook for Growth Marketers: Adjust x Glance report
Cricket Playbook for Growth Marketers: Adjust x Glance report
 
TheOrmaxSportsAudienceReport2024-MediaHighlights.pdf
TheOrmaxSportsAudienceReport2024-MediaHighlights.pdfTheOrmaxSportsAudienceReport2024-MediaHighlights.pdf
TheOrmaxSportsAudienceReport2024-MediaHighlights.pdf
 
Voter engagement - Election iCubesWire Report
Voter engagement - Election iCubesWire ReportVoter engagement - Election iCubesWire Report
Voter engagement - Election iCubesWire Report
 
TAM AdEx report - Print Advertising 2023
TAM AdEx report - Print Advertising 2023TAM AdEx report - Print Advertising 2023
TAM AdEx report - Print Advertising 2023
 
D2C Advantage X Toolkit MMA Global & Publicis Commerce
D2C Advantage X Toolkit MMA Global & Publicis CommerceD2C Advantage X Toolkit MMA Global & Publicis Commerce
D2C Advantage X Toolkit MMA Global & Publicis Commerce
 
Report on the future of Digital Advertising in India
Report on the future of Digital Advertising in IndiaReport on the future of Digital Advertising in India
Report on the future of Digital Advertising in India
 

Recently uploaded

Unraveling the Mystery of the Hinterkaifeck Murders.pptx
Unraveling the Mystery of the Hinterkaifeck Murders.pptxUnraveling the Mystery of the Hinterkaifeck Murders.pptx
Unraveling the Mystery of the Hinterkaifeck Murders.pptxelizabethella096
 
BDSM⚡Call Girls in Sector 150 Noida Escorts >༒8448380779 Escort Service
BDSM⚡Call Girls in Sector 150 Noida Escorts >༒8448380779 Escort ServiceBDSM⚡Call Girls in Sector 150 Noida Escorts >༒8448380779 Escort Service
BDSM⚡Call Girls in Sector 150 Noida Escorts >༒8448380779 Escort ServiceDelhi Call girls
 
Martal Group - B2B Lead Gen Agency - Onboarding Overview
Martal Group - B2B Lead Gen Agency - Onboarding OverviewMartal Group - B2B Lead Gen Agency - Onboarding Overview
Martal Group - B2B Lead Gen Agency - Onboarding OverviewMartal Group
 
Social media, ppt. Features, characteristics
Social media, ppt. Features, characteristicsSocial media, ppt. Features, characteristics
Social media, ppt. Features, characteristicswasim792942
 
Unraveling the Mystery of The Circleville Letters.pptx
Unraveling the Mystery of The Circleville Letters.pptxUnraveling the Mystery of The Circleville Letters.pptx
Unraveling the Mystery of The Circleville Letters.pptxelizabethella096
 
Google 3rd-Party Cookie Deprecation [Update] + 5 Best Strategies
Google 3rd-Party Cookie Deprecation [Update] + 5 Best StrategiesGoogle 3rd-Party Cookie Deprecation [Update] + 5 Best Strategies
Google 3rd-Party Cookie Deprecation [Update] + 5 Best StrategiesSearch Engine Journal
 
What is Google Search Console and What is it provide?
What is Google Search Console and What is it provide?What is Google Search Console and What is it provide?
What is Google Search Console and What is it provide?riteshhsociall
 
Digital-Marketing-Into-by-Zoraiz-Ahmad.pptx
Digital-Marketing-Into-by-Zoraiz-Ahmad.pptxDigital-Marketing-Into-by-Zoraiz-Ahmad.pptx
Digital-Marketing-Into-by-Zoraiz-Ahmad.pptxZACGaming
 
Kraft Mac and Cheese campaign presentation
Kraft Mac and Cheese campaign presentationKraft Mac and Cheese campaign presentation
Kraft Mac and Cheese campaign presentationtbatkhuu1
 

Recently uploaded (20)

Unraveling the Mystery of the Hinterkaifeck Murders.pptx
Unraveling the Mystery of the Hinterkaifeck Murders.pptxUnraveling the Mystery of the Hinterkaifeck Murders.pptx
Unraveling the Mystery of the Hinterkaifeck Murders.pptx
 
Chat GPT Master Class - Leslie Hughes, PUNCH Media
Chat GPT Master Class - Leslie Hughes, PUNCH MediaChat GPT Master Class - Leslie Hughes, PUNCH Media
Chat GPT Master Class - Leslie Hughes, PUNCH Media
 
BDSM⚡Call Girls in Sector 150 Noida Escorts >༒8448380779 Escort Service
BDSM⚡Call Girls in Sector 150 Noida Escorts >༒8448380779 Escort ServiceBDSM⚡Call Girls in Sector 150 Noida Escorts >༒8448380779 Escort Service
BDSM⚡Call Girls in Sector 150 Noida Escorts >༒8448380779 Escort Service
 
Martal Group - B2B Lead Gen Agency - Onboarding Overview
Martal Group - B2B Lead Gen Agency - Onboarding OverviewMartal Group - B2B Lead Gen Agency - Onboarding Overview
Martal Group - B2B Lead Gen Agency - Onboarding Overview
 
Social media, ppt. Features, characteristics
Social media, ppt. Features, characteristicsSocial media, ppt. Features, characteristics
Social media, ppt. Features, characteristics
 
Riding the Wave of AI Disruption - Navigating the AI Fear Cycle in Marketing ...
Riding the Wave of AI Disruption - Navigating the AI Fear Cycle in Marketing ...Riding the Wave of AI Disruption - Navigating the AI Fear Cycle in Marketing ...
Riding the Wave of AI Disruption - Navigating the AI Fear Cycle in Marketing ...
 
Navigating the SEO of Tomorrow, Competitive Benchmarking, China as an e-Comme...
Navigating the SEO of Tomorrow, Competitive Benchmarking, China as an e-Comme...Navigating the SEO of Tomorrow, Competitive Benchmarking, China as an e-Comme...
Navigating the SEO of Tomorrow, Competitive Benchmarking, China as an e-Comme...
 
How to Create a Social Media Plan Like a Pro - Jordan Scheltgen
How to Create a Social Media Plan Like a Pro - Jordan ScheltgenHow to Create a Social Media Plan Like a Pro - Jordan Scheltgen
How to Create a Social Media Plan Like a Pro - Jordan Scheltgen
 
Digital Strategy Master Class - Andrew Rupert
Digital Strategy Master Class - Andrew RupertDigital Strategy Master Class - Andrew Rupert
Digital Strategy Master Class - Andrew Rupert
 
No Cookies No Problem - Steve Krull, Be Found Online
No Cookies No Problem - Steve Krull, Be Found OnlineNo Cookies No Problem - Steve Krull, Be Found Online
No Cookies No Problem - Steve Krull, Be Found Online
 
The Future of Brands on LinkedIn - Alison Kaltman
The Future of Brands on LinkedIn - Alison KaltmanThe Future of Brands on LinkedIn - Alison Kaltman
The Future of Brands on LinkedIn - Alison Kaltman
 
The 100x Factor Growth with AI - Susan Diaz
The 100x Factor  Growth with AI - Susan DiazThe 100x Factor  Growth with AI - Susan Diaz
The 100x Factor Growth with AI - Susan Diaz
 
Unraveling the Mystery of The Circleville Letters.pptx
Unraveling the Mystery of The Circleville Letters.pptxUnraveling the Mystery of The Circleville Letters.pptx
Unraveling the Mystery of The Circleville Letters.pptx
 
Google 3rd-Party Cookie Deprecation [Update] + 5 Best Strategies
Google 3rd-Party Cookie Deprecation [Update] + 5 Best StrategiesGoogle 3rd-Party Cookie Deprecation [Update] + 5 Best Strategies
Google 3rd-Party Cookie Deprecation [Update] + 5 Best Strategies
 
What is Google Search Console and What is it provide?
What is Google Search Console and What is it provide?What is Google Search Console and What is it provide?
What is Google Search Console and What is it provide?
 
Top 5 Breakthrough AI Innovations Elevating Content Creation and Personalizat...
Top 5 Breakthrough AI Innovations Elevating Content Creation and Personalizat...Top 5 Breakthrough AI Innovations Elevating Content Creation and Personalizat...
Top 5 Breakthrough AI Innovations Elevating Content Creation and Personalizat...
 
Digital-Marketing-Into-by-Zoraiz-Ahmad.pptx
Digital-Marketing-Into-by-Zoraiz-Ahmad.pptxDigital-Marketing-Into-by-Zoraiz-Ahmad.pptx
Digital-Marketing-Into-by-Zoraiz-Ahmad.pptx
 
SEO Master Class - Steve Wiideman, Wiideman Consulting Group
SEO Master Class - Steve Wiideman, Wiideman Consulting GroupSEO Master Class - Steve Wiideman, Wiideman Consulting Group
SEO Master Class - Steve Wiideman, Wiideman Consulting Group
 
Kraft Mac and Cheese campaign presentation
Kraft Mac and Cheese campaign presentationKraft Mac and Cheese campaign presentation
Kraft Mac and Cheese campaign presentation
 
A.I. and The Social Media Shift - Mohit Rajhans
A.I. and The Social Media Shift - Mohit RajhansA.I. and The Social Media Shift - Mohit Rajhans
A.I. and The Social Media Shift - Mohit Rajhans
 

World Cup- Consumption Sector Update .pdf

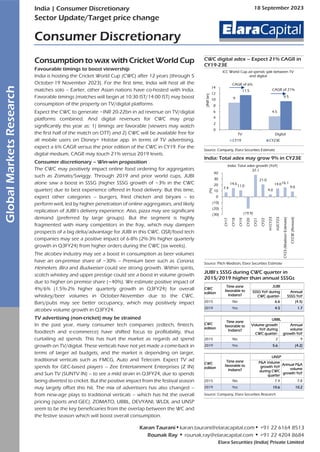
  • 1. Global Markets Research Elara Securities (India) Private Limited Karan Taurani•karan.taurani@elaracapital.com• +91 22 6164 8513 Rounak Ray • rounak.ray@elaracapital.com • +91 22 4204 8684 Consumption to wax with Cricket World Cup Favourable timings to boost viewership India is hosting the Cricket World Cup (CWC) after 12 years (through 5 October-19 November 2023). For the first time, India will host all the matches solo – Earlier, other Asian nations have co-hosted with India. Favorable timings (matches will begin at 10:30 IST/14:00 IST) may boost consumption of the property on TV/digital platforms. Expect the CWC to generate ~INR 20-22bn in ad revenue on TV/digital platforms combined. And digital revenues for CWC may prop significantly this year as: 1) timings are favorable (viewers may watch the first half of the match on OTT) and 2) CWC will be available free for all mobile users on Disney+ Hotstar app. In terms of TV advertising, expect a 6% CAGR versus the prior edition of the CWC in CY19. For the digital medium, CAGR may touch 21% versus 2019 levels. Consumer discretionary – Win-win proposition The CWC may positively impact online food ordering for aggregators such as Zomato/Swiggy. Through 2019 and prior world cups, JUBI alone saw a boost in SSSG (higher SSSG growth of ~3% in the CWC quarter) due to best experience offered in food delivery. But this time, expect other categories – burgers, fried chicken and biryani – to perform well, led by higher penetration of online aggregators, and likely replication of JUBI’s delivery experience. Also, pizza may see significant demand (preferred by large groups). But the segment is highly fragmented with many competitors in the fray, which may dampen prospects of a big delta/advantage for JUBI in this CWC. QSR/food tech companies may see a positive impact of 6-8% (2%-3% higher quarterly growth in Q3FY24) from higher orders during the CWC (six weeks). The alcobev industry may see a boost in consumption as beer volumes have an on-premise share of ~30% – Premium beer such as Corona, Heineken, Bira and Budweiser could see strong growth. Within spirits, scotch whiskey and upper prestige could see a boost in volume growth due to higher on premise share (~40%). We estimate positive impact of 4%/6% (1.5%-2% higher quarterly growth in Q3FY24) for overall whiskey/beer volumes in October-November due to the CWC. Bars/pubs may see better occupancy, which may positively impact alcobev volume growth in Q3FY24. TV advertising (non-cricket) may be strained In the past year, many consumer tech companies (edtech, fintech, foodtech and e-commerce) have shifted focus to profitability, thus curtailing ad spends. This has hurt the market as regards ad spend growth on TV/digital. These verticals have not yet made a come-back in terms of larger ad budgets, and the market is depending on larger, traditional verticals such as FMCG, Auto and Telecom. Expect TV ad spends for GEC-based players – Zee Entertainment Enterprises (Z IN) and Sun TV (SUNTV IN) – to see a mild strain in Q3FY24, due to spends being diverted to cricket. But the positive impact from the festival season may largely offset this hit. The mix of advertisers has also changed – from new-age plays to traditional verticals – which has hit the overall pricing (sports and GEC). ZOMATO, UBBL, DEVYANI, WLDL and UNSP seem to be the key beneficiaries from the overlap between the WC and the festive season which will boost overall consumption. India | Consumer Discretionary 18 September 2023 Sector Update/Target price change Consumer Discretionary CWC digital adex – Expect 21% CAGR in CY19-23E Source: Company, Elara Securities Estimate India: Total adex may grow 9% in CY23E Source: Pitch Madison, Elara Securities Estimate JUBI’s SSSG during CWC quarter in 2015/2019 higher than annual SSSGs CWC edition Time zone favorable to Indians? JUBI SSSG YoY during CWC quarter- Annual SSSG YoY 2015 No 6.6 (4.5) 2019 Yes 4.5 1.7 CWC edition Time zone favorable to Indians? UBBL Volume growth YoY during CWC quarter- Annual volume growth YoY 2015 No 2 9 2019 Yes 5.6 (4.2) CWC edition Time zone favorable to Indians? UNSP P&A Volume growth YoY during CWC quarter Annual P&A volume growth YoY 2015 No 7.4 7.8 2019 Yes 10.6 10.2 Source: Company, Elara Securities Research 9 4.5 11.5 9.5 0 2 4 6 8 10 12 14 TV Digital (INR bn) ICC World Cup ad spends split between TV and digital CY19 CY23E CAGR of 6% CAGR of 21% 7.4 14.6 11.0 (19.9) 37.1 21.0 4.0 14.016.1 9.0 (30) (20) (10) 0 10 20 30 40 CY17 CY18 CY19 CY20 CY21 CY22 H1CY23 H2CY23 CY23 (Madison Estimate) CY23E (Revised) (%) India: Total adex growth (YoY)
  • 2. Consumer Discretionary 2 Elara Securities (India) Private Limited Peer valuations Company Ticker Rating Mcap CMP Target Upside P/E (x) EV/EBITDA (x) ROE (x) (INR bn) (INR) (INR) (%) FY24E FY25E FY26E FY24E FY25E FY26E FY24E FY25E FY26E Zomato Zomato IN Buy 886 103 130 26 (1,637.8) 148.1 66.7 (274.4) 126.1 48.6 (0.3) 3.0 6.3 United Spirits UNSP IN Reduce 763 1,049 1,060 1 64.5 55.1 47.4 40.9 35.7 31.3 16.5 16.2 15.8 United Breweries UBBL IN Reduce 426 1,611 1,510 (6) 82.0 54.7 45.9 49.3 34.6 29.2 11.9 15.8 16.3 Jubilant FoodWorks JUBI IN Accumulate 352 533 560 5 78.9 62.0 52.8 28.3 24.1 21.2 18.9 19.9 19.3 Westlife Foodworld WESTLIFE IN Reduce 153 983 940 (4) 106.0 82.2 65.5 35.4 29.4 25.3 23.6 24.8 24.4 Note: We roll over to Dec-24E TP of INR 560 and INR 940 for JUBI (on 57x one-year forward P/E) and WLDL (on 31x one-year forward EV/EBITDA, pre IndAS) respectively; pricing as on 15 September 2023; rating as per last published report; Source: Company, Elara Securities Estimate
  • 3. Consumer Discretionary Consumer Discretionary 3 Elara Securities (India) Private Limited Cricket World Cup adex CWC 2023E to yield ~20% more TV adex than 2019 The upcoming CWC may generate at least 20% more in TV adex than it did in 2019. Sports advertising revenue has witnessed a CAGR of ~20% in CY15-22. And for 2023 CWC, advertising yields are at a mild premium vs 2019 pricing levels, indicating that the same pricing structure is being maintained. Most International Cricket Council (ICC) event sponsors are Indian brands and have committed substantial investments. Digital adex: CWC 2023E to grow at least 70% versus CWC 2019 In contrast, digital adex for 2023E CWC may likely grow at least 70% more than the prior editions led by: 1) favorable timings (viewers may watch the first half of the match on OTT), 2) CWC will be available free for all mobile users on Disney+ Hotstar app and 3) better growth in digital advertising versus traditional media. CWC 2023 may see a similar growth as in digital ad spends during the Indian Premier League (IPL) in 2023. While the absolute value of digital advertising may not be as high as TV advertising, the growth rate may be higher. Cricket has gained popularity on digital platforms, and lower advertising prices on digital channels have allowed many brands to participate. In 2019 CWC, digital advertising-led revenue ranged within INR 4,000-INR 5,000mn. Asia Cup may generate TV adex within INR 3,000-INR 4,000mn. Exhibit 1: CWC digital adex to see 21% CAGR in CY19-23E Source: Company, Elara Securities Estimate Consumption boost during CWC Sales/volume growth higher in CWC quarter Consumer Discretionary, especially Food & Beverages and Alcobev, has seen a correlation with the past two CWCs (in 2015/2019). Per our findings, SSSG/volume growth in the CWC quarter surpassed the annual SSSG/volume growth in the past two CWCs. JUBI’s annual SSSG dipped 4.5% YoY in FY15 whereas in the CWC quarter, the SSSG rose 6.6% YoY. In 2019 CWC quarter too, JUBI’s SSSG was much higher at 4.5% YoY versus an annual average SSSG of 1.7% YoY in FY20. For Alcobev, the delta was visible (on high ‘on-premise’ growth) more for beer – UBBL’s annual volume pared 4.2% YoY in FY20 but volume grew 5.6% YoY in CWC quarter. 9 4.5 11.5 9.5 0 2 4 6 8 10 12 14 TV Digital (INR bn) ICC World Cup ad spends split between TV and digital CY19 CY23E CAGR of 6% CAGR of 21% Exhibit 2: JUBI – SSSG during CWC quarter in 2015/2019 higher than respective annual SSSGs CWC edition Event date Location Time zone favorable to Indians? JUBI UBBL UNSP SSSG YoY during CWC quarter- Annual SSSG YoY Volume growth YoY during CWC quarter- Annual volume growth YoY P&A Volume growth YoY during CWC quarter Annual P&A volume growth YoY 2011 Feb 2011-April 2011 India, Sri Lanka and Bangladesh Yes 33.2 37.4 - - - - 2015 Feb 2015-March 2015 Australia & New Zealand No 6.6 (4.5) 2 9 7.4 7.8 2019 May 2019-July 2019 England Yes 4.5 1.7 5.6 (4.2) 10.6 10.2 Source: Company, Elara Securities Research
  • 4. Consumer Discretionary 4 Elara Securities (India) Private Limited Adex in India Expect ~8-9% growth in CY23E including CWC As regards the overall advertising space, H1CY23 witnessed a modest growth of 2.5-3.5% YoY. Ad revenue for Zee/Sun TV declined in H1, while Viacom saw a sharp growth even after excluding the impact of the IPL. Overall, traditional TV broadcasters faced challenges and TV advertising demand has been relatively soft. Within the digital advertising landscape, investments have become fragmented, given substantial allocations to performance marketing, retail media and e-commerce, among others. Google faced increased competition from other forms of digital advertising. Going ahead over the medium term, normalized growth rate in digital advertising may be ~15- 20%, while TV may see more modest growth of 2-4%. The overall growth rate for the advertising industry in CY23E may be ~8-9% including positive impact of the World Cup (~2%). Fintech and service tech sectors may also see a revival. Exhibit 3: India – Total adex may grow 9% in CY23E Source: Pitch Madison, Elara Securities Estimate Exhibit 3: India – TV adex may grow 6% (including CWC) in CY23E Source: Pitch Madison, Elara Securities Estimate Exhibit 3: India – Digital adex may grow 17.5% in CY23E Source: Pitch Madison, Elara Securities Estimate Exhibit 4: Digital adex contribution up to 38% in CY22 from 18% in CY17 Source: Pitch Madison, Elara Securities Research 7.4 14.6 11.0 (19.9) 37.1 21.0 4.0 14.0 16.1 9.0 (30) (20) (10) 0 10 20 30 40 CY17 CY18 CY19 CY20 CY21 CY22 H1CY23 H2CY23 CY23 (Madison Estimate) CY23E (Revised) (%) India: Total adex growth (YoY) 4.3 19.2 7.9 (11.0) 25.1 8.9 9.3 6.0 (20) (10) 0 10 20 30 CY17 CY18 CY19 CY20 CY21 CY22 CY23 (Madison Estimate) CY23E (Revised) (%) India: TV adex growth (YoY) 27.2 25.8 32.1 9.7 49.9 35.3 25.0 17.5 0 10 20 30 40 50 60 CY17 CY18 CY19 CY20 CY21 CY22 CY23 (Madison Estimate) CY23E (Revised) (%) India: Digtal adex growth (YoY) 37 38 37 42 38 34 35 32 30 22 22 21 18 19 23 31 34 38 4 4 3 2 2 2 6 6 5 2 3 4 1 1 2 0 0 1 0% 20% 40% 60% 80% 100% CY17 CY18 CY19 CY20 CY21 CY22 Vertical-wise contribution to overall ad spend in India TV Print Digital Radio OOH Cinema (Only onscreen Ad)
  • 5. Consumer Discretionary Consumer Discretionary 5 Elara Securities (India) Private Limited Rise in FMCG ad spend boosting overall industry adex FMCG seems to be an exception to the trend of declining advertising expenditures. Through H1FY23, advertising and promotion (A&P) expenses of publicly-listed FMCG companies have, on an average, increased 11% YoY. Profitability in the FMCG sector has primarily been led by price hikes and a stabilization of inflation. Thus, FMCG companies have allocated a significant portion of profits in adex to boost volumes. This rise in advertising spending by FMCG companies has provided a welcome boost to the advertising industry. This trend is anticipated to persist in the next six months, with FMCG advertisers being the primary consumers of the larger advertising volumes available in the market. Exhibit 4: FMCG companies have increased their A&P spends in Q1FY24 Source: Company, Elara Securities Research Decrease in viewership time hitting show ratings In the general entertainment channel (GEC) space, the ratings of impact shows have consistently declined, primarily because the amount of time viewers spend on TV has dropped. CY23 YTD CMGR (compounded monthly growth rate) of GEC (Urban + Rural) impressions has been flat. This has created a challenging cost-versus-return equation, as the investment required to produce these shows is significantly higher than the potential returns. However, some shows such as Kaun Banega Crorepati (KBC) have been able to secure advertising sales worth >INR 4,000mn, this season. Shows such as the Indian Idol and KBC may continue to perform well, but other programs may face challenges due to low ratings. Currently, the industry is focused on driving volume growth. And the yield growth in non-fiction programming may drop 8-9% compared with pre-COVID level. Marquee properties in the non-fiction genre are also experiencing lower yields versus pre-COVID period. In certain genres such as GECs, the supply of advertising gross rating points (GRP) has decreased as the time spent by the viewers on TV has dropped consistently. Despite the fact that there are currently 210mn households with TV connections, the key factor is real viewership versus TV availability at home. While the number of TV connections has increased, the viewership time spent on TV has pared. Exhibit 4: CY23 YTD CMGR of GEC (Urban + Rural) impressions has been flat Source: BARC, Elara Securities Research FMCG bridging the void created by start-ups The advertising GRP available in the market is not distributed evenly. Some shows experience exceptionally high demand, while others face very low demand. Consequently, for specific shows, advertising yields may be on the rise, but overall, the yields across the industry are decreasing. The drop in the yields in fictional programming is lower, and yields are actually increasing for the top-performing fictional shows. Overall, the yields are down by ~2-3% compared with pre-COVID levels. Interestingly, the void left by large venture capital-funded advertisers is being bridged by FMCG companies. The advertising inventory is being filled, but it is not at the same value as before, reflecting the evolving dynamics of the advertising market. The FMCG sector is expected to continue investing in GECs. Thus, a crucial monitorable is how cricket events impact non-fiction programming (KBC and Indian Idol). Viacom may gain market share from existing plays in regional markets Television penetration varies significantly across different regions of India. In states such as Tamil Nadu (TN) and Andhra Pradesh, TV penetration is quite high, reaching ~97-98%. In contrast, TV penetration is notably lower in regions such as Jharkhand. Pricing in the southern markets has seen a modest single-digit inflation, and demand is strong in such areas. 9.5 7.8 5.6 17.6 9.9 8.6 6.5 18.4 0 4 8 12 16 20 Hindustan Unilever Marico Dabur Emami (%) A&P spends as % of revenue Q1FY23 Q1FY24 -23 -13 -10 -9 -6 -3 -3 -4 2 -2 10 6 2 5 3 (30) (25) (20) (15) (10) (5) 0 5 10 15 0 5,000 10,000 15,000 20,000 25,000 30,000 35,000 40,000 45,000 50,000 June-22 July-22 August-22 September-22 October-22 November-22 December-22 January-23 February-23 March-23 April-23 May-23 June-23 July-23 August-23 (%) (AMA '000) GEC (Urban + Rural) impressions Average AMA' 000 Average AMA YoY growth
  • 6. Consumer Discretionary 6 Elara Securities (India) Private Limited Marathi and Bangla markets are also considered interesting and have unique dynamics. The Bangla market, in particular, has become a duopoly, with Star and Zee dominating. Other channels in this region have struggled, and the aggregate GRPs of all the other channels have decreased. West Bengal is a crucial market for many mass-market advertisers, which often have no alternatives but to work with these two dominant players. A similar situation exists in the Marathi market. In the southern markets, unlike in the Hindi-speaking markets (HSM), Star India has a significant impact on non-fiction content. Disney+ has shown consistent viewership and ratings. Zee has a strong presence in South India and West Bengal. And Sun TV is powerful in Tamil Nadu but not as much in Andhra Pradesh and Karnataka. Viacom operates channels in regional languages such as Kannada, Tamil, and Bangla. The addition of Kevin Vaz from Star India to Viacom is expected to bring new strategies and focus to these regional markets, potentially allowing Viacom to gain market share from existing players. Yields in FTA channels lower but demand robust The demand for free-to-air (FTA) channels continues to be robust in the television advertising landscape. But it is important to note that yields in FTA channels tend to be lower, and there seems to be a glass ceiling in terms of improving these yields. Most FTA brands are highly mass-market in nature, and their ROI expectations are quite stringent. The FTA market is primarily dominated by Hindi-language channels and represents ~INR 10,000mn in terms of market size. Within the overall TV advertising expenditure, ~65% is allocated to Hindi-language channels, while regional channels account for ~30% of the TV ad spend. Given the mass- market nature and cost-consciousness of advertisers in the FTA segment, there are limitations on the quantum of rise in advertising yields, in this space. Exhibit 5: FTA adex at INR 10bn in CY22 Source: Pitch Madison, Elara Securities Research Gaming platforms – Approach cautious Gaming platforms are investing in the Asia Cup, although not to the same extent as before, primarily due to concerns around the impact of the Goods and Services Tax (GST). Gaming platforms are adopting a wait-and- watch approach and are expected to have a clearer picture by end-November. The e-commerce advertising market is on track to form a substantial portion, ~12-13%, of the digital adex. Sony Liv focusing on impact shows; Zee5 led by catch- up TV content Sony Liv has adopted an impact sales strategy, focusing on large-scale impact shows and effectively monetizing them. The platform is actively attracting audiences to Connected Television (CTV), and there has been significant improvement in CTV viewership. Sony Liv targets premium audiences on CTVs. In OTT (over-the-top), there is a trend of platforms opening their paywalls, and offering content on a hybrid model. This means that there is a substantial amount of inventory available on OTT platforms for monetization. Additionally, premium OTT content that is not available on traditional TV is also being offered for monetization. Zee5’s strategy is led by catch-up TV content, while Sony Liv emphasizes on original content. FTA Adex, 10 Non FTA Adex, 296 FTA and non FTA adex as of CY22 (INR bn)
  • 7. Consumer Discretionary Consumer Discretionary 7 Elara Securities (India) Private Limited Coverage History Date Rating Target Price Closing Price 1 12-Sept-2023 Buy INR 130 INR 99 Date Rating Target Price Closing Price 9 31-Jan-2022 Accumulate INR 1,750 INR 1,619 10 27-Apr-2022 Accumulate INR 1,850 INR 1,506 11 21-Oct-2022 Reduce INR 1,700 INR 1,642 12 10-Feb-2023 Reduce INR 1,500 INR 1,481 13 5-May-2023 Reduce INR 1,400 INR 1,399 14 31-Jul-2023 Reduce INR 1,510 INR 1,540 Date Rating Target Price Closing Price 8 27-Jan-2022 Buy INR 1,050 INR 842 9 27-Jul-2022 Buy INR 1,000 INR 793 10 25-Jan-2023 Accumulate INR 920 INR 769 11 19-May-2023 Accumulate INR 900 INR 817 12 21-Jul-2023 Reduce INR 1,060 INR 1,039 1 0 20 40 60 80 100 120 Sep-22 Oct-22 Oct-22 Oct-22 Nov-22 Nov-22 Dec-22 Dec-22 Jan-23 Jan-23 Feb-23 Feb-23 Mar-23 Mar-23 Apr-23 Apr-23 May-23 May-23 May-23 Jun-23 Jun-23 Jul-23 Jul-23 Aug-23 Aug-23 Sep-23 Zomato Not Covered Covered 2 3 4 5 6 7 8 9 10 11 12 13 14 700 900 1,100 1,300 1,500 1,700 1,900 Jul-20 Sep-20 Nov-20 Jan-21 Mar-21 May-21 Jul-21 Sep-21 Nov-21 Jan-22 Mar-22 May-22 Jul-22 Sep-22 Nov-22 Jan-23 Mar-23 May-23 Jul-23 Sep-23 United Breweries Not Covered Covered 2 3 4 5 6 7 8 9 10 11 12 350 450 550 650 750 850 950 1,050 1,150 Jul-20 Oct-20 Jan-21 Apr-21 Jul-21 Oct-21 Jan-22 Apr-22 Jul-22 Oct-22 Jan-23 Apr-23 Jul-23 United Spirits Not Covered Covered
  • 8. Consumer Discretionary 8 Elara Securities (India) Private Limited Date Rating Target Price Closing Price 7 2-Feb-2022 Buy INR 4,110 INR 3,302 8 3-Mar-2022 Buy INR 4,000 INR 2,800 19-Apr-2022 Buy INR 800* INR 560* 9 28-Jul-2022 Buy INR 840 INR 565 10 1-Feb-2023 Buy INR 630 INR 456 11 17-May-2023 Buy INR 600 INR 481 12 25-Jul-2023 Accumulate INR 510 INR 477 13 15-Sep-2023 Accumulate INR 560 INR 533 *Stock Split From INR.10/- to INR.2/- Date Rating Target Price Closing Price 6 3-Feb-2022 Accumulate INR 570 INR 497 7 3-Mar-2022 Accumulate INR 540 INR 453 8 29-Jul-2022 Accumulate INR 650 INR 584 9 9-Nov-2022 Accumulate INR 885 INR 781 10 1-Dec-2022 Accumulate INR 850 INR 719 11 9-May-2023 Accumulate INR 815 INR 768 12 27-Jul-2023 Reduce INR 880 INR 898 13 15-Sep-2023 Reduce INR 940 INR 983 1 2 3 4 5 6 7 8 9 10 11 12 13 0 200 400 600 800 1,000 Oct-19 Dec-19 Feb-20 Apr-20 Jun-20 Aug-20 Oct-20 Dec-20 Feb-21 Apr-21 Jun-21 Aug-21 Oct-21 Dec-21 Feb-22 Apr-22 Jun-22 Aug-22 Oct-22 Dec-22 Feb-23 Apr-23 Jun-23 Aug-23 Jubilant FoodWorks Not Covered Covered 1 2 3 4 5 6 7 8 9 10 11 12 13 0 200 400 600 800 1,000 1,200 Oct-19 Dec-19 Feb-20 Apr-20 Jun-20 Aug-20 Oct-20 Dec-20 Feb-21 Apr-21 Jun-21 Aug-21 Oct-21 Dec-21 Feb-22 Apr-22 Jun-22 Aug-22 Oct-22 Dec-22 Feb-23 Apr-23 Jun-23 Aug-23 Westlife Foodworld Not Covered Covered
  • 9. Elara Securities (India) Private Limited Global Markets Research 9 9 Disclosures & Confidentiality for non U.S. Investors The Note is based on our estimates and is being provided to you (herein referred to as the “Recipient”) only for information purposes. The sole purpose of this Note is to provide preliminary information on the business activities of the company and the projected financial statements in order to assist the recipient in understanding / evaluating the Proposal. Nothing in this document should be construed as an advice to buy or sell or solicitation to buy or sell the securities of companies referred to in this document. Each recipient of this document should make such investigations as it deems necessary to arrive at an independent evaluation of an investment in the securities of companies referred to in this document (including the merits and risks involved) and should consult its own advisors to determine the merits and risks of such an investment. Nevertheless, Elara Securities (India) Private Limited or any of its affiliates is committed to provide independent and transparent recommendation to its client and would be happy to provide any information in response to specific client queries. Elara Securities (India) Private Limited or any of its affiliates have not independently verified all the information given in this Note and expressly disclaim all liability for any errors and/or omissions, representations or warranties, expressed or implied as contained in this Note. The user assumes the entire risk of any use made of this information. Elara Securities (India) Private Limited or any of its affiliates, their directors and the employees may from time to time, effect or have effected an own account transaction in or deal as principal or agent in or for the securities mentioned in this document. They may perform or seek to perform investment banking or other services for or solicit investment banking or other business from any company referred to in this Note. Each of these entities functions as a separate, distinct and independent of each other. This Note is strictly confidential and is being furnished to you solely for your information. This Note should not be reproduced or redistributed or passed on directly or indirectly in any form to any other person or published, copied, in whole or in part, for any purpose. This Note is not directed or intended for distribution to, or use by, any person or entity who is a citizen or resident of or located in any locality, state, country or other jurisdiction, where such distribution, publication, availability or use would be contrary to law, regulation or which would subject Elara Securities (India) Private Limited or any of its affiliates to any registration or licensing requirements within such jurisdiction. The distribution of this document in certain jurisdictions may be restricted by law, and persons in whose possession this document comes, should inform themselves about and observe, any such restrictions. Upon request, the Recipient will promptly return all material received from the company and/or the Advisors without retaining any copies thereof. The Information given in this document is as of the date of this report and there can be no assurance that future results or events will be consistent with this information. This Information is subject to change without any prior notice. Elara Securities (India) Private Limited or any of its affiliates reserves the right to make modifications and alterations to this statement as may be required from time to time. However, Elara Securities (India) Private Limited is under no obligation to update or keep the information current. Neither Elara Securities (India) Private Limited nor any of its affiliates, group companies, directors, employees, agents or representatives shall be liable for any damages whether direct, indirect, special or consequential including lost revenue or lost profits that may arise from or in connection with the use of the information. This Note should not be deemed an indication of the state of affairs of the company nor shall it constitute an indication that there has been no change in the business or state of affairs of the company since the date of publication of this Note. The disclosures of interest statements incorporated in this document are provided solely to enhance the transparency and should not be treated as endorsement of the views expressed in the report. Elara Securities (India) Private Limited generally prohibits its analysts, persons reporting to analysts and their family members from maintaining a financial interest in the securities or derivatives of any companies that the analysts cover. The analyst for this report certifies that all of the views expressed in this report accurately reflect his or her personal views about the subject company or companies and its or their securities, and no part of his or her compensation was, is or will be, directly or indirectly related to specific recommendations or views expressed in this report. Any clarifications / queries on the proposal as well as any future communication regarding the proposal should be addressed to Elara Securities (India) Private Limited. It is important to note that any dispute with respect to this research report, would not have access to stock exchange investor redressal forum or arbitration mechanism. Elara Securities (India) Private Limited was incorporated in July 2007 as a subsidiary of Elara Capital (India) Private Limited. Elara Securities (India) Private Limited is a SEBI registered Stock Broker in the Capital Market and Futures & Options Segments of National Stock Exchange of India Limited [NSE], in the Capital Market Segment of BSE Limited [BSE] and a Depository Participant registered with Central Depository Services (India) Limited [CDSL]. Elara Securities (India) Private Limited’s business, amongst other things, is to undertake all associated activities relating to its broking business. The activities of Elara Securities (India) Private Limited were neither suspended nor has it defaulted with any stock exchange authority with whom it is registered in last five years. However, during the routine course of inspection and based on observations, the exchanges have issued advise letters or levied minor penalties on Elara Securities (India) Private Limited for minor operational deviations in certain cases. Elara Securities (India) Private Limited has not been debarred from doing business by any Stock Exchange / SEBI or any other authorities; nor has the certificate of registration been cancelled by SEBI at any point of time. Elara Securities (India) Private Limited offers research services primarily to institutional investors and their employees, directors, fund managers, advisors who are registered or proposed to be registered. Details of Associates of Elara Securities (India) Private Limited are available on group company website www.elaracapital.com Elara Securities (India) Private Limited is maintaining arms-length relationship with its associate entities. Research Analyst or his/her relative(s) may have financial interest in the subject company. Elara Securities (India) Private Limited does not have any financial interest in the subject company, whereas its associate entities may have financial interest. Research Analyst or his/her relative does not have actual/beneficial ownership of 1% or more securities of the subject company at the end of the month immediately preceding the date of publication of Research Report. Elara Securities (India) Private Limited does not have actual/beneficial ownership of 1% or more securities of the subject company at the end of the month immediately preceding the date of publication of Research Report. Associate entities of Elara Securities (India) Private Limited may have actual/beneficial ownership of 1% or more securities of the subject company at the end of the month immediately preceding the date of publication of Research Report. Research Analyst or his/her relative or Elara Securities (India) Private Limited or its associate entities does not have any other material conflict of interest at the time of publication of the Research Report. Research Analyst or his/her relative(s) has not served as an officer, director or employee of the subject company. Research analyst or Elara Securities (India) Private Limited have not received any compensation from the subject company in the past twelve months. Associate entities of Elara Securities (India) Private Limited may have received compensation from the subject company in the past twelve months. Research analyst or Elara Securities (India) Private Limited or its associate entities have not managed or co-managed public offering of securities for the subject company in the past twelve months. Research analyst or Elara Securities (India) Private Limited or its associates have not received any compensation for investment banking or merchant banking or brokerage services from the subject company in the past twelve months. Research analyst or Elara Securities (India) Private Limited or its associate entities may have received any compensation for products or services other than investment banking or merchant banking or brokerage services from the subject company or third party in connection with the Research Report in the past twelve months. Disclaimer & Standard warning Registration granted by SEBI and certification from NISM in no way guarantee performance of the intermediary or provide any assurance of returns to investors. Investment in securities market are subject to market risks. Read all the related documents carefully before investing.
  • 10. Elara Securities (India) Private Limited 10 Disclaimer for non U.S. Investors The information contained in this note is of a general nature and is not intended to address the circumstances of any particular individual or entity. Although we endeavor to provide accurate and timely information, there can be no guarantee that such information is accurate as of the date it is received or that it will continue to be accurate in the future. No one should act on such information without appropriate professional advice after a thorough examination of the particular situation. Disclaimer for U.S. Investors This material is based upon information that we consider to be reliable, but Elara Capital Inc. does not warrant its completeness, accuracy or adequacy and it should not be relied upon as such. This material is not intended as an offer or solicitation for the purchase or sale of any security or other financial instrument. Securities, financial instruments or strategies mentioned herein may not be suitable for all investors. Any opinions expressed herein are given in good faith, are subject to change without notice, and are only correct as of the stated date of their issue. Prices, values or income from any securities or investments mentioned in this report may fall against the interests of the investor and the investor may get back less than the amount invested. Where an investment is described as being likely to yield income, please note that the amount of income that the investor will receive from such an investment may fluctuate. Where an investment or security is denominated in a different currency to the investor’s currency of reference, changes in rates of exchange may have an adverse effect on the value, price or income of or from that investment to the investor. The information contained in this report does not constitute advice on the tax consequences of making any particular investment decision. This material does not take into account your particular investment objectives, financial situations or needs and is not intended as a recommendation of particular securities, financial instruments or strategies to you. Before acting on any recommendation in this material, you should consider whether it is suitable for your particular circumstances and, if necessary, seek professional advice. Certain statements in this report, including any financial projections, may constitute “forward-looking statements.” These “forward-looking statements” are not guarantees of future performance and are based on numerous current assumptions that are subject to significant uncertainties and contingencies. Actual future performance could differ materially from these “forward-looking statements” and financial information.
  • 11. Elara Securities (India) Private Limited Global Markets Research 11 11 India Elara Securities (India) Pvt. Ltd. One International Center, Tower 3, 21st Floor, Senapati Bapat Marg, Elphinstone Road (West) Mumbai – 400 013, India Tel : +91 22 6164 8500 Europe Elara Capital Plc. 6th Floor, The Grove, 248A Marylebone Road, London, NW1 6JZ, United Kingdom Tel : +44 20 7486 9733 USA Elara Securities Inc. 230 Park Avenue, Suite 2415, New York, NY 10169, USA Tel: +1 212 430 5870 Fax: +1 212 208 2501 Asia / Pacific Elara Capital (Asia) Pte.Ltd. One Marina Boulevard, Level 20, Singapore 018989 Tel : +65 6978 4047 Harendra Kumar Managing Director harendra.kumar@elaracapital.com +91 22 6164 8571 Sales Ashok Agarwal India ashok.agarwal@elaracapital.com +91 22 6164 8558 Hitesh Danak India hitesh.danak@elaracapital.com +91 22 6164 8543 Karan Rathod India karan.rathod@elaracapital.com +91 22 6164 8570 Lekha Nahar India lekha.nahar@elaracapital.com +91 22 6164 8512 Prashin Lalvani India prashin.lalvani@elaracapital.com +91 22 6164 8544 Shraddha Shrikhande India shraddha.shrikhande@elaracapital.com +91 22 6164 8567 Sudhanshu Rajpal India sudhanshu.rajpal@elaracapital.com +91 22 6164 8508 Joshua Saldanha Asia joshua.saldanha@elaracapital.com +91 22 6164 8541 Anita Nazareth Corporate Access, Conference & Events anita.nazareth@elaracapital.com +91 22 6164 8520 Tina D’souza Corporate Access tina.dsouza@elaracapital.com +91 22 6164 8595 Quantitative, Alternatives, Sales Trading & Dealing Sunil Jain Quantitative & Alternates sunil.jain@elaracapital.com +91 22 6164 8531 Nandish Patel Quantitative & Alternates nandish.patel@elaracapital.com +91 22 6164 8564 Biren Mehta Head - Sales Trading biren.mehta@elaracapital.com +91 22 6164 8500 Kalpesh Parekh India kalpesh.parekh@ElaraCapital.com +91 22 6164 8555 Manoj Murarka India manoj.murarka@elaracapital.com +91 22 6164 8551 Anil Pawar India anil.pawar@elaracapital.com +91 22 6164 8552 Nilesh Chheda India nilesh.chheda@elaracapital.com +91 22 6164 8554 Nupur Barve India nupur.barve@elaracapital.com +91 22 6164 8532 Research Dr Bino Pathiparampil Head of Research Healthcare, Pharmaceuticals, Strategy bino.pathiparampil@elaracapital.com +91 22 6164 8689 Amit Purohit Analyst Dairy, FMCG, Paints amit.purohit@elaracapital.com +91 22 6164 8594 Ankita Shah Analyst Infrastructure, Ports & Logistics, Industrials ankita.shah@elaracapital.com +91 22 6164 8516 Biju Samuel Analyst Quantitative & Alternate Strategy biju.samuel@elaracapital.com +91 22 6164 8505 Gagan Dixit Analyst Aviation, Chemicals, Oil & Gas gagan.dixit@elaracapital.com +91 22 6164 8504 Garima Kapoor Economist garima.kapoor@elaracapital.com +91 22 6164 8527 Harshit Kapadia Analyst Capital Goods, Consumer Electronics harshit.kapadia@elaracapital.com +91 22 6164 8542 Jay Kale, CFA Analyst Auto & Auto Ancillaries jay.kale@elaracapital.com +91 22 6164 8507 Karan Taurani Analyst Media & Entertainment, Alcobev, QSR, Internet karan.taurani@elaracapital.com +91 22 6164 8513 Prakhar Agarwal Analyst Banking & Financials prakhar.agarwal@elaracapital.com +91 22 6164 8502 Prashant Biyani Analyst Agrochemicals, Fertilisers, Sugar prashant.biyani@elaracapital.com +91 22 6164 8581 Prerna Jhunjhunwala Analyst Textiles, Retail prerna.jhunjhunwala@elaracapital.com +91 22 6164 8519 Ravi Sodah Analyst Cement, Building Materials, Metals & Mining ravi.sodah@elaracapital.com +91 22 6164 8517 Ruchi Mukhija Analyst IT Services ruchi.mukhija@elaracapital.com +91 22 6164 8583 Rupesh Sankhe Analyst Utilities, Renewables, Capital Goods, Real Estate rupesh.sankhe@elaracapital.com +91 22 6164 8518 Shweta Daptardar Analyst Diversified Financials, Non Lending Financials shweta.daptardar@elaracapital.com +91 22 6164 8559 Reena Shah Jr. Analyst Aviation, Chemicals, Oil & Gas reena.shah@elaracapital.com +91 22 6164 8591 Saurabh Mitra Sr. Associate Cement, Building Materials, Metals & Mining saurabh.mitra@elaracapital.com +91 22 6164 8546 Aditya Jaiswal Associate Strategy aditya.jaiswal@elaracapital.com +91 22 4204 8683 Amogh Deshpande Associate Aviation, Chemicals, Oil & Gas amogh.deshpande@elaracapital.com +91 22 4204 8664 Ash Shah Associate Infrastructure, Ports & Logistics ash.shah@elaracapital.com +91 22 6164 8500 Bhavi Shah Associate Cement, Building Materials, Metals & Mining bhavi.shah@elaracapital.com +91 22 6164 8521 Gaurang Sakare Associate Healthcare, Pharmaceuticals gaurang.sakare@elaracapital.com +91 22 4204 8618 Heet Van Associate Healthcare, Pharmaceuticals heet.van@elaracapital.com +91 22 6164 8545 Himanshu Dhyawala Associate Diversified Financials, Non Lending Financials himanshu.dhyawala@elaracapital.com +91 22 4204 8661 Kartik Solanki Associate Banking & Financials kartik.solanki@elaracapital.com +91 22 4204 8604 Ketul Dalal Associate Auto & Auto Ancillaries ketul.dalal@elaracapital.com +91 22 4204 8693 Keval Shah Associate Strategy keval.shah@elaracapital.com +91 22 4204 8669 Mudit Kabra Associate Capital Goods, Consumer Electronics mudit.kabra@elaracapital.com +91 22 4204 8611 Nemish Sundar Associate Capital Goods, Consumer Electronics nemish.sundar@elaracapital.com +91 22 6164 8500 Nishant Chowhan, CFA Associate Auto & Auto Ancillaries nishant.chowhan@elaracapital.com +91 22 4204 8667 Palak Shah Associate Banking & Financials palak.shah@elaracapital.com +91 22 6164 8500 Ragini Pande Associate Utilities, Renewables ragini.pande@elaracapital.com +91 22 6164 8500 Rohit Harlikar Associate Dairy, FMCG, Paints rohit.harlikar@elaracapital.com +91 22 6164 8562 Rounak Ray Associate Media & Entertainment, Alcobev, QSR, Internet rounak.ray@elaracapital.com +91 22 4204 8684 Seema Nayak Associate IT Services seema.nayak@elaracapital.com +91 22 4204 8687 Shweta Roy Associate Economics shweta.roy@elaracapital.com +91 22 6164 8500 Subhankar Sanyal Associate Economics subhankar.sanyal@elaracapital.com +91 22 4204 8688 Tanvi Tambat Associate Real Estate tanvi.tambat@elaracapital.com +91 22 6164 8537 Vaibhav Chechani Associate IT Services vaibhav.chechani@elaracapital.com +91 22 4204 8682 Vidhi Puj Associate Dairy, FMCG, Paints vidhi.puj@elaracapital.com +91 22 4204 8692 Vinayak Patil Database vinayak.patil@elaracapital.com +91 22 6164 8510 Priyanka Sheth Editor priyanka.sheth@elaracapital.com +91 22 6164 8568 Prakriti Singh Editor prakriti.singh@elaracapital.com +91 22 6164 8500 Gurunath Parab Production gurunath.parab@elaracapital.com +91 22 6164 8515 Jinesh Bhansali Production jinesh.bhansali@elaracapital.com +91 22 6164 8537 Access our reports on Bloomberg: Type RESP ESEC <GO> Also available on Thomson & Reuters Elara Securities (India) Private Limited Registered Office Address: One International Center, Tower 3, 21st Floor, Senapati Bapat Marg, Elphinstone Road (West) Mumbai – 400 013, India Tel : +91 22 6164 8500 CIN: U74992MH2007PTC172297 | SEBI Research Analyst Registration No.: INH000000933 Member of BSE Limited and National Stock Exchange of India Limited | SEBI REGN. NO.: INZ 000 238236 Member of Central Depository Services (India) Limited | SEBI REGN. NO.: IN-DP-370-2018 Investor Grievance Email ID: investor.grievances@elaracapital.com - Tel. +91 22 6164 8509 Compliance Officer: Mr. Anand Rao - Email ID: anand.rao@elaracapial.com - Tel. +91 22 6164 8509