SlideShare a Scribd company logo
1 of 18
Download to read offline
Telecom | Update
Investors are advised to refer through important disclosures made at the last page of the Research Report.
Motilal Oswal research is available on www.motilaloswal.com/Institutional-Equities, Bloomberg, Thomson Reuters, Factset and S&P Capital.
Aliasgar Shakir - Research Analyst (Aliasgar.Shakir@motilaloswal.com)
Research Analyst: Harsh Gokalgandhi (Harsh.Gokalgandhi@motilaloswal.com) | Tanmay Gupta (Tanmay.Gupta@motilaloswal.com)
Digital Media: A blockbuster in the making!
Ernst & Young (EY) released its media industry report for CY22. It highlights the growth
prospects of the industry, with special attention to the well-established digital ecosystem,
which has played a significant role in its advancement. While the traditional TV market has
managed to maintain its position, the rising number of digital subscribers presents
potential risks.
Industry growth to be driven by the new age segment
In CY22, the Indian media and entertainment (M&E) sector grew INR348b (+19.9%
YoY) to INR2.1t (10% above CY19 levels). Simultaneously, the ad market reached
INR1,050b, mainly driven by the digital segment, which rose 30% YoY to INR571b.
Digital ad too grew 30% YoY during the year. Interestingly, digital subscriptions in
the Indian M&E sector have now reached INR72b, although they still represent only
~20% of TV subscriptions. The TV (linear segment) industry declined 2% YoY in CY22
with revenue of INR709b, still below the pre-Covid level of INR787b. The decline was
primarily attributed to lower subscription revenue, although it was partially offset
by a 2% growth in the TV ad market. On the other hand, the print sector recorded a
healthy revival with 10% YoY growth rate. Additionally, the radio market displayed
impressive growth of more than 30% YoY.
Outlook remains cloudy
The M&E sector is likely to grow at 11.5% YoY to reach INR2.34t (USD29.2b) in CY23.
While the TV market is witnessing a challenging environment – with flattish 2.5%
YoY growth to INR727b in CY23E – digital market may grow 18% YoY mainly led by
the ad market. In CY23, the print industry is expected to grow 5% YoY, fueled by
potential contributions from election advertisement. However, the radio market
growth is projected to soften to 5% YoY during the year.
TV market languishing
In CY22, television advertising grew 2% YoY, coming close to its 2019 levels. This
growth can be attributed to an increase in advertising volume. However,
subscription revenue continued to fall for the third consecutive year, reporting a 4%
YoY decline. This decline was primarily caused by a reduction of five million pay TV
households and stagnant consumer-end ARPUs as NTO 3.0 was postponed. Now
with the implementation of NTO, consumer-end ARPUs may grow. Linear viewership
declined 7% from that in CY21, as connected TVs grew to 15m in CY22 from 5m in
CY20. The recovery in revenue is likely to come from improved shares of regional
channels and connected TV, partly offsetting the shift in viewer preference toward
alternate content.
Linear TV households to be stable at 169m, TV penetration to offset
connected TVs
Out of the total 319m households in India, 152m households are yet to own a TV
set. While there are households that consume content on smartphones; typically,
10m new Indian households are likely to view television, offsetting the impact of
connected TVs.
Sector Update | 19 July 2023
Media
Motilal Oswal values your support in
the Asiamoney Brokers Poll 2023 for
India Research, Sales, Corporate
Access and Trading team.
We request your ballot.
Overall industry to grow 10.5%
CAGR over CY22-25
Source: MOFSL, Company
Digital to contribute the highest
growth for CY22-25 (INR b)
Source: MOFSL, Company
19 July 2023 2
Media | Update
Digital growth prospects remain robust
Digital advertising grew 30% YoY to reach INR499b in CY22. This accounted for 48%
of total advertising revenue, indicating its continued gain in market share from
traditional advertising channels. Its share in overall ad revenue has improved
significantly to ~50% in CY22 from 32% in CY19. This surpassed TV’s contribution,
which stood at 30% during the year.
Digital subscription now at >60% of TV subscription market
Digital subscription grew 28% YoY to reach INR72b in CY22 as it clocked 99m paid
video subscriptions across almost 45m Indian households. These subscriptions
generated a revenue of INR68b, which accounted for over 60% of broadcasters’
share of TV subscription revenue. Paid video subscriptions are expected to increase
to 114m across 52m households by CY25, as the segment is likely to gain greater
acceptance with the availability of a strong content library.
Filmed revenue to remain a mixed bag as theatricals continue to linger
 The segment grew 85% YoY in CY22; however, it remained at 90% of its CY19
levels. Theatrical revenue reached INR100b as theatres reopened and 1,600+
films were released in CY22.
 The segment is witnessing a possible structural shift, following the pandemic,
driven by changing consumer preferences. This is evident from the increased
share of OTT platforms, which has risen to 20% in CY22 from 10% in CY19. The
current performance of theatrical releases and cinema occupancies remains
below pre-pandemic levels. Further, it has also adversely impacted broadcasting
rights, given the higher exposure to digital releases. The segment is likely to
grow 10% over CY22-25, driven by an increased share of digital platforms in the
overall industry. Further, regional movies are likely to play a key role in driving
footfalls and revenue collection for theatrical releases.
Industry continues to face a challenging environment
 The industry is facing continued headwind in the form of slower recovery in ad
spends, adversely impacted by inflationary pressure, lower subscriptions, and
changing customer preferences.
 Zee: While the merged entity currently trades at an attractive valuation of 4.9x
EV/EBITDA on an FY24 basis, we believe that any certainty around timelines of
the merger process would lead to a stock re-rating. Pending NCLT order toward
the merger proceedings and the impact of SEBI orders on promoters would
remain the key monitorables.
 PVR: The stock is trading at a P/E and EV/EBITDA of 21.5x and 9.6x on FY25E
basis, respectively, given its weak performance in the recent past. This could be
attributed to lower occupancies, which could be a result of weak content and
growing prominence of OTTs in the recent past. Recovery in occupancy levels
remains the main driver of incremental upside.
Improved share of digital
segment within ad revenues
Source: MOFSL, Company
Digital segment reporting strong
growth (INR b)
Source: MOFSL, Company
19 July 2023 3
Media | Update
Overall industry growing in low double digits
Continuing on its growth trajectory, the Indian M&E sector reported a healthy
growth of 19.9% YoY by INR348b to reach INR2.1t in CY22. This was 10% above its
pre-pandemic levels of CY19. The growth was largely led by the digital segment,
which grew 30% YoY, while TV, the largest division witnessed a decline of 2% YoY.
The sector further witnessed a resurgence in filmed entertainment, led by higher
theatrical releases (1,600 films in CY22) and grew 85% YoY with theatrical revenue
surpassing INR100b. The industry is expected to register a CAGR of 10.5% over CY22-
25, led by growth in the digital segment, followed by online gaming to INR2.8t.
Exhibit 1: Overall industry to register a CAGR of 10.5% over CY22-25…
Source: FICCI-EY Media report
Exhibit 2: …primarily backed by the Digital segment (INR b)
Source: FICCI-EY Media report
New age segments such as online gaming and digital media reported robust growth,
due to which the share of traditional media (television, print, filmed entertainment,
OOH, music, radio) declined to 58% of the M&E sector in CY22, from 71% in 2019.
1,476
1,675
1,910
1,477
1,750
2,098
2,339
2,832
2017
2018
2019
2020
2021
2022
2023E
2025E
Overall Industry Size (INR b)
734
96
87
83
61
56 29 16 11 5
291
Digital
Online
Gaming
Relevision
Animation
&
VFX
Live
events
Films
Print
OOH
Music
Radio
M&E
Sector
19 July 2023 4
Media | Update
Exhibit 3: Digital and Online gaining share, while TV witnessing YoY decline (INR b)
2018 2019 2020 2021 2022 22 v/s 21
TV Industry (INR b) 740 787 685 720 709 -2%
Print 306 296 190 227 250 10%
Filmed entertainment 175 191 72 93 172 85%
Digital Market (INR b) 169 308 326 439 571 30%
Animation and VFX 79 95 53 83 107 29%
Live events 75 83 27 32 73 128%
Online Gaming 49 65 79 101 135 34%
Out of Home Media 37 39 16 20 37 85%
Radio 31 31 14 16 21 31%
Music 14 15 15 19 22 16%
Overall Industry Size (INR b) 1675 1910 1477 1750 2098
Source: FICCI-EY Media report
Segment-wise, ad revenue witnessed an overall growth fueled by 30% YoY growth in
digital ads, reaching INR499b (48% share). In CY22, television advertising grew 2%,
coming close to its CY19 levels. This growth can be attributed to an increase in
advertising volume.
However, subscription revenue continued to fall for the third consecutive year,
experiencing a 4% decline. This decline was primarily caused by a reduction of five
million pay TV households and stagnant consumer-end ARPUs. While linear
viewership declined 7% over 2021, 8m to 10m smart TVs connected to the internet
each day, up from ~5m in 2021. Digital subscription grew 27% to reach INR72b as
99m paid video subscriptions across almost 45m Indian households generated
INR68b. Print subscription revenue grew 5% YoY, aided by rising cover prices; it has
stabilized at 15% to 20% below the pre-Covid levels.
19 July 2023 5
Media | Update
TV market stagnant, likely to see soft growth in the
near term
In CY22, the television segment’s revenue declined 2% YoY to reach INR709b. This
decline can be attributed primarily to a reduction in subscription revenue. The
segment observed a decrease in pay-tv homes by 5m during this period. However,
the ARPU remained unchanged. Viewership too dropped 7% YoY due to a fall in both
Hindi and regional language viewership.
Exhibit 4: TV industry down 2% YoY in CY22 (INR b)
Source: FICCI-EY Media report
Exhibit 5: TV viewership across segments declines (impressions in b)
Source: FICCI-EY Media report
Exhibit 6: Pay-tv subscribers witness a decline, while connected TV subscribers grow
(household subscribers in m)
Source: FICCI-EY Media report
305 320 251 313 318
435 468
434
407 392
740
787
685
720
709
2018 2019 2020 2021 2022
Advertising Subscription Total
1,604 1,614
1,731
1,591
1,474
1,010 1,007 1,087
979 925
594 608 643 612 548
2018 2019 2020 2021 2022
Universe HSM South
131 125 120 116
40 43 45 50
5 10 15
40
2020 2021 2022 2025E
Pay TV Free TV Connected TV
19 July 2023 6
Media | Update
TV ad revenue too witnessed a modest growth of merely 2%, on account of retrieval
by four large broadcast networks of content from DD Free Dish in CY22. This growth
was mainly led by improved volumes as ad-rates remained fairly flat. On an exit
basis, 4QFY22 witnessed a 4% YoY decline in ad revenue, primarily due to the
Russia-Ukraine conflict and the looming threat of recession in developed markets.
Despite major events such as FIFA World Cup 2022, ICC Men’s T20 World Cup, and
Gujarat state elections, the overall ad volumes were adversely impacted. E-
commerce contributed more to the incremental growth in ad spending, while the
shares of education and telecom reduced.
Exhibit 7: Ad revenue reports a modest growth of 2% YoY in CY22
Source: FICCI-EY Media report
Exhibit 8: TV ad volumes decline on exit basis in CY22 (daily insertions in ‘000)
Average ad insertions per day; Source: FICCI-EY Media report
 Region-wise split indicated regional channels (816 hours/ channel) received 19%
more ad volumes than national channels (686 hours/ channel) in CY22. Industry
data indicated three of the top five genres, which saw the highest increase in
new advertisers pertained to regional languages. In CY22, the number of
advertisers using Television increased to 9,245 from 8,932 in CY21. Of these,
4,705 used only TV, resulting in an increase in advertiser base for the first time
in three years.
 Going ahead, the segment is likely to report a soft CAGR of 3.9% over CY22-
CY25 to reach INR796b. The softer growth is primarily attributed to:
 Reduction in Pay TV households to 116m in CY25 from 120m currently.
 Proposed ad cap rules by TRAI to limit ad time to 12mins/hr, which is expected
to hit ad revenue. While the matter remains sub-judice, its implementation is
expected to hurt revenue by 10-15%.
 Reduction in overall TV impression by 7% as the TV market continues to face
heavy competition from OTT and other digital platforms.
267
305
320
251
313 318
2017 2018 2019 2020 2021 2022
TV Ad revenue (INR b)
245
224
245
257
244
242
244
247
Q1 Q2 Q3 Q4
CY'21 CY'22
19 July 2023 7
Media | Update
Digital market well established
Increased internet penetration to drive demand
The overall digital segment is witnessing a strong growth, on the back of improved
infrastructure. While the number of telecom subscribers remained stable at 1.2b,
the Internet penetration improved 4% to 866m subscriptions in Dec’22. Studies
further indicated that Urban internet subscriptions, which comprise 60% of all
internet subscriptions, grew 4%, while rural internet subscriptions grew 5% in 2022.
The average monthly mobile data usage per smartphone at 25GB per month in CY22
is set to register a CAGR of 14% to reach 54GB by 2028. This would be mainly led by
increased consumption of online video because of improved share of regional
content along with increased original content hours (3,000 hours; +19% YoY).
Exhibit 9: Internet penetration improves 6% YoY to 866m in Dec’22 (Subs in m)
Source: FICCI-EY Media report
Exhibit 10: Digital players ramping up original content rollout
Source: FICCI-EY Media report
Digital ad revenue rises 30% YoY
Digital advertising grew 30% YoY to reach INR499b in CY22, contributing to ~50% of
overall ad spends in CY22 (from 31% in CY19). Studies indicate that ~600k to 800k
SME and long tail advertisers spent INR180b on digital media, primarily on
performance advertising on Google, Facebook, and e-commerce platforms. Of the
total, new gen segments such as e-commerce platforms increased their spends to
over INR70b, crossing 14% of total digital advertising. FMCG and e-commerce
together constituted ~50% of the ad revenue on the digital platform.
482 496 516
313 333 350
Dec'20 Dec'21 Dec'22
Urban Rural
2,033
1,187
2,512
3,000
2019 2020 2021 2022
Original OTT content produced (Hrs)
19 July 2023 8
Media | Update
Exhibit 11: Overall ad revenue growth led by Digital segment (INR b)
Source: MOFSL, FICCI EY media report
Exhibit 12: Share of Digital ad revenue improves to 48% of overall ad revenue in CY22
Source: MOFSL, FICCI EY media report
Subscription revenue picks up, led by improved acceptability
Digital subscription grew 27% to reach INR72b, which was mainly on the back of
growth in video subscription revenue. It grew 27% in CY22 to INR68b, on the back of
improved acceptability, as paid video subscriptions reached 99m in CY22, across
~45m households in India, with a total viewership of around 135-180m users.
Improved internet penetration and acceptability of digital content is further evident
from the fact that audio subscription witnessed a growth of 37% with the number of
consumers reaching 4.6m. A shift from print to digital news consumption induced by
the pandemic is further seen to continue as news subscription revenue touched
~INR1.2b in CY22.
Exhibit 13: Digital subscription revenue continues to report strong growth…
Source: MOFSL, FICCI EY media report
320 251 313 318
206
122
151 170
279
282
383 499
39
16
20
37
31
14
16
21
8
2
1
5
2019 2020 2021 2022
TV Ad revenue (INR b) Print Digital* OOH Radio Cinema
43% 48% 50%
35% 30% 28%
17% 16% 15%
4% 6% 6%
2021 2022 2023E
Digital TV Print Others
14
29
43
56
72
2018 2019 2020 2021 2022
Digital Subscription (INR b)
19 July 2023 9
Media | Update
Exhibit 14: ….backed by healthy growth in household subscribers
Source: MOFSL, FICCI EY media report
Exhibit 15: Next leg of growth in subscription to be driven by the digital segment:
2022
2025E
Source: MOFSL, FICCI EY media report
63
80
99
114
31
40 45
52
2020 2021 2022 2025E
Paid subscriptions (mn) Subscribing households (mn)
TV 1st + free
consumers
Digital only v/s
mixed
Total Indian
households
319m
TV+Digital
165m
Digital 1st
(SVOD+PayTV)
43m
TV 1st
(AVOD+PayTV)
77m
Free
Consumers
(AVOD+FTA)
45m
Digital Only
2m
TV 1st + free
consumers
Digital only vs.
mixed
Total Indian
households
328m
TV+Digital
166-169m
Digital 1st
(SVOD+PayTV)
42m
TV 1st
(AVOD+PayTV)
74-77m
Free
Consumers
(AVOD+FTA)
50m
Digital Only
10m
19 July 2023 10
Media | Update
Digital segment to be at the forefront of growth
The digital segment is expected to register a CAGR of 15% over CY22-25 to reach
INR862b. Within this, the digital advertising is expected to outpace the overall
growth by registering a CAGR of 15% and gaining market share. It has reached 48%
of total advertising in CY22, higher than the TV ad market at 30%. This is expected to
further increase to 50% by CY23, and 54% by 2025, driven by SME and e-commerce.
Entertainment OTT platforms, including sports, are expected to generate around
INR60b of advertising revenue by CY25. Paid video subscriptions are anticipated to
increase to 114m across 52m households if the current pricing remains stable. This
could further exceed 100m households if annual pricing is reduced to ~INR1,000 for
3-4 services. The digital subscription segment is likely to register an 10% CAGR over
CY22-CY25, which will be aided by improved acceptability of digital content. India
offers one of the most affordable data charges globally (USD0.17 per GB v/s USD5.6
in the US and USD3.9 in Japan).
Exhibit 16: Digital segment to register a 15% CAGR over CY22-25 (INR b)
Source: MOFSL, FICCI EY media report
Filmed entertainment yet to reach pre-Covid levels
Pandemic-induced impact
The film industry has faced significant challenges during the pandemic, experiencing
the most severe impact among various sectors. With restrictions on public
movement and cinema closures lasting for almost two years, the industry has
struggled to recover to pre-pandemic levels. As per “UFO moviez” estimates, overall
screen counts as on Dec22 stood at 9,382, which is ~2% lower than pre-pandemic
levels. On an aggregate basis, domestic theatrical has seen improvement to reach
INR105b in CY22 (INR115 in CY119). This has mainly been driven by a higher number
of releases and ATP improvement. Overseas BO collection witnessed a decline due
to lower number of releases (16 movies vs. 27 movies in 2019). The introduction of
OTT release has further impacted the broadcasting rights and viewership as films
were released on television after their theatrical and digital releases, as a result its
share in revenue declined from 12% in CY19 to merely 6% in CY22.
383
499 594
765
56
72
77
97
439
571
671
862
2021 2022 2023E 2025E
Digital Advertising Digital Subscription Total Revenues
19 July 2023 11
Media | Update
Exhibit 17: Industry-level footfalls continue to remain sluggish; ATP improves
Source: MOFSL, FICCI EY media report
Exhibit 18: Improved digital share driving filmed entertainment market growth (INR b)
Source: MOFSL, FICCI EY media report
Segment witnessing a resurgence post-pandemic
After being severely impacted by the pandemic, the segment witnessed higher
release of domestic films in CY22, which helped improve domestic theatrical
revenue. This however remained below pre-Covid levels due to lower occupancies.
According to industry discussions, frequent cinema goers have reduced their visits
from 2-4 times a month to just once a month, while infrequent visitors (a few times
a year) have also decreased. Despite this, box office revenue surpassed the INR100b
mark, primarily driven by strong performance of cinemas in South India (50% share)
and improved ticket prices. However, Bollywood movies continue to struggle in
terms of performance. The industry has seen a significant increase in the number of
releases this year across various languages, with a total of 1,623 movies hitting the
screens. This represents a 9% increase compared to the levels seen in 2019. The
resumption of eight-week exclusivity window and opening up of theatres have
resulted in a decline in the premium paid by OTT platforms to acquire content. As a
result, the number of direct releases on OTT platforms witnessed a decline in CY22.
However, the dominant position of these OTT players and their constant efforts to
acquire content to expand their subscription base continues to pose threat to the
traditional theatrical release model.
1660 1560 1460 387 418 994
95
104 106
91 87
119
2017 2018 2019 2020 2021 2022
Footfalls (m) ATP (INR)
115
25 39
105
27
3
6
16
22
7
7
10
19
35
40
36
8
2
1
5
10
49
43
21
2019 2020 2021 2022
Domestic Theatricals Overseas Theatricals Broadcast Right
Digital/OTT rights In-Cinema Ads Share of digital (%)
19 July 2023 12
Media | Update
Exhibit 19: Improved share of Southern Cinema in the overall box office collection
supports revenue
Source: MOFSL, FICCI EY media report
Exhibit 20: Gross box office collection (GBOC) for South crossing pre-pandemic levels,
while other segments continue to linger (GBOC in INR b)
Source: MOFSL, FICCI EY media report
Exhibit 21: Improved share of regional movies in top 10 collections
2022 2018
Movie INR b % of total Movie INR b % of total
KGF Chapter 2 10.0 22.5 Sanju 4.4 15.6
RRR 9.0 20.3 Padmaavat 4.0 14.2
Avatar: The Way of Water 4.7 10.5 Simmba 3.0 10.5
Kantara 3.6 8.2 2.0 5.5 19.6
Brahmastra Part One: Shiva 3.2 7.1 Race 3 2.2 7.7
Ponniyin Selvan - Part 1 3.1 7.0 Baaghi 2 2.1 7.5
The Kashmir Files 3.0 6.6 Thugs Of Hindostan 1.9 6.9
Vikram 2.9 6.5 Badhaai Ho 1.8 6.3
Drishyam 2 2.8 6.4 Stree 1.7 5.9
Bhool Bhulaiyaa 2 2.2 4.9 Raazi 1.6 5.6
Total collection 44.5 35.5 28.1 80.4
Share of non-Bollywood 33.4 64.5 5.5 19.6
Source: Sacnilk.com, BoxofficeIndia.com, MOFSL
45% 44% 41% 45% 44%
27% 33%
39% 39% 42% 36% 37%
59% 50%
11% 13% 11% 12% 15% 11% 12%
5% 4% 6% 7% 4% 3% 5%
2015 2016 2017 2018 2019 2020/21 2022
Hindi South Hollywood Others
48
14 15
5 6
16
35
21
17
8 6
12
Hindi Telugu Tamil Kannada Malyalam Hollywood
2019 2022
19 July 2023 13
Media | Update
Change in consumer preference visible
The exposure of OTT during the pandemic-related lockdowns allowed consumers to
binge on content across segments and languages (Indian regional and International
content), which led to a significant shift in content preferences. A deep dive into box
office data further indicated box office collection data for movies rated “<4 IMDB
ratings” witnessed a significant decline in FY22, indicating lower tolerance for sub-
par content. This is substantiated by the recent under performances of Big ticket
movies such as Aamir Khan’s Laal Singh Chadha, Akshay Kumar’s Rakshabandhan,
and Vijay Devarakonda’s Liger. Further, the improved acceptance of regional
content such as Pushpa, RRR, and KGF has indicated that it is only relatable and
escapist content that appeals to the audiences and draws incremental footfall and
not the big stars that work their magic on the big screens. The increasing influence
of digital platforms on box office collections, coupled with significant investments
made by well-funded OTT players, poses a growing threat to the dominant position
of theatres in the film industry.
Exhibit 22: Box office collection for “<4 IMDB-rating” movies plunges in FY22
Source: Sacnilk.com, BoxofficeIndia.com, MOFSL
Exhibit 23: OTT platforms continue to spend aggressively to acquire content
Movie Date Amount (INR b) OTT
Pathaan Apr'23 1.0 Amazon Prime
Tu Jhoothi Main Makkar May'23 0.5 Netflix
Gehraiyaan Feb'22 1.0 Amazon Prime
Atrangi Re Dec'21 0.8 Disney+ Hotstar
Govinda Naam Mera Dec'22 0.6 Disney+ Hotstar
Laal Singh Chadda Oct'22 0.9 Netflix
KGF 2 May'22 3.2 Amazon Prime
Pushpa: The Rise Jan'22 0.3 Amazon Prime
Bhool Bhulaiya 2 Jun'22 0.3 Netflix
Gangubai Kathiyawadi Apr'22 0.7 Netflix
Jhund May'22 0.3 Zee5
Source: MOFSL, media reports
3.85
4.86
0.46
FY18 FY19 FY22
Collection (INR b)
19 July 2023 14
Media | Update
Exhibit 24: Movies with strong star cast see direct OTT release
OTT movies released Date OTT app Starcast
Bloody Daddy Jun'23 Jio Cinemas Shahid Kapoor
Sirf Ek Bandaa Kaafi Hai May'23 Zee5 Manoj Bajpayee
Kanjoos Makhichoos Mar'23 Zee5 Kunal Khemu
Mission Majnu Jan'23 Netflix Siddharth Malhotra
Govinda Naam Mera Dec'22 Disney+ Hotstar Vicky Kaushal, Kiara Advani
Gehraiyaan Feb'22 Amazon Prime Deepika Padukone, Ananya Pandey
Bob Biswas Dec'21 Zee5 Abhishek Bacchan
Atrangi Re Dec'21 Disney+ Hotstar Akshay Kumar, Dhanush
Sardar Udham Singh Oct'21 Amazon Prime Vicky Kaushal
Shershah Aug'21 Amazon Prime Siddharth Malhotra
Bhuj: The Pride of India Aug'21 Disney+ Hotstar Ajay Devgn, Sanjay Dutt
Toofan Jul'21 Amazon Prime Farhan Akhtar, Paresh Rawal
Source: MOFSL, media reports
Improved penetration and revamping of strategy could drive growth:
 While the growth in the theatrical segment post pandemic has mainly been
driven by pricing, the next leg of growth is expected to accrue from improved
penetration. While the current occupancies continue to linger, companies would
now look to expand their presence within the underpenetrated markets of Tier
2 and below cities. However, multiplex and broadcasting partners will have to
find a balance between managing the capex heavy model and at the same time
provide cinema experience at an affordable pricing, which could remain a key
challenge. Broadcast rights are expected to remain muted as they have become
a distant third window after theatrical and digital releases. Digital rights growth
will be volume driven, with a similar number of tent-pole films, but more mid-
budget films. In theatre, ad revenue too will continue to remain dependent on
the occupancies.
 Further, the cinema segment is expected to split into two distinct categories,
each catering to different audience segments with varying price-points. On one
hand, there will be premium “multiplex-type” content that targets an audience
of around 30m to 40m people. This content will likely come with higher ticket
prices. On the hand, there will be less expensive mass content that aims to
attract a larger audience of 100m to 120m people.
19 July 2023 15
Media | Update
Media players continue to see a challenging environment
The segment continues to see headwinds in the form of slower recovery. Ad spends
were negatively impacted by inflationary pressure, lower subscriptions, and
changing customer preferences toward consumption of content.
Zee Entertainment: Merger timelines visibility remains a key
 Continued weakness in ad revenue, adversely impacted by the inflationary
environment, especially in the FMCG segment is expected to pick up from
2HFY24. However, outlook on subscription revenue is expected to see some
visibility with the implementation of NTO 3.0.
 Continued investment in digital content is expected to improve Zee5’s KPIs.
However, it will remain a drag on the profitability, given the digital segment
continues to remain in an investment mode.
 The merged entity with a revenue potential of ~INR190b and EBITDA of INR45b
is trading at a reasonable valuation of 4.9x EV/EBITDA on FY24 basis. However,
any certainty around merger timelines remains a key monitorable.
 The recent ruling by SEBI disqualifying Mr. Puneet Goenka has further prolonged
the merger process and continues to be a crucial factor in its resolution.
Although the NCLT has reserved its order on the merger proceedings, even if the
decision is in favor of the merger, the appointment of new leadership will be
necessary for the merged entity.
PVR: Slower recovery in occupancies to remain a drag
 The slower recovery in occupancies is being witnessed, which remains a drag on
the business. A dry pipeline of movies and lower traction after “Pathaan” have
further added to the concerns.
 Occupancy levels, which stood at ~31% in the pre-Covid period, have now come
to ~25% (merged entity) as on Mar’23 as the overall top-line growth was mainly
driven by improved pricing.
 Continued uncertainty around acceptability of content, slower recovery in
advertising revenue, along with increased risk of rising scale and the traction of
movie releases over OTT platforms will continue to pose headwinds.
 The company is currently trading at an EV/EBITDA and P/E valuation of
9.6x/21.5x on FY25 basis, which we believe is fairly priced, given the uncertainty
around recovery in occupancies.
Investment in securities market are subject to market risks. Read all the related documents carefully before investing
19 July 2023 16
Media | Update
N O T E S
19 July 2023 17
Media | Update
Explanation of Investment Rating
Investment Rating Expected return (over 12-month)
BUY >=15%
SELL < - 10%
NEUTRAL < - 10 % to 15%
UNDER REVIEW Rating may undergo a change
NOT RATED We have forward looking estimates for the stock but we refrain from assigning recommendation
*In case the recommendation given by the Research Analyst is inconsistent with the investment rating legend for a continuous period of 30 days, the Research Analyst shall be
within following 30 days take appropriate measures to make the recommendation consistent with the investment rating legend.
Disclosures
The following Disclosures are being made in compliance with the SEBI Research Analyst Regulations 2014 (herein after referred to as the Regulations).
Motilal Oswal Financial Services Ltd. (MOFSL) is a SEBI Registered Research Analyst having registration no. INH000000412. MOFSL, the Research Entity (RE) as defined in the
Regulations, is engaged in the business of providing Stock broking services, Depository participant services & distribution of various financial products. MOFSL is a listed public
company, the details in respect of which are available on www.motilaloswal.com. MOFSL (erstwhile Motilal Oswal Securities Limited - MOSL) is registered with the Securities &
Exchange Board of India (SEBI) and is a registered Trading Member with National Stock Exchange of India Ltd. (NSE) and Bombay Stock Exchange Limited (BSE), Multi
Commodity Exchange of India Limited (MCX) and National Commodity & Derivatives Exchange Limited (NCDEX) for its stock broking activities & is Depository participant with
Central Depository Services Limited (CDSL) National Securities Depository Limited (NSDL),NERL, COMRIS and CCRL and is member of Association of Mutual Funds of India
(AMFI) for distribution of financial products and Insurance Regulatory & Development Authority of India (IRDA) as Corporate Agent for insurance products. Details of associate
entities of Motilal Oswal Financial Services Limited are available on the website at
http://onlinereports.motilaloswal.com/Dormant/documents/List%20of%20Associate%20companies.pdf
MOFSL and its associate company(ies), their directors and Research Analyst and their relatives may; (a) from time to time, have a long or short position in, act as principal in, and
buy or sell the securities or derivatives thereof of companies mentioned herein. (b) be engaged in any other transaction involving such securities and earn brokerage or other
compensation or act as a market maker in the financial instruments of the company(ies) discussed herein or act as an advisor or lender/borrower to such company(ies) or may have
any other potential conflict of interests with respect to any recommendation and other related information and opinions.; however the same shall have no bearing whatsoever on the
specific recommendations made by the analyst(s), as the recommendations made by the analyst(s) are completely independent of the views of the associates of MOFSL even
though there might exist an inherent conflict of interest in some of the stocks mentioned in the research report.
MOFSL and / or its affiliates do and seek to do business including investment banking with companies covered in its research reports. As a result, the recipients of this report
should be aware that MOFSL may have a potential conflict of interest that may affect the objectivity of this report. Compensation of Research Analysts is not based on any specific
merchant banking, investment banking or brokerage service transactions. Details of pending Enquiry Proceedings of Motilal Oswal Financial Services Limited are available on the
website at https://galaxy.motilaloswal.com/ResearchAnalyst/PublishViewLitigation.aspx
A graph of daily closing prices of securities is available at www.nseindia.com, www.bseindia.com. Research Analyst views on Subject Company may vary based on Fundamental
research and Technical Research. Proprietary trading desk of MOFSL or its associates maintains arm’s length distance with Research Team as all the activities are segregated
from MOFSL research activity and therefore it can have an independent view with regards to Subject Company for which Research Team have expressed their views.
Regional Disclosures (outside India)
This report is not directed or intended for distribution to or use by any person or entity resident in a state, country or any jurisdiction, where such distribution, publication, availability
or use would be contrary to law, regulation or which would subject MOFSL & its group companies to registration or licensing requirements within such jurisdictions.
For Hong Kong:
This report is distributed in Hong Kong by Motilal Oswal capital Markets (Hong Kong) Private Limited, a licensed corporation (CE AYY-301) licensed and regulated by the Hong
Kong Securities and Futures Commission (SFC) pursuant to the Securities and Futures Ordinance (Chapter 571 of the Laws of Hong Kong) “SFO”. As per SEBI (Research Analyst
Regulations) 2014 Motilal Oswal Securities (SEBI Reg. No. INH000000412) has an agreement with Motilal Oswal capital Markets (Hong Kong) Private Limited for distribution of
research report in Hong Kong. This report is intended for distribution only to “Professional Investors” as defined in Part I of Schedule 1 to SFO. Any investment or investment activity
to which this document relates is only available to professional investor and will be engaged only with professional investors.” Nothing here is an offer or solicitation of these
securities, products and services in any jurisdiction where their offer or sale is not qualified or exempt from registration. The Indian Analyst(s) who compile this report is/are not
located in Hong Kong & are not conducting Research Analysis in Hong Kong.
For U.S.
Motilal Oswal Financial Services Limited (MOFSL) is not a registered broker - dealer under the U.S. Securities Exchange Act of 1934, as amended (the"1934 act") and under
applicable state laws in the United States. In addition MOFSL is not a registered investment adviser under the U.S. Investment Advisers Act of 1940, as amended (the "Advisers
Act" and together with the 1934 Act, the "Acts), and under applicable state laws in the United States. Accordingly, in the absence of specific exemption under the Acts, any
brokerage and investment services provided by MOFSL, including the products and services described herein are not available to or intended for U.S. persons. This report is
intended for distribution only to "Major Institutional Investors" as defined by Rule 15a-6(b)(4) of the Exchange Act and interpretations thereof by SEC (henceforth referred to as
"major institutional investors"). This document must not be acted on or relied on by persons who are not major institutional investors. Any investment or investment activity to which
this document relates is only available to major institutional investors and will be engaged in only with major institutional investors. In reliance on the exemption from registration
provided by Rule 15a-6 of the U.S. Securities Exchange Act of 1934, as amended (the "Exchange Act") and interpretations thereof by the U.S. Securities and Exchange
Commission ("SEC") in order to conduct business with Institutional Investors based in the U.S., MOFSL has entered into a chaperoning agreement with a U.S. registered broker-
dealer, Motilal Oswal Securities International Private Limited. ("MOSIPL"). Any business interaction pursuant to this report will have to be executed within the provisions of this
chaperoning agreement.
The Research Analysts contributing to the report may not be registered /qualified as research analyst with FINRA. Such research analyst may not be associated persons of the U.S.
registered broker-dealer, MOSIPL, and therefore, may not be subject to NASD rule 2711 and NYSE Rule 472 restrictions on communication with a subject company, public
appearances and trading securities held by a research analyst account.
For Singapore
In Singapore, this report is being distributed by Motilal Oswal Capital Markets Singapore Pte Ltd (“MOCMSPL”) (Co. Reg. NO. 201129401Z) which is a holder of a capital markets
services license and an exempt financial adviser in Singapore. As per the approved agreement under Paragraph 9 of Third Schedule of Securities and Futures Act (CAP 289) and
Paragraph 11 of First Schedule of Financial Advisors Act (CAP 110) provided to MOCMSPL by Monetary Authority of Singapore. Persons in Singapore should contact MOCMSPL
in respect of any matter arising from, or in connection with this report/publication/communication. This report is distributed solely to persons who qualify as “Institutional Investors”,
of which some of whom may consist of "accredited" institutional investors as defined in section 4A(1) of the Securities and Futures Act, Chapter 289 of Singapore (“the
SFA”). Accordingly, if a Singapore person is not or ceases to be such an institutional investor, such Singapore Person must immediately discontinue any use of this Report and
inform MOCMSPL.
Specific Disclosures
1 MOFSL, Research Analyst and/or his relatives does not have financial interest in the subject company, as they do not have equity holdings in the subject company.
2 MOFSL, Research Analyst and/or his relatives do not have actual/beneficial ownership of 1% or more securities in the subject company
3 MOFSL, Research Analyst and/or his relatives have not received compensation/other benefits from the subject company in the past 12 months
4 MOFSL, Research Analyst and/or his relatives do not have material conflict of interest in the subject company at the time of publication of research report
5 Research Analyst has not served as director/officer/employee in the subject company
6 MOFSL has not acted as a manager or co-manager of public offering of securities of the subject company in past 12 months
7 MOFSL has not received compensation for investment banking/ merchant banking/brokerage services from the subject company in the past 12 months
8 MOFSL has not received compensation for other than investment banking/merchant banking/brokerage services from the subject company in the past 12 months
9 MOFSL has not received any compensation or other benefits from third party in connection with the research report
10 MOFSL has not engaged in market making activity for the subject company
19 July 2023 18
Media | Update
********************************************************************************************************************************
The associates of MOFSL may have:
- financial interest in the subject company
- actual/beneficial ownership of 1% or more securities in the subject company at the end of the month immediately preceding the date of publication of the Research Report or
date of the public appearance.
- received compensation/other benefits from the subject company in the past 12 months
- any other potential conflict of interests with respect to any recommendation and other related information and opinions.; however the same shall have no bearing whatsoever on
the specific recommendations made by the analyst(s), as the recommendations made by the analyst(s) are completely independent of the views of the associates of MOFSL
even though there might exist an inherent conflict of interest in some of the stocks mentioned in the research report.
- acted as a manager or co-manager of public offering of securities of the subject company in past 12 months
- be engaged in any other transaction involving such securities and earn brokerage or other compensation or act as a market maker in the financial instruments of the
company(ies) discussed herein or act as an advisor or lender/borrower to such company(ies)
- received compensation from the subject company in the past 12 months for investment banking / merchant banking / brokerage services or from other than said services.
- Served subject company as its clients during twelve months preceding the date of distribution of the research report.
The associates of MOFSL has not received any compensation or other benefits from third party in connection with the research report
Above disclosures include beneficial holdings lying in demat account of MOFSL which are opened for proprietary investments only. While calculating beneficial holdings, It does not
consider demat accounts which are opened in name of MOFSL for other purposes (i.e holding client securities, collaterals, error trades etc.). MOFSL also earns DP income from
clients which are not considered in above disclosures.
Analyst Certification
The views expressed in this research report accurately reflect the personal views of the analyst(s) about the subject securities or issues, and no part of the compensation of the
research analyst(s) was, is, or will be directly or indirectly related to the specific recommendations and views expressed by research analyst(s) in this report.
Terms & Conditions:
This report has been prepared by MOFSL and is meant for sole use by the recipient and not for circulation. The report and information contained herein is strictly confidential and
may not be altered in any way, transmitted to, copied or distributed, in part or in whole, to any other person or to the media or reproduced in any form, without prior written consent
of MOFSL. The report is based on the facts, figures and information that are considered true, correct, reliable and accurate. The intent of this report is not recommendatory in
nature. The information is obtained from publicly available media or other sources believed to be reliable. Such information has not been independently verified and no guaranty,
representation of warranty, express or implied, is made as to its accuracy, completeness or correctness. All such information and opinions are subject to change without notice. The
report is prepared solely for informational purpose and does not constitute an offer document or solicitation of offer to buy or sell or subscribe for securities or other financial
instruments for the clients. Though disseminated to all the customers simultaneously, not all customers may receive this report at the same time. MOFSL will not treat recipients as
customers by virtue of their receiving this report.
Disclaimer:
The report and information contained herein is strictly confidential and meant solely for the selected recipient and may not be altered in any way, transmitted to, copied or
distributed, in part or in whole, to any other person or to the media or reproduced in any form, without prior written consent. This report and information herein is solely for
informational purpose and may not be used or considered as an offer document or solicitation of offer to buy or sell or subscribe for securities or other financial instruments. Nothing
in this report constitutes investment, legal, accounting and tax advice or a representation that any investment or strategy is suitable or appropriate to your specific circumstances.
The securities discussed and opinions expressed in this report may not be suitable for all investors, who must make their own investment decisions, based on their own investment
objectives, financial positions and needs of specific recipient. This may not be taken in substitution for the exercise of independent judgment by any recipient. Each recipient of this
document should make such investigations as it deems necessary to arrive at an independent evaluation of an investment in the securities of companies referred to in this
document (including the merits and risks involved), and should consult its own advisors to determine the merits and risks of such an investment. The investment discussed or views
expressed may not be suitable for all investors. Certain transactions -including those involving futures, options, another derivative products as well as non-investment grade
securities - involve substantial risk and are not suitable for all investors. No representation or warranty, express or implied, is made as to the accuracy, completeness or fairness of
the information and opinions contained in this document. The Disclosures of Interest Statement incorporated in this document is provided solely to enhance the transparency and
should not be treated as endorsement of the views expressed in the report. This information is subject to change without any prior notice. The Company reserves the right to make
modifications and alternations to this statement as may be required from time to time without any prior approval. MOFSL, its associates, their directors and the employees may from
time to time, effect or have effected an own account transaction in, or deal as principal or agent in or for the securities mentioned in this document. They may perform or seek to
perform investment banking or other services for, or solicit investment banking or other business from, any company referred to in this report. Each of these entities functions as a
separate, distinct and independent of each other. The recipient should take this into account before interpreting the document. This report has been prepared on the basis of
information that is already available in publicly accessible media or developed through analysis of MOFSL. The views expressed are those of the analyst, and the Company may or
may not subscribe to all the views expressed therein. This document is being supplied to you solely for your information and may not be reproduced, redistributed or passed on,
directly or indirectly, to any other person or published, copied, in whole or in part, for any purpose. This report is not directed or intended for distribution to, or use by, any person or
entity who is a citizen or resident of or located in any locality, state, country or other jurisdiction, where such distribution, publication, availability or use would be contrary to law,
regulation or which would subject MOFSL to any registration or licensing requirement within such jurisdiction. The securities described herein may or may not be eligible for sale in
all jurisdictions or to certain category of investors. Persons in whose possession this document may come are required to inform themselves of and to observe such restriction.
Neither the Firm, not its directors, employees, agents or representatives shall be liable for any damages whether direct or indirect, incidental, special or consequential including lost
revenue or lost profits that may arise from or in connection with the use of the information. The person accessing this information specifically agrees to exempt MOFSL or any of its
affiliates or employees from, any and all responsibility/liability arising from such misuse and agrees not to hold MOFSL or any of its affiliates or employees responsible for any such
misuse and further agrees to hold MOFSL or any of its affiliates or employees free and harmless from all losses, costs, damages, expenses that may be suffered by the person
accessing this information due to any errors and delays.
Investment in securities market are subject to market risks. Read all the related documents carefully before investing.
Registration granted by SEBI and certification from NISM in no way guarantee performance of the intermediary or provide any assurance of returns to investors.
Registered Office Address: Motilal Oswal Tower, Rahimtullah Sayani Road, Opposite Parel ST Depot, Prabhadevi, Mumbai-400025; Tel No.: 022 - 71934200 / 71934263;
www.motilaloswal.com. Correspondence Address: Palm Spring Centre, 2nd Floor, Palm Court Complex, New Link Road, Malad (West), Mumbai- 400 064. Tel No: 022 71881000.
Details of Compliance Officer: Neeraj Agarwal, Email Id: na@motilaloswal.com, Contact No.:022-40548085.
Grievance Redressal Cell:
Contact Person Contact No. Email ID
Ms. Hemangi Date 022 40548000 / 022 67490600 query@motilaloswal.com
Ms. Kumud Upadhyay 022 40548082 servicehead@motilaloswal.com
Mr. Ajay Menon 022 40548083 am@motilaloswal.com
Registration details of group entities.: Motilal Oswal Financial Services Ltd. (MOFSL): INZ000158836 (BSE/NSE/MCX/NCDEX); CDSL and NSDL: IN-DP-16-2015; Research
Analyst: INH000000412 . AMFI: ARN .: 146822. IRDA Corporate Agent – CA0579. Motilal Oswal Financial Services Ltd. is a distributor of Mutual Funds, PMS, Fixed Deposit,
Insurance, Bond, NCDs and IPO products.
Customer having any query/feedback/ clarification may write to query@motilaloswal.com. In case of grievances for any of the services rendered by Motilal Oswal Financial Services
Limited (MOFSL) write to grievances@motilaloswal.com, for DP to dpgrievances@motilaloswal.com.

More Related Content

Similar to Digital Media: A Blockbuster in the Making

Media and Entertainment Sector Report - January 2018
Media and Entertainment Sector Report - January 2018Media and Entertainment Sector Report - January 2018
Media and Entertainment Sector Report - January 2018India Brand Equity Foundation
 
Media and Entertainment Sector Report - December 2018
Media and Entertainment Sector Report - December 2018Media and Entertainment Sector Report - December 2018
Media and Entertainment Sector Report - December 2018India Brand Equity Foundation
 
Global Entertainment & Media Outlook 2021-2025: PwC Report
Global Entertainment & Media Outlook 2021-2025: PwC ReportGlobal Entertainment & Media Outlook 2021-2025: PwC Report
Global Entertainment & Media Outlook 2021-2025: PwC ReportSocial Samosa
 
Kpmg report covid 19-the many shades of a crisis (m&amp;e perspective)
Kpmg report covid 19-the many shades of a crisis (m&amp;e perspective)Kpmg report covid 19-the many shades of a crisis (m&amp;e perspective)
Kpmg report covid 19-the many shades of a crisis (m&amp;e perspective)Social Samosa
 
Media and Entertainment Sector Report September 2017
Media and Entertainment Sector Report September 2017Media and Entertainment Sector Report September 2017
Media and Entertainment Sector Report September 2017India Brand Equity Foundation
 
Amazing Growth of Indian Entertainment & Media – The Reel Story | An Aranca I...
Amazing Growth of Indian Entertainment & Media – The Reel Story | An Aranca I...Amazing Growth of Indian Entertainment & Media – The Reel Story | An Aranca I...
Amazing Growth of Indian Entertainment & Media – The Reel Story | An Aranca I...Aranca
 
To study the zeel performance
To study the zeel performance To study the zeel performance
To study the zeel performance Dev Prakash Singh
 

Similar to Digital Media: A Blockbuster in the Making (20)

Media and Entertainment Sector Report - January 2018
Media and Entertainment Sector Report - January 2018Media and Entertainment Sector Report - January 2018
Media and Entertainment Sector Report - January 2018
 
Media and Entertainment Sector Report - December 2018
Media and Entertainment Sector Report - December 2018Media and Entertainment Sector Report - December 2018
Media and Entertainment Sector Report - December 2018
 
Media and Entertainment Sector Report February 2018
Media and Entertainment Sector Report February 2018Media and Entertainment Sector Report February 2018
Media and Entertainment Sector Report February 2018
 
Global Entertainment & Media Outlook 2021-2025: PwC Report
Global Entertainment & Media Outlook 2021-2025: PwC ReportGlobal Entertainment & Media Outlook 2021-2025: PwC Report
Global Entertainment & Media Outlook 2021-2025: PwC Report
 
Media and Entertainment Sector Report June 2018
Media and Entertainment Sector Report June 2018Media and Entertainment Sector Report June 2018
Media and Entertainment Sector Report June 2018
 
Media and Entertainment Sector Report October 2017
Media and Entertainment Sector Report October 2017Media and Entertainment Sector Report October 2017
Media and Entertainment Sector Report October 2017
 
Media and Entertainment Sector Report November 2017
Media and Entertainment Sector Report November 2017Media and Entertainment Sector Report November 2017
Media and Entertainment Sector Report November 2017
 
Media and Entertainment Sector Report November 2017
Media and Entertainment Sector Report November 2017Media and Entertainment Sector Report November 2017
Media and Entertainment Sector Report November 2017
 
Media and Entertainment Sector Report May 2018
Media and Entertainment Sector Report May 2018Media and Entertainment Sector Report May 2018
Media and Entertainment Sector Report May 2018
 
Media and Entertainment Sector Report December 2017
Media and Entertainment Sector Report December 2017Media and Entertainment Sector Report December 2017
Media and Entertainment Sector Report December 2017
 
Kpmg report covid 19-the many shades of a crisis (m&amp;e perspective)
Kpmg report covid 19-the many shades of a crisis (m&amp;e perspective)Kpmg report covid 19-the many shades of a crisis (m&amp;e perspective)
Kpmg report covid 19-the many shades of a crisis (m&amp;e perspective)
 
Media and Entertainment Sector Report September 2017
Media and Entertainment Sector Report September 2017Media and Entertainment Sector Report September 2017
Media and Entertainment Sector Report September 2017
 
Media and Entertainment Sector report - April 2019
Media and Entertainment Sector report - April 2019Media and Entertainment Sector report - April 2019
Media and Entertainment Sector report - April 2019
 
Amazing Growth of Indian Entertainment & Media – The Reel Story | An Aranca I...
Amazing Growth of Indian Entertainment & Media – The Reel Story | An Aranca I...Amazing Growth of Indian Entertainment & Media – The Reel Story | An Aranca I...
Amazing Growth of Indian Entertainment & Media – The Reel Story | An Aranca I...
 
Media and Entertainment Sector Report - August 2018
Media and Entertainment Sector Report - August 2018Media and Entertainment Sector Report - August 2018
Media and Entertainment Sector Report - August 2018
 
Entertainment Sector Reports November-2016
Entertainment Sector Reports November-2016Entertainment Sector Reports November-2016
Entertainment Sector Reports November-2016
 
To study the zeel performance
To study the zeel performance To study the zeel performance
To study the zeel performance
 
Entertainment Sectore Report - October 2016
Entertainment Sectore Report - October 2016Entertainment Sectore Report - October 2016
Entertainment Sectore Report - October 2016
 
Entertainment Sectore Report - October 2016
Entertainment Sectore Report - October 2016Entertainment Sectore Report - October 2016
Entertainment Sectore Report - October 2016
 
Entertainment Sectore Report - December 2016
Entertainment Sectore Report - December 2016Entertainment Sectore Report - December 2016
Entertainment Sectore Report - December 2016
 

More from Social Samosa

TAM Sports_IPL 17 Till Match 37_Celebrity Endorsement _Report.pdf
TAM Sports_IPL 17 Till Match 37_Celebrity Endorsement _Report.pdfTAM Sports_IPL 17 Till Match 37_Celebrity Endorsement _Report.pdf
TAM Sports_IPL 17 Till Match 37_Celebrity Endorsement _Report.pdfSocial Samosa
 
Social Samosa Guidebook for SAMMIES 2024.pdf
Social Samosa Guidebook for SAMMIES 2024.pdfSocial Samosa Guidebook for SAMMIES 2024.pdf
Social Samosa Guidebook for SAMMIES 2024.pdfSocial Samosa
 
Kantar AI Summit- Under Embargo till Wednesday, 24th April 2024, 4 PM, IST.pdf
Kantar AI Summit- Under Embargo till Wednesday, 24th April 2024, 4 PM, IST.pdfKantar AI Summit- Under Embargo till Wednesday, 24th April 2024, 4 PM, IST.pdf
Kantar AI Summit- Under Embargo till Wednesday, 24th April 2024, 4 PM, IST.pdfSocial Samosa
 
TAM AdEx 2023 Cross Media Advertising Recap - Auto Sector
TAM AdEx 2023 Cross Media Advertising Recap - Auto SectorTAM AdEx 2023 Cross Media Advertising Recap - Auto Sector
TAM AdEx 2023 Cross Media Advertising Recap - Auto SectorSocial Samosa
 
TAM Sports IPL 17 Advertising Report- M01 - M23
TAM Sports IPL 17 Advertising Report- M01 - M23TAM Sports IPL 17 Advertising Report- M01 - M23
TAM Sports IPL 17 Advertising Report- M01 - M23Social Samosa
 
TAM Sports-IPL 17 Advertising Report- M01 - M15.xlsx - IPL 17 FCT (Commercial...
TAM Sports-IPL 17 Advertising Report- M01 - M15.xlsx - IPL 17 FCT (Commercial...TAM Sports-IPL 17 Advertising Report- M01 - M15.xlsx - IPL 17 FCT (Commercial...
TAM Sports-IPL 17 Advertising Report- M01 - M15.xlsx - IPL 17 FCT (Commercial...Social Samosa
 
TAM AdEx - 2023 Cross Media Advertising Recap - FMCG Sector.pdf
TAM AdEx - 2023 Cross Media Advertising Recap - FMCG Sector.pdfTAM AdEx - 2023 Cross Media Advertising Recap - FMCG Sector.pdf
TAM AdEx - 2023 Cross Media Advertising Recap - FMCG Sector.pdfSocial Samosa
 
TAM Sports-IPL 17 Advertising Report- M01 - M07.xlsx - IPL 17 FCT (Commercial...
TAM Sports-IPL 17 Advertising Report- M01 - M07.xlsx - IPL 17 FCT (Commercial...TAM Sports-IPL 17 Advertising Report- M01 - M07.xlsx - IPL 17 FCT (Commercial...
TAM Sports-IPL 17 Advertising Report- M01 - M07.xlsx - IPL 17 FCT (Commercial...Social Samosa
 
Media and Internet Preview Q4FY24 Elara C
Media and Internet Preview Q4FY24 Elara CMedia and Internet Preview Q4FY24 Elara C
Media and Internet Preview Q4FY24 Elara CSocial Samosa
 
LinkedIn-Deep-Sales-Playbook-Report-.pdf
LinkedIn-Deep-Sales-Playbook-Report-.pdfLinkedIn-Deep-Sales-Playbook-Report-.pdf
LinkedIn-Deep-Sales-Playbook-Report-.pdfSocial Samosa
 
Brand Trust Report 2024 TRA Report Listings
Brand Trust Report 2024 TRA Report ListingsBrand Trust Report 2024 TRA Report Listings
Brand Trust Report 2024 TRA Report ListingsSocial Samosa
 
TAM AdEx-A Pixelated view into Digital Advertising Trends for Y 2023.pdf
TAM AdEx-A Pixelated view into Digital Advertising Trends for Y 2023.pdfTAM AdEx-A Pixelated view into Digital Advertising Trends for Y 2023.pdf
TAM AdEx-A Pixelated view into Digital Advertising Trends for Y 2023.pdfSocial Samosa
 
Cricket Playbook for Growth Marketers: Adjust x Glance report
Cricket Playbook for Growth Marketers: Adjust x Glance reportCricket Playbook for Growth Marketers: Adjust x Glance report
Cricket Playbook for Growth Marketers: Adjust x Glance reportSocial Samosa
 
TheOrmaxSportsAudienceReport2024-MediaHighlights.pdf
TheOrmaxSportsAudienceReport2024-MediaHighlights.pdfTheOrmaxSportsAudienceReport2024-MediaHighlights.pdf
TheOrmaxSportsAudienceReport2024-MediaHighlights.pdfSocial Samosa
 
Voter engagement - Election iCubesWire Report
Voter engagement - Election iCubesWire ReportVoter engagement - Election iCubesWire Report
Voter engagement - Election iCubesWire ReportSocial Samosa
 
TAM AdEx report - Print Advertising 2023
TAM AdEx report - Print Advertising 2023TAM AdEx report - Print Advertising 2023
TAM AdEx report - Print Advertising 2023Social Samosa
 
D2C Advantage X Toolkit MMA Global & Publicis Commerce
D2C Advantage X Toolkit MMA Global & Publicis CommerceD2C Advantage X Toolkit MMA Global & Publicis Commerce
D2C Advantage X Toolkit MMA Global & Publicis CommerceSocial Samosa
 
Report on the future of Digital Advertising in India
Report on the future of Digital Advertising in IndiaReport on the future of Digital Advertising in India
Report on the future of Digital Advertising in IndiaSocial Samosa
 
Redseer_Ear-It-All_Report Design 2_16022024_final.pdf
Redseer_Ear-It-All_Report Design 2_16022024_final.pdfRedseer_Ear-It-All_Report Design 2_16022024_final.pdf
Redseer_Ear-It-All_Report Design 2_16022024_final.pdfSocial Samosa
 
Advertising in Music Genre 2023 - TAM AdEx
Advertising in Music Genre 2023 - TAM AdExAdvertising in Music Genre 2023 - TAM AdEx
Advertising in Music Genre 2023 - TAM AdExSocial Samosa
 

More from Social Samosa (20)

TAM Sports_IPL 17 Till Match 37_Celebrity Endorsement _Report.pdf
TAM Sports_IPL 17 Till Match 37_Celebrity Endorsement _Report.pdfTAM Sports_IPL 17 Till Match 37_Celebrity Endorsement _Report.pdf
TAM Sports_IPL 17 Till Match 37_Celebrity Endorsement _Report.pdf
 
Social Samosa Guidebook for SAMMIES 2024.pdf
Social Samosa Guidebook for SAMMIES 2024.pdfSocial Samosa Guidebook for SAMMIES 2024.pdf
Social Samosa Guidebook for SAMMIES 2024.pdf
 
Kantar AI Summit- Under Embargo till Wednesday, 24th April 2024, 4 PM, IST.pdf
Kantar AI Summit- Under Embargo till Wednesday, 24th April 2024, 4 PM, IST.pdfKantar AI Summit- Under Embargo till Wednesday, 24th April 2024, 4 PM, IST.pdf
Kantar AI Summit- Under Embargo till Wednesday, 24th April 2024, 4 PM, IST.pdf
 
TAM AdEx 2023 Cross Media Advertising Recap - Auto Sector
TAM AdEx 2023 Cross Media Advertising Recap - Auto SectorTAM AdEx 2023 Cross Media Advertising Recap - Auto Sector
TAM AdEx 2023 Cross Media Advertising Recap - Auto Sector
 
TAM Sports IPL 17 Advertising Report- M01 - M23
TAM Sports IPL 17 Advertising Report- M01 - M23TAM Sports IPL 17 Advertising Report- M01 - M23
TAM Sports IPL 17 Advertising Report- M01 - M23
 
TAM Sports-IPL 17 Advertising Report- M01 - M15.xlsx - IPL 17 FCT (Commercial...
TAM Sports-IPL 17 Advertising Report- M01 - M15.xlsx - IPL 17 FCT (Commercial...TAM Sports-IPL 17 Advertising Report- M01 - M15.xlsx - IPL 17 FCT (Commercial...
TAM Sports-IPL 17 Advertising Report- M01 - M15.xlsx - IPL 17 FCT (Commercial...
 
TAM AdEx - 2023 Cross Media Advertising Recap - FMCG Sector.pdf
TAM AdEx - 2023 Cross Media Advertising Recap - FMCG Sector.pdfTAM AdEx - 2023 Cross Media Advertising Recap - FMCG Sector.pdf
TAM AdEx - 2023 Cross Media Advertising Recap - FMCG Sector.pdf
 
TAM Sports-IPL 17 Advertising Report- M01 - M07.xlsx - IPL 17 FCT (Commercial...
TAM Sports-IPL 17 Advertising Report- M01 - M07.xlsx - IPL 17 FCT (Commercial...TAM Sports-IPL 17 Advertising Report- M01 - M07.xlsx - IPL 17 FCT (Commercial...
TAM Sports-IPL 17 Advertising Report- M01 - M07.xlsx - IPL 17 FCT (Commercial...
 
Media and Internet Preview Q4FY24 Elara C
Media and Internet Preview Q4FY24 Elara CMedia and Internet Preview Q4FY24 Elara C
Media and Internet Preview Q4FY24 Elara C
 
LinkedIn-Deep-Sales-Playbook-Report-.pdf
LinkedIn-Deep-Sales-Playbook-Report-.pdfLinkedIn-Deep-Sales-Playbook-Report-.pdf
LinkedIn-Deep-Sales-Playbook-Report-.pdf
 
Brand Trust Report 2024 TRA Report Listings
Brand Trust Report 2024 TRA Report ListingsBrand Trust Report 2024 TRA Report Listings
Brand Trust Report 2024 TRA Report Listings
 
TAM AdEx-A Pixelated view into Digital Advertising Trends for Y 2023.pdf
TAM AdEx-A Pixelated view into Digital Advertising Trends for Y 2023.pdfTAM AdEx-A Pixelated view into Digital Advertising Trends for Y 2023.pdf
TAM AdEx-A Pixelated view into Digital Advertising Trends for Y 2023.pdf
 
Cricket Playbook for Growth Marketers: Adjust x Glance report
Cricket Playbook for Growth Marketers: Adjust x Glance reportCricket Playbook for Growth Marketers: Adjust x Glance report
Cricket Playbook for Growth Marketers: Adjust x Glance report
 
TheOrmaxSportsAudienceReport2024-MediaHighlights.pdf
TheOrmaxSportsAudienceReport2024-MediaHighlights.pdfTheOrmaxSportsAudienceReport2024-MediaHighlights.pdf
TheOrmaxSportsAudienceReport2024-MediaHighlights.pdf
 
Voter engagement - Election iCubesWire Report
Voter engagement - Election iCubesWire ReportVoter engagement - Election iCubesWire Report
Voter engagement - Election iCubesWire Report
 
TAM AdEx report - Print Advertising 2023
TAM AdEx report - Print Advertising 2023TAM AdEx report - Print Advertising 2023
TAM AdEx report - Print Advertising 2023
 
D2C Advantage X Toolkit MMA Global & Publicis Commerce
D2C Advantage X Toolkit MMA Global & Publicis CommerceD2C Advantage X Toolkit MMA Global & Publicis Commerce
D2C Advantage X Toolkit MMA Global & Publicis Commerce
 
Report on the future of Digital Advertising in India
Report on the future of Digital Advertising in IndiaReport on the future of Digital Advertising in India
Report on the future of Digital Advertising in India
 
Redseer_Ear-It-All_Report Design 2_16022024_final.pdf
Redseer_Ear-It-All_Report Design 2_16022024_final.pdfRedseer_Ear-It-All_Report Design 2_16022024_final.pdf
Redseer_Ear-It-All_Report Design 2_16022024_final.pdf
 
Advertising in Music Genre 2023 - TAM AdEx
Advertising in Music Genre 2023 - TAM AdExAdvertising in Music Genre 2023 - TAM AdEx
Advertising in Music Genre 2023 - TAM AdEx
 

Recently uploaded

VIP Call Girls In Green Park 9654467111 Escorts Service
VIP Call Girls In Green Park 9654467111 Escorts ServiceVIP Call Girls In Green Park 9654467111 Escorts Service
VIP Call Girls In Green Park 9654467111 Escorts ServiceSapana Sha
 
Avoid the 2025 web accessibility rush: do not fear WCAG compliance
Avoid the 2025 web accessibility rush: do not fear WCAG complianceAvoid the 2025 web accessibility rush: do not fear WCAG compliance
Avoid the 2025 web accessibility rush: do not fear WCAG complianceDamien ROBERT
 
Cost-effective tactics for navigating CPC surges
Cost-effective tactics for navigating CPC surgesCost-effective tactics for navigating CPC surges
Cost-effective tactics for navigating CPC surgesPushON Ltd
 
Inbound Marekting 2.0 - The Paradigm Shift in Marketing | Axon Garside
Inbound Marekting 2.0 - The Paradigm Shift in Marketing | Axon GarsideInbound Marekting 2.0 - The Paradigm Shift in Marketing | Axon Garside
Inbound Marekting 2.0 - The Paradigm Shift in Marketing | Axon Garsiderobwhite630290
 
What are the 4 characteristics of CTAs that convert?
What are the 4 characteristics of CTAs that convert?What are the 4 characteristics of CTAs that convert?
What are the 4 characteristics of CTAs that convert?Juan Pineda
 
How videos can elevate your Google rankings and improve your EEAT - Benjamin ...
How videos can elevate your Google rankings and improve your EEAT - Benjamin ...How videos can elevate your Google rankings and improve your EEAT - Benjamin ...
How videos can elevate your Google rankings and improve your EEAT - Benjamin ...Benjamin Szturmaj
 
Netflix Ads The Game Changer in Video Ads – Who Needs YouTube.pptx (Chester Y...
Netflix Ads The Game Changer in Video Ads – Who Needs YouTube.pptx (Chester Y...Netflix Ads The Game Changer in Video Ads – Who Needs YouTube.pptx (Chester Y...
Netflix Ads The Game Changer in Video Ads – Who Needs YouTube.pptx (Chester Y...ChesterYang6
 
9654467111 Call Girls In Mahipalpur Women Seeking Men
9654467111 Call Girls In Mahipalpur Women Seeking Men9654467111 Call Girls In Mahipalpur Women Seeking Men
9654467111 Call Girls In Mahipalpur Women Seeking MenSapana Sha
 
The Skin Games 2024 25 - Sponsorship Deck
The Skin Games 2024 25 - Sponsorship DeckThe Skin Games 2024 25 - Sponsorship Deck
The Skin Games 2024 25 - Sponsorship DeckToluwanimi Balogun
 
SORA AI: Will It Be the Future of Video Creation?
SORA AI: Will It Be the Future of Video Creation?SORA AI: Will It Be the Future of Video Creation?
SORA AI: Will It Be the Future of Video Creation?Searchable Design
 
Best Persuasive selling skills presentation.pptx
Best Persuasive selling skills  presentation.pptxBest Persuasive selling skills  presentation.pptx
Best Persuasive selling skills presentation.pptxMasterPhil1
 
Influencer Marketing Power point presentation
Influencer Marketing  Power point presentationInfluencer Marketing  Power point presentation
Influencer Marketing Power point presentationdgtivemarketingagenc
 
The Pitfalls of Keyword Stuffing in SEO Copywriting
The Pitfalls of Keyword Stuffing in SEO CopywritingThe Pitfalls of Keyword Stuffing in SEO Copywriting
The Pitfalls of Keyword Stuffing in SEO CopywritingJuan Pineda
 
Mastering SEO in the Evolving AI-driven World
Mastering SEO in the Evolving AI-driven WorldMastering SEO in the Evolving AI-driven World
Mastering SEO in the Evolving AI-driven WorldScalenut
 
定制(ULV毕业证书)拉文大学毕业证成绩单原版一比一
定制(ULV毕业证书)拉文大学毕业证成绩单原版一比一定制(ULV毕业证书)拉文大学毕业证成绩单原版一比一
定制(ULV毕业证书)拉文大学毕业证成绩单原版一比一s SS
 
BLOOM_April2024. Balmer Lawrie Online Monthly Bulletin
BLOOM_April2024. Balmer Lawrie Online Monthly BulletinBLOOM_April2024. Balmer Lawrie Online Monthly Bulletin
BLOOM_April2024. Balmer Lawrie Online Monthly BulletinBalmerLawrie
 
DIGITAL MARKETING STRATEGY_INFOGRAPHIC IMAGE.pdf
DIGITAL MARKETING STRATEGY_INFOGRAPHIC IMAGE.pdfDIGITAL MARKETING STRATEGY_INFOGRAPHIC IMAGE.pdf
DIGITAL MARKETING STRATEGY_INFOGRAPHIC IMAGE.pdfmayanksharma0441
 
Omnichannel Marketing: Defining Omnichannel Marketing
Omnichannel Marketing: Defining Omnichannel MarketingOmnichannel Marketing: Defining Omnichannel Marketing
Omnichannel Marketing: Defining Omnichannel MarketingDove Soft Ltd
 
Russian Call Girls Nagpur Swara 8617697112 Independent Escort Service Nagpur
Russian Call Girls Nagpur Swara 8617697112 Independent Escort Service NagpurRussian Call Girls Nagpur Swara 8617697112 Independent Escort Service Nagpur
Russian Call Girls Nagpur Swara 8617697112 Independent Escort Service NagpurCall girls in Ahmedabad High profile
 
Red bull marketing presentation pptxxxxx
Red bull marketing presentation pptxxxxxRed bull marketing presentation pptxxxxx
Red bull marketing presentation pptxxxxx216310017
 

Recently uploaded (20)

VIP Call Girls In Green Park 9654467111 Escorts Service
VIP Call Girls In Green Park 9654467111 Escorts ServiceVIP Call Girls In Green Park 9654467111 Escorts Service
VIP Call Girls In Green Park 9654467111 Escorts Service
 
Avoid the 2025 web accessibility rush: do not fear WCAG compliance
Avoid the 2025 web accessibility rush: do not fear WCAG complianceAvoid the 2025 web accessibility rush: do not fear WCAG compliance
Avoid the 2025 web accessibility rush: do not fear WCAG compliance
 
Cost-effective tactics for navigating CPC surges
Cost-effective tactics for navigating CPC surgesCost-effective tactics for navigating CPC surges
Cost-effective tactics for navigating CPC surges
 
Inbound Marekting 2.0 - The Paradigm Shift in Marketing | Axon Garside
Inbound Marekting 2.0 - The Paradigm Shift in Marketing | Axon GarsideInbound Marekting 2.0 - The Paradigm Shift in Marketing | Axon Garside
Inbound Marekting 2.0 - The Paradigm Shift in Marketing | Axon Garside
 
What are the 4 characteristics of CTAs that convert?
What are the 4 characteristics of CTAs that convert?What are the 4 characteristics of CTAs that convert?
What are the 4 characteristics of CTAs that convert?
 
How videos can elevate your Google rankings and improve your EEAT - Benjamin ...
How videos can elevate your Google rankings and improve your EEAT - Benjamin ...How videos can elevate your Google rankings and improve your EEAT - Benjamin ...
How videos can elevate your Google rankings and improve your EEAT - Benjamin ...
 
Netflix Ads The Game Changer in Video Ads – Who Needs YouTube.pptx (Chester Y...
Netflix Ads The Game Changer in Video Ads – Who Needs YouTube.pptx (Chester Y...Netflix Ads The Game Changer in Video Ads – Who Needs YouTube.pptx (Chester Y...
Netflix Ads The Game Changer in Video Ads – Who Needs YouTube.pptx (Chester Y...
 
9654467111 Call Girls In Mahipalpur Women Seeking Men
9654467111 Call Girls In Mahipalpur Women Seeking Men9654467111 Call Girls In Mahipalpur Women Seeking Men
9654467111 Call Girls In Mahipalpur Women Seeking Men
 
The Skin Games 2024 25 - Sponsorship Deck
The Skin Games 2024 25 - Sponsorship DeckThe Skin Games 2024 25 - Sponsorship Deck
The Skin Games 2024 25 - Sponsorship Deck
 
SORA AI: Will It Be the Future of Video Creation?
SORA AI: Will It Be the Future of Video Creation?SORA AI: Will It Be the Future of Video Creation?
SORA AI: Will It Be the Future of Video Creation?
 
Best Persuasive selling skills presentation.pptx
Best Persuasive selling skills  presentation.pptxBest Persuasive selling skills  presentation.pptx
Best Persuasive selling skills presentation.pptx
 
Influencer Marketing Power point presentation
Influencer Marketing  Power point presentationInfluencer Marketing  Power point presentation
Influencer Marketing Power point presentation
 
The Pitfalls of Keyword Stuffing in SEO Copywriting
The Pitfalls of Keyword Stuffing in SEO CopywritingThe Pitfalls of Keyword Stuffing in SEO Copywriting
The Pitfalls of Keyword Stuffing in SEO Copywriting
 
Mastering SEO in the Evolving AI-driven World
Mastering SEO in the Evolving AI-driven WorldMastering SEO in the Evolving AI-driven World
Mastering SEO in the Evolving AI-driven World
 
定制(ULV毕业证书)拉文大学毕业证成绩单原版一比一
定制(ULV毕业证书)拉文大学毕业证成绩单原版一比一定制(ULV毕业证书)拉文大学毕业证成绩单原版一比一
定制(ULV毕业证书)拉文大学毕业证成绩单原版一比一
 
BLOOM_April2024. Balmer Lawrie Online Monthly Bulletin
BLOOM_April2024. Balmer Lawrie Online Monthly BulletinBLOOM_April2024. Balmer Lawrie Online Monthly Bulletin
BLOOM_April2024. Balmer Lawrie Online Monthly Bulletin
 
DIGITAL MARKETING STRATEGY_INFOGRAPHIC IMAGE.pdf
DIGITAL MARKETING STRATEGY_INFOGRAPHIC IMAGE.pdfDIGITAL MARKETING STRATEGY_INFOGRAPHIC IMAGE.pdf
DIGITAL MARKETING STRATEGY_INFOGRAPHIC IMAGE.pdf
 
Omnichannel Marketing: Defining Omnichannel Marketing
Omnichannel Marketing: Defining Omnichannel MarketingOmnichannel Marketing: Defining Omnichannel Marketing
Omnichannel Marketing: Defining Omnichannel Marketing
 
Russian Call Girls Nagpur Swara 8617697112 Independent Escort Service Nagpur
Russian Call Girls Nagpur Swara 8617697112 Independent Escort Service NagpurRussian Call Girls Nagpur Swara 8617697112 Independent Escort Service Nagpur
Russian Call Girls Nagpur Swara 8617697112 Independent Escort Service Nagpur
 
Red bull marketing presentation pptxxxxx
Red bull marketing presentation pptxxxxxRed bull marketing presentation pptxxxxx
Red bull marketing presentation pptxxxxx
 

Digital Media: A Blockbuster in the Making

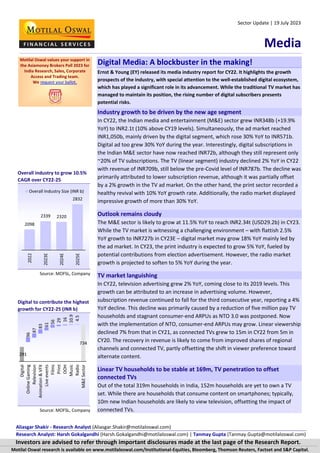
  • 1. Telecom | Update Investors are advised to refer through important disclosures made at the last page of the Research Report. Motilal Oswal research is available on www.motilaloswal.com/Institutional-Equities, Bloomberg, Thomson Reuters, Factset and S&P Capital. Aliasgar Shakir - Research Analyst (Aliasgar.Shakir@motilaloswal.com) Research Analyst: Harsh Gokalgandhi (Harsh.Gokalgandhi@motilaloswal.com) | Tanmay Gupta (Tanmay.Gupta@motilaloswal.com) Digital Media: A blockbuster in the making! Ernst & Young (EY) released its media industry report for CY22. It highlights the growth prospects of the industry, with special attention to the well-established digital ecosystem, which has played a significant role in its advancement. While the traditional TV market has managed to maintain its position, the rising number of digital subscribers presents potential risks. Industry growth to be driven by the new age segment In CY22, the Indian media and entertainment (M&E) sector grew INR348b (+19.9% YoY) to INR2.1t (10% above CY19 levels). Simultaneously, the ad market reached INR1,050b, mainly driven by the digital segment, which rose 30% YoY to INR571b. Digital ad too grew 30% YoY during the year. Interestingly, digital subscriptions in the Indian M&E sector have now reached INR72b, although they still represent only ~20% of TV subscriptions. The TV (linear segment) industry declined 2% YoY in CY22 with revenue of INR709b, still below the pre-Covid level of INR787b. The decline was primarily attributed to lower subscription revenue, although it was partially offset by a 2% growth in the TV ad market. On the other hand, the print sector recorded a healthy revival with 10% YoY growth rate. Additionally, the radio market displayed impressive growth of more than 30% YoY. Outlook remains cloudy The M&E sector is likely to grow at 11.5% YoY to reach INR2.34t (USD29.2b) in CY23. While the TV market is witnessing a challenging environment – with flattish 2.5% YoY growth to INR727b in CY23E – digital market may grow 18% YoY mainly led by the ad market. In CY23, the print industry is expected to grow 5% YoY, fueled by potential contributions from election advertisement. However, the radio market growth is projected to soften to 5% YoY during the year. TV market languishing In CY22, television advertising grew 2% YoY, coming close to its 2019 levels. This growth can be attributed to an increase in advertising volume. However, subscription revenue continued to fall for the third consecutive year, reporting a 4% YoY decline. This decline was primarily caused by a reduction of five million pay TV households and stagnant consumer-end ARPUs as NTO 3.0 was postponed. Now with the implementation of NTO, consumer-end ARPUs may grow. Linear viewership declined 7% from that in CY21, as connected TVs grew to 15m in CY22 from 5m in CY20. The recovery in revenue is likely to come from improved shares of regional channels and connected TV, partly offsetting the shift in viewer preference toward alternate content. Linear TV households to be stable at 169m, TV penetration to offset connected TVs Out of the total 319m households in India, 152m households are yet to own a TV set. While there are households that consume content on smartphones; typically, 10m new Indian households are likely to view television, offsetting the impact of connected TVs. Sector Update | 19 July 2023 Media Motilal Oswal values your support in the Asiamoney Brokers Poll 2023 for India Research, Sales, Corporate Access and Trading team. We request your ballot. Overall industry to grow 10.5% CAGR over CY22-25 Source: MOFSL, Company Digital to contribute the highest growth for CY22-25 (INR b) Source: MOFSL, Company
  • 2. 19 July 2023 2 Media | Update Digital growth prospects remain robust Digital advertising grew 30% YoY to reach INR499b in CY22. This accounted for 48% of total advertising revenue, indicating its continued gain in market share from traditional advertising channels. Its share in overall ad revenue has improved significantly to ~50% in CY22 from 32% in CY19. This surpassed TV’s contribution, which stood at 30% during the year. Digital subscription now at >60% of TV subscription market Digital subscription grew 28% YoY to reach INR72b in CY22 as it clocked 99m paid video subscriptions across almost 45m Indian households. These subscriptions generated a revenue of INR68b, which accounted for over 60% of broadcasters’ share of TV subscription revenue. Paid video subscriptions are expected to increase to 114m across 52m households by CY25, as the segment is likely to gain greater acceptance with the availability of a strong content library. Filmed revenue to remain a mixed bag as theatricals continue to linger  The segment grew 85% YoY in CY22; however, it remained at 90% of its CY19 levels. Theatrical revenue reached INR100b as theatres reopened and 1,600+ films were released in CY22.  The segment is witnessing a possible structural shift, following the pandemic, driven by changing consumer preferences. This is evident from the increased share of OTT platforms, which has risen to 20% in CY22 from 10% in CY19. The current performance of theatrical releases and cinema occupancies remains below pre-pandemic levels. Further, it has also adversely impacted broadcasting rights, given the higher exposure to digital releases. The segment is likely to grow 10% over CY22-25, driven by an increased share of digital platforms in the overall industry. Further, regional movies are likely to play a key role in driving footfalls and revenue collection for theatrical releases. Industry continues to face a challenging environment  The industry is facing continued headwind in the form of slower recovery in ad spends, adversely impacted by inflationary pressure, lower subscriptions, and changing customer preferences.  Zee: While the merged entity currently trades at an attractive valuation of 4.9x EV/EBITDA on an FY24 basis, we believe that any certainty around timelines of the merger process would lead to a stock re-rating. Pending NCLT order toward the merger proceedings and the impact of SEBI orders on promoters would remain the key monitorables.  PVR: The stock is trading at a P/E and EV/EBITDA of 21.5x and 9.6x on FY25E basis, respectively, given its weak performance in the recent past. This could be attributed to lower occupancies, which could be a result of weak content and growing prominence of OTTs in the recent past. Recovery in occupancy levels remains the main driver of incremental upside. Improved share of digital segment within ad revenues Source: MOFSL, Company Digital segment reporting strong growth (INR b) Source: MOFSL, Company
  • 3. 19 July 2023 3 Media | Update Overall industry growing in low double digits Continuing on its growth trajectory, the Indian M&E sector reported a healthy growth of 19.9% YoY by INR348b to reach INR2.1t in CY22. This was 10% above its pre-pandemic levels of CY19. The growth was largely led by the digital segment, which grew 30% YoY, while TV, the largest division witnessed a decline of 2% YoY. The sector further witnessed a resurgence in filmed entertainment, led by higher theatrical releases (1,600 films in CY22) and grew 85% YoY with theatrical revenue surpassing INR100b. The industry is expected to register a CAGR of 10.5% over CY22- 25, led by growth in the digital segment, followed by online gaming to INR2.8t. Exhibit 1: Overall industry to register a CAGR of 10.5% over CY22-25… Source: FICCI-EY Media report Exhibit 2: …primarily backed by the Digital segment (INR b) Source: FICCI-EY Media report New age segments such as online gaming and digital media reported robust growth, due to which the share of traditional media (television, print, filmed entertainment, OOH, music, radio) declined to 58% of the M&E sector in CY22, from 71% in 2019. 1,476 1,675 1,910 1,477 1,750 2,098 2,339 2,832 2017 2018 2019 2020 2021 2022 2023E 2025E Overall Industry Size (INR b) 734 96 87 83 61 56 29 16 11 5 291 Digital Online Gaming Relevision Animation & VFX Live events Films Print OOH Music Radio M&E Sector
  • 4. 19 July 2023 4 Media | Update Exhibit 3: Digital and Online gaining share, while TV witnessing YoY decline (INR b) 2018 2019 2020 2021 2022 22 v/s 21 TV Industry (INR b) 740 787 685 720 709 -2% Print 306 296 190 227 250 10% Filmed entertainment 175 191 72 93 172 85% Digital Market (INR b) 169 308 326 439 571 30% Animation and VFX 79 95 53 83 107 29% Live events 75 83 27 32 73 128% Online Gaming 49 65 79 101 135 34% Out of Home Media 37 39 16 20 37 85% Radio 31 31 14 16 21 31% Music 14 15 15 19 22 16% Overall Industry Size (INR b) 1675 1910 1477 1750 2098 Source: FICCI-EY Media report Segment-wise, ad revenue witnessed an overall growth fueled by 30% YoY growth in digital ads, reaching INR499b (48% share). In CY22, television advertising grew 2%, coming close to its CY19 levels. This growth can be attributed to an increase in advertising volume. However, subscription revenue continued to fall for the third consecutive year, experiencing a 4% decline. This decline was primarily caused by a reduction of five million pay TV households and stagnant consumer-end ARPUs. While linear viewership declined 7% over 2021, 8m to 10m smart TVs connected to the internet each day, up from ~5m in 2021. Digital subscription grew 27% to reach INR72b as 99m paid video subscriptions across almost 45m Indian households generated INR68b. Print subscription revenue grew 5% YoY, aided by rising cover prices; it has stabilized at 15% to 20% below the pre-Covid levels.
  • 5. 19 July 2023 5 Media | Update TV market stagnant, likely to see soft growth in the near term In CY22, the television segment’s revenue declined 2% YoY to reach INR709b. This decline can be attributed primarily to a reduction in subscription revenue. The segment observed a decrease in pay-tv homes by 5m during this period. However, the ARPU remained unchanged. Viewership too dropped 7% YoY due to a fall in both Hindi and regional language viewership. Exhibit 4: TV industry down 2% YoY in CY22 (INR b) Source: FICCI-EY Media report Exhibit 5: TV viewership across segments declines (impressions in b) Source: FICCI-EY Media report Exhibit 6: Pay-tv subscribers witness a decline, while connected TV subscribers grow (household subscribers in m) Source: FICCI-EY Media report 305 320 251 313 318 435 468 434 407 392 740 787 685 720 709 2018 2019 2020 2021 2022 Advertising Subscription Total 1,604 1,614 1,731 1,591 1,474 1,010 1,007 1,087 979 925 594 608 643 612 548 2018 2019 2020 2021 2022 Universe HSM South 131 125 120 116 40 43 45 50 5 10 15 40 2020 2021 2022 2025E Pay TV Free TV Connected TV
  • 6. 19 July 2023 6 Media | Update TV ad revenue too witnessed a modest growth of merely 2%, on account of retrieval by four large broadcast networks of content from DD Free Dish in CY22. This growth was mainly led by improved volumes as ad-rates remained fairly flat. On an exit basis, 4QFY22 witnessed a 4% YoY decline in ad revenue, primarily due to the Russia-Ukraine conflict and the looming threat of recession in developed markets. Despite major events such as FIFA World Cup 2022, ICC Men’s T20 World Cup, and Gujarat state elections, the overall ad volumes were adversely impacted. E- commerce contributed more to the incremental growth in ad spending, while the shares of education and telecom reduced. Exhibit 7: Ad revenue reports a modest growth of 2% YoY in CY22 Source: FICCI-EY Media report Exhibit 8: TV ad volumes decline on exit basis in CY22 (daily insertions in ‘000) Average ad insertions per day; Source: FICCI-EY Media report  Region-wise split indicated regional channels (816 hours/ channel) received 19% more ad volumes than national channels (686 hours/ channel) in CY22. Industry data indicated three of the top five genres, which saw the highest increase in new advertisers pertained to regional languages. In CY22, the number of advertisers using Television increased to 9,245 from 8,932 in CY21. Of these, 4,705 used only TV, resulting in an increase in advertiser base for the first time in three years.  Going ahead, the segment is likely to report a soft CAGR of 3.9% over CY22- CY25 to reach INR796b. The softer growth is primarily attributed to:  Reduction in Pay TV households to 116m in CY25 from 120m currently.  Proposed ad cap rules by TRAI to limit ad time to 12mins/hr, which is expected to hit ad revenue. While the matter remains sub-judice, its implementation is expected to hurt revenue by 10-15%.  Reduction in overall TV impression by 7% as the TV market continues to face heavy competition from OTT and other digital platforms. 267 305 320 251 313 318 2017 2018 2019 2020 2021 2022 TV Ad revenue (INR b) 245 224 245 257 244 242 244 247 Q1 Q2 Q3 Q4 CY'21 CY'22
  • 7. 19 July 2023 7 Media | Update Digital market well established Increased internet penetration to drive demand The overall digital segment is witnessing a strong growth, on the back of improved infrastructure. While the number of telecom subscribers remained stable at 1.2b, the Internet penetration improved 4% to 866m subscriptions in Dec’22. Studies further indicated that Urban internet subscriptions, which comprise 60% of all internet subscriptions, grew 4%, while rural internet subscriptions grew 5% in 2022. The average monthly mobile data usage per smartphone at 25GB per month in CY22 is set to register a CAGR of 14% to reach 54GB by 2028. This would be mainly led by increased consumption of online video because of improved share of regional content along with increased original content hours (3,000 hours; +19% YoY). Exhibit 9: Internet penetration improves 6% YoY to 866m in Dec’22 (Subs in m) Source: FICCI-EY Media report Exhibit 10: Digital players ramping up original content rollout Source: FICCI-EY Media report Digital ad revenue rises 30% YoY Digital advertising grew 30% YoY to reach INR499b in CY22, contributing to ~50% of overall ad spends in CY22 (from 31% in CY19). Studies indicate that ~600k to 800k SME and long tail advertisers spent INR180b on digital media, primarily on performance advertising on Google, Facebook, and e-commerce platforms. Of the total, new gen segments such as e-commerce platforms increased their spends to over INR70b, crossing 14% of total digital advertising. FMCG and e-commerce together constituted ~50% of the ad revenue on the digital platform. 482 496 516 313 333 350 Dec'20 Dec'21 Dec'22 Urban Rural 2,033 1,187 2,512 3,000 2019 2020 2021 2022 Original OTT content produced (Hrs)
  • 8. 19 July 2023 8 Media | Update Exhibit 11: Overall ad revenue growth led by Digital segment (INR b) Source: MOFSL, FICCI EY media report Exhibit 12: Share of Digital ad revenue improves to 48% of overall ad revenue in CY22 Source: MOFSL, FICCI EY media report Subscription revenue picks up, led by improved acceptability Digital subscription grew 27% to reach INR72b, which was mainly on the back of growth in video subscription revenue. It grew 27% in CY22 to INR68b, on the back of improved acceptability, as paid video subscriptions reached 99m in CY22, across ~45m households in India, with a total viewership of around 135-180m users. Improved internet penetration and acceptability of digital content is further evident from the fact that audio subscription witnessed a growth of 37% with the number of consumers reaching 4.6m. A shift from print to digital news consumption induced by the pandemic is further seen to continue as news subscription revenue touched ~INR1.2b in CY22. Exhibit 13: Digital subscription revenue continues to report strong growth… Source: MOFSL, FICCI EY media report 320 251 313 318 206 122 151 170 279 282 383 499 39 16 20 37 31 14 16 21 8 2 1 5 2019 2020 2021 2022 TV Ad revenue (INR b) Print Digital* OOH Radio Cinema 43% 48% 50% 35% 30% 28% 17% 16% 15% 4% 6% 6% 2021 2022 2023E Digital TV Print Others 14 29 43 56 72 2018 2019 2020 2021 2022 Digital Subscription (INR b)
  • 9. 19 July 2023 9 Media | Update Exhibit 14: ….backed by healthy growth in household subscribers Source: MOFSL, FICCI EY media report Exhibit 15: Next leg of growth in subscription to be driven by the digital segment: 2022 2025E Source: MOFSL, FICCI EY media report 63 80 99 114 31 40 45 52 2020 2021 2022 2025E Paid subscriptions (mn) Subscribing households (mn) TV 1st + free consumers Digital only v/s mixed Total Indian households 319m TV+Digital 165m Digital 1st (SVOD+PayTV) 43m TV 1st (AVOD+PayTV) 77m Free Consumers (AVOD+FTA) 45m Digital Only 2m TV 1st + free consumers Digital only vs. mixed Total Indian households 328m TV+Digital 166-169m Digital 1st (SVOD+PayTV) 42m TV 1st (AVOD+PayTV) 74-77m Free Consumers (AVOD+FTA) 50m Digital Only 10m
  • 10. 19 July 2023 10 Media | Update Digital segment to be at the forefront of growth The digital segment is expected to register a CAGR of 15% over CY22-25 to reach INR862b. Within this, the digital advertising is expected to outpace the overall growth by registering a CAGR of 15% and gaining market share. It has reached 48% of total advertising in CY22, higher than the TV ad market at 30%. This is expected to further increase to 50% by CY23, and 54% by 2025, driven by SME and e-commerce. Entertainment OTT platforms, including sports, are expected to generate around INR60b of advertising revenue by CY25. Paid video subscriptions are anticipated to increase to 114m across 52m households if the current pricing remains stable. This could further exceed 100m households if annual pricing is reduced to ~INR1,000 for 3-4 services. The digital subscription segment is likely to register an 10% CAGR over CY22-CY25, which will be aided by improved acceptability of digital content. India offers one of the most affordable data charges globally (USD0.17 per GB v/s USD5.6 in the US and USD3.9 in Japan). Exhibit 16: Digital segment to register a 15% CAGR over CY22-25 (INR b) Source: MOFSL, FICCI EY media report Filmed entertainment yet to reach pre-Covid levels Pandemic-induced impact The film industry has faced significant challenges during the pandemic, experiencing the most severe impact among various sectors. With restrictions on public movement and cinema closures lasting for almost two years, the industry has struggled to recover to pre-pandemic levels. As per “UFO moviez” estimates, overall screen counts as on Dec22 stood at 9,382, which is ~2% lower than pre-pandemic levels. On an aggregate basis, domestic theatrical has seen improvement to reach INR105b in CY22 (INR115 in CY119). This has mainly been driven by a higher number of releases and ATP improvement. Overseas BO collection witnessed a decline due to lower number of releases (16 movies vs. 27 movies in 2019). The introduction of OTT release has further impacted the broadcasting rights and viewership as films were released on television after their theatrical and digital releases, as a result its share in revenue declined from 12% in CY19 to merely 6% in CY22. 383 499 594 765 56 72 77 97 439 571 671 862 2021 2022 2023E 2025E Digital Advertising Digital Subscription Total Revenues
  • 11. 19 July 2023 11 Media | Update Exhibit 17: Industry-level footfalls continue to remain sluggish; ATP improves Source: MOFSL, FICCI EY media report Exhibit 18: Improved digital share driving filmed entertainment market growth (INR b) Source: MOFSL, FICCI EY media report Segment witnessing a resurgence post-pandemic After being severely impacted by the pandemic, the segment witnessed higher release of domestic films in CY22, which helped improve domestic theatrical revenue. This however remained below pre-Covid levels due to lower occupancies. According to industry discussions, frequent cinema goers have reduced their visits from 2-4 times a month to just once a month, while infrequent visitors (a few times a year) have also decreased. Despite this, box office revenue surpassed the INR100b mark, primarily driven by strong performance of cinemas in South India (50% share) and improved ticket prices. However, Bollywood movies continue to struggle in terms of performance. The industry has seen a significant increase in the number of releases this year across various languages, with a total of 1,623 movies hitting the screens. This represents a 9% increase compared to the levels seen in 2019. The resumption of eight-week exclusivity window and opening up of theatres have resulted in a decline in the premium paid by OTT platforms to acquire content. As a result, the number of direct releases on OTT platforms witnessed a decline in CY22. However, the dominant position of these OTT players and their constant efforts to acquire content to expand their subscription base continues to pose threat to the traditional theatrical release model. 1660 1560 1460 387 418 994 95 104 106 91 87 119 2017 2018 2019 2020 2021 2022 Footfalls (m) ATP (INR) 115 25 39 105 27 3 6 16 22 7 7 10 19 35 40 36 8 2 1 5 10 49 43 21 2019 2020 2021 2022 Domestic Theatricals Overseas Theatricals Broadcast Right Digital/OTT rights In-Cinema Ads Share of digital (%)
  • 12. 19 July 2023 12 Media | Update Exhibit 19: Improved share of Southern Cinema in the overall box office collection supports revenue Source: MOFSL, FICCI EY media report Exhibit 20: Gross box office collection (GBOC) for South crossing pre-pandemic levels, while other segments continue to linger (GBOC in INR b) Source: MOFSL, FICCI EY media report Exhibit 21: Improved share of regional movies in top 10 collections 2022 2018 Movie INR b % of total Movie INR b % of total KGF Chapter 2 10.0 22.5 Sanju 4.4 15.6 RRR 9.0 20.3 Padmaavat 4.0 14.2 Avatar: The Way of Water 4.7 10.5 Simmba 3.0 10.5 Kantara 3.6 8.2 2.0 5.5 19.6 Brahmastra Part One: Shiva 3.2 7.1 Race 3 2.2 7.7 Ponniyin Selvan - Part 1 3.1 7.0 Baaghi 2 2.1 7.5 The Kashmir Files 3.0 6.6 Thugs Of Hindostan 1.9 6.9 Vikram 2.9 6.5 Badhaai Ho 1.8 6.3 Drishyam 2 2.8 6.4 Stree 1.7 5.9 Bhool Bhulaiyaa 2 2.2 4.9 Raazi 1.6 5.6 Total collection 44.5 35.5 28.1 80.4 Share of non-Bollywood 33.4 64.5 5.5 19.6 Source: Sacnilk.com, BoxofficeIndia.com, MOFSL 45% 44% 41% 45% 44% 27% 33% 39% 39% 42% 36% 37% 59% 50% 11% 13% 11% 12% 15% 11% 12% 5% 4% 6% 7% 4% 3% 5% 2015 2016 2017 2018 2019 2020/21 2022 Hindi South Hollywood Others 48 14 15 5 6 16 35 21 17 8 6 12 Hindi Telugu Tamil Kannada Malyalam Hollywood 2019 2022
  • 13. 19 July 2023 13 Media | Update Change in consumer preference visible The exposure of OTT during the pandemic-related lockdowns allowed consumers to binge on content across segments and languages (Indian regional and International content), which led to a significant shift in content preferences. A deep dive into box office data further indicated box office collection data for movies rated “<4 IMDB ratings” witnessed a significant decline in FY22, indicating lower tolerance for sub- par content. This is substantiated by the recent under performances of Big ticket movies such as Aamir Khan’s Laal Singh Chadha, Akshay Kumar’s Rakshabandhan, and Vijay Devarakonda’s Liger. Further, the improved acceptance of regional content such as Pushpa, RRR, and KGF has indicated that it is only relatable and escapist content that appeals to the audiences and draws incremental footfall and not the big stars that work their magic on the big screens. The increasing influence of digital platforms on box office collections, coupled with significant investments made by well-funded OTT players, poses a growing threat to the dominant position of theatres in the film industry. Exhibit 22: Box office collection for “<4 IMDB-rating” movies plunges in FY22 Source: Sacnilk.com, BoxofficeIndia.com, MOFSL Exhibit 23: OTT platforms continue to spend aggressively to acquire content Movie Date Amount (INR b) OTT Pathaan Apr'23 1.0 Amazon Prime Tu Jhoothi Main Makkar May'23 0.5 Netflix Gehraiyaan Feb'22 1.0 Amazon Prime Atrangi Re Dec'21 0.8 Disney+ Hotstar Govinda Naam Mera Dec'22 0.6 Disney+ Hotstar Laal Singh Chadda Oct'22 0.9 Netflix KGF 2 May'22 3.2 Amazon Prime Pushpa: The Rise Jan'22 0.3 Amazon Prime Bhool Bhulaiya 2 Jun'22 0.3 Netflix Gangubai Kathiyawadi Apr'22 0.7 Netflix Jhund May'22 0.3 Zee5 Source: MOFSL, media reports 3.85 4.86 0.46 FY18 FY19 FY22 Collection (INR b)
  • 14. 19 July 2023 14 Media | Update Exhibit 24: Movies with strong star cast see direct OTT release OTT movies released Date OTT app Starcast Bloody Daddy Jun'23 Jio Cinemas Shahid Kapoor Sirf Ek Bandaa Kaafi Hai May'23 Zee5 Manoj Bajpayee Kanjoos Makhichoos Mar'23 Zee5 Kunal Khemu Mission Majnu Jan'23 Netflix Siddharth Malhotra Govinda Naam Mera Dec'22 Disney+ Hotstar Vicky Kaushal, Kiara Advani Gehraiyaan Feb'22 Amazon Prime Deepika Padukone, Ananya Pandey Bob Biswas Dec'21 Zee5 Abhishek Bacchan Atrangi Re Dec'21 Disney+ Hotstar Akshay Kumar, Dhanush Sardar Udham Singh Oct'21 Amazon Prime Vicky Kaushal Shershah Aug'21 Amazon Prime Siddharth Malhotra Bhuj: The Pride of India Aug'21 Disney+ Hotstar Ajay Devgn, Sanjay Dutt Toofan Jul'21 Amazon Prime Farhan Akhtar, Paresh Rawal Source: MOFSL, media reports Improved penetration and revamping of strategy could drive growth:  While the growth in the theatrical segment post pandemic has mainly been driven by pricing, the next leg of growth is expected to accrue from improved penetration. While the current occupancies continue to linger, companies would now look to expand their presence within the underpenetrated markets of Tier 2 and below cities. However, multiplex and broadcasting partners will have to find a balance between managing the capex heavy model and at the same time provide cinema experience at an affordable pricing, which could remain a key challenge. Broadcast rights are expected to remain muted as they have become a distant third window after theatrical and digital releases. Digital rights growth will be volume driven, with a similar number of tent-pole films, but more mid- budget films. In theatre, ad revenue too will continue to remain dependent on the occupancies.  Further, the cinema segment is expected to split into two distinct categories, each catering to different audience segments with varying price-points. On one hand, there will be premium “multiplex-type” content that targets an audience of around 30m to 40m people. This content will likely come with higher ticket prices. On the hand, there will be less expensive mass content that aims to attract a larger audience of 100m to 120m people.
  • 15. 19 July 2023 15 Media | Update Media players continue to see a challenging environment The segment continues to see headwinds in the form of slower recovery. Ad spends were negatively impacted by inflationary pressure, lower subscriptions, and changing customer preferences toward consumption of content. Zee Entertainment: Merger timelines visibility remains a key  Continued weakness in ad revenue, adversely impacted by the inflationary environment, especially in the FMCG segment is expected to pick up from 2HFY24. However, outlook on subscription revenue is expected to see some visibility with the implementation of NTO 3.0.  Continued investment in digital content is expected to improve Zee5’s KPIs. However, it will remain a drag on the profitability, given the digital segment continues to remain in an investment mode.  The merged entity with a revenue potential of ~INR190b and EBITDA of INR45b is trading at a reasonable valuation of 4.9x EV/EBITDA on FY24 basis. However, any certainty around merger timelines remains a key monitorable.  The recent ruling by SEBI disqualifying Mr. Puneet Goenka has further prolonged the merger process and continues to be a crucial factor in its resolution. Although the NCLT has reserved its order on the merger proceedings, even if the decision is in favor of the merger, the appointment of new leadership will be necessary for the merged entity. PVR: Slower recovery in occupancies to remain a drag  The slower recovery in occupancies is being witnessed, which remains a drag on the business. A dry pipeline of movies and lower traction after “Pathaan” have further added to the concerns.  Occupancy levels, which stood at ~31% in the pre-Covid period, have now come to ~25% (merged entity) as on Mar’23 as the overall top-line growth was mainly driven by improved pricing.  Continued uncertainty around acceptability of content, slower recovery in advertising revenue, along with increased risk of rising scale and the traction of movie releases over OTT platforms will continue to pose headwinds.  The company is currently trading at an EV/EBITDA and P/E valuation of 9.6x/21.5x on FY25 basis, which we believe is fairly priced, given the uncertainty around recovery in occupancies. Investment in securities market are subject to market risks. Read all the related documents carefully before investing
  • 16. 19 July 2023 16 Media | Update N O T E S
  • 17. 19 July 2023 17 Media | Update Explanation of Investment Rating Investment Rating Expected return (over 12-month) BUY >=15% SELL < - 10% NEUTRAL < - 10 % to 15% UNDER REVIEW Rating may undergo a change NOT RATED We have forward looking estimates for the stock but we refrain from assigning recommendation *In case the recommendation given by the Research Analyst is inconsistent with the investment rating legend for a continuous period of 30 days, the Research Analyst shall be within following 30 days take appropriate measures to make the recommendation consistent with the investment rating legend. Disclosures The following Disclosures are being made in compliance with the SEBI Research Analyst Regulations 2014 (herein after referred to as the Regulations). Motilal Oswal Financial Services Ltd. (MOFSL) is a SEBI Registered Research Analyst having registration no. INH000000412. MOFSL, the Research Entity (RE) as defined in the Regulations, is engaged in the business of providing Stock broking services, Depository participant services & distribution of various financial products. MOFSL is a listed public company, the details in respect of which are available on www.motilaloswal.com. MOFSL (erstwhile Motilal Oswal Securities Limited - MOSL) is registered with the Securities & Exchange Board of India (SEBI) and is a registered Trading Member with National Stock Exchange of India Ltd. (NSE) and Bombay Stock Exchange Limited (BSE), Multi Commodity Exchange of India Limited (MCX) and National Commodity & Derivatives Exchange Limited (NCDEX) for its stock broking activities & is Depository participant with Central Depository Services Limited (CDSL) National Securities Depository Limited (NSDL),NERL, COMRIS and CCRL and is member of Association of Mutual Funds of India (AMFI) for distribution of financial products and Insurance Regulatory & Development Authority of India (IRDA) as Corporate Agent for insurance products. Details of associate entities of Motilal Oswal Financial Services Limited are available on the website at http://onlinereports.motilaloswal.com/Dormant/documents/List%20of%20Associate%20companies.pdf MOFSL and its associate company(ies), their directors and Research Analyst and their relatives may; (a) from time to time, have a long or short position in, act as principal in, and buy or sell the securities or derivatives thereof of companies mentioned herein. (b) be engaged in any other transaction involving such securities and earn brokerage or other compensation or act as a market maker in the financial instruments of the company(ies) discussed herein or act as an advisor or lender/borrower to such company(ies) or may have any other potential conflict of interests with respect to any recommendation and other related information and opinions.; however the same shall have no bearing whatsoever on the specific recommendations made by the analyst(s), as the recommendations made by the analyst(s) are completely independent of the views of the associates of MOFSL even though there might exist an inherent conflict of interest in some of the stocks mentioned in the research report. MOFSL and / or its affiliates do and seek to do business including investment banking with companies covered in its research reports. As a result, the recipients of this report should be aware that MOFSL may have a potential conflict of interest that may affect the objectivity of this report. Compensation of Research Analysts is not based on any specific merchant banking, investment banking or brokerage service transactions. Details of pending Enquiry Proceedings of Motilal Oswal Financial Services Limited are available on the website at https://galaxy.motilaloswal.com/ResearchAnalyst/PublishViewLitigation.aspx A graph of daily closing prices of securities is available at www.nseindia.com, www.bseindia.com. Research Analyst views on Subject Company may vary based on Fundamental research and Technical Research. Proprietary trading desk of MOFSL or its associates maintains arm’s length distance with Research Team as all the activities are segregated from MOFSL research activity and therefore it can have an independent view with regards to Subject Company for which Research Team have expressed their views. Regional Disclosures (outside India) This report is not directed or intended for distribution to or use by any person or entity resident in a state, country or any jurisdiction, where such distribution, publication, availability or use would be contrary to law, regulation or which would subject MOFSL & its group companies to registration or licensing requirements within such jurisdictions. For Hong Kong: This report is distributed in Hong Kong by Motilal Oswal capital Markets (Hong Kong) Private Limited, a licensed corporation (CE AYY-301) licensed and regulated by the Hong Kong Securities and Futures Commission (SFC) pursuant to the Securities and Futures Ordinance (Chapter 571 of the Laws of Hong Kong) “SFO”. As per SEBI (Research Analyst Regulations) 2014 Motilal Oswal Securities (SEBI Reg. No. INH000000412) has an agreement with Motilal Oswal capital Markets (Hong Kong) Private Limited for distribution of research report in Hong Kong. This report is intended for distribution only to “Professional Investors” as defined in Part I of Schedule 1 to SFO. Any investment or investment activity to which this document relates is only available to professional investor and will be engaged only with professional investors.” Nothing here is an offer or solicitation of these securities, products and services in any jurisdiction where their offer or sale is not qualified or exempt from registration. The Indian Analyst(s) who compile this report is/are not located in Hong Kong & are not conducting Research Analysis in Hong Kong. For U.S. Motilal Oswal Financial Services Limited (MOFSL) is not a registered broker - dealer under the U.S. Securities Exchange Act of 1934, as amended (the"1934 act") and under applicable state laws in the United States. In addition MOFSL is not a registered investment adviser under the U.S. Investment Advisers Act of 1940, as amended (the "Advisers Act" and together with the 1934 Act, the "Acts), and under applicable state laws in the United States. Accordingly, in the absence of specific exemption under the Acts, any brokerage and investment services provided by MOFSL, including the products and services described herein are not available to or intended for U.S. persons. This report is intended for distribution only to "Major Institutional Investors" as defined by Rule 15a-6(b)(4) of the Exchange Act and interpretations thereof by SEC (henceforth referred to as "major institutional investors"). This document must not be acted on or relied on by persons who are not major institutional investors. Any investment or investment activity to which this document relates is only available to major institutional investors and will be engaged in only with major institutional investors. In reliance on the exemption from registration provided by Rule 15a-6 of the U.S. Securities Exchange Act of 1934, as amended (the "Exchange Act") and interpretations thereof by the U.S. Securities and Exchange Commission ("SEC") in order to conduct business with Institutional Investors based in the U.S., MOFSL has entered into a chaperoning agreement with a U.S. registered broker- dealer, Motilal Oswal Securities International Private Limited. ("MOSIPL"). Any business interaction pursuant to this report will have to be executed within the provisions of this chaperoning agreement. The Research Analysts contributing to the report may not be registered /qualified as research analyst with FINRA. Such research analyst may not be associated persons of the U.S. registered broker-dealer, MOSIPL, and therefore, may not be subject to NASD rule 2711 and NYSE Rule 472 restrictions on communication with a subject company, public appearances and trading securities held by a research analyst account. For Singapore In Singapore, this report is being distributed by Motilal Oswal Capital Markets Singapore Pte Ltd (“MOCMSPL”) (Co. Reg. NO. 201129401Z) which is a holder of a capital markets services license and an exempt financial adviser in Singapore. As per the approved agreement under Paragraph 9 of Third Schedule of Securities and Futures Act (CAP 289) and Paragraph 11 of First Schedule of Financial Advisors Act (CAP 110) provided to MOCMSPL by Monetary Authority of Singapore. Persons in Singapore should contact MOCMSPL in respect of any matter arising from, or in connection with this report/publication/communication. This report is distributed solely to persons who qualify as “Institutional Investors”, of which some of whom may consist of "accredited" institutional investors as defined in section 4A(1) of the Securities and Futures Act, Chapter 289 of Singapore (“the SFA”). Accordingly, if a Singapore person is not or ceases to be such an institutional investor, such Singapore Person must immediately discontinue any use of this Report and inform MOCMSPL. Specific Disclosures 1 MOFSL, Research Analyst and/or his relatives does not have financial interest in the subject company, as they do not have equity holdings in the subject company. 2 MOFSL, Research Analyst and/or his relatives do not have actual/beneficial ownership of 1% or more securities in the subject company 3 MOFSL, Research Analyst and/or his relatives have not received compensation/other benefits from the subject company in the past 12 months 4 MOFSL, Research Analyst and/or his relatives do not have material conflict of interest in the subject company at the time of publication of research report 5 Research Analyst has not served as director/officer/employee in the subject company 6 MOFSL has not acted as a manager or co-manager of public offering of securities of the subject company in past 12 months 7 MOFSL has not received compensation for investment banking/ merchant banking/brokerage services from the subject company in the past 12 months 8 MOFSL has not received compensation for other than investment banking/merchant banking/brokerage services from the subject company in the past 12 months 9 MOFSL has not received any compensation or other benefits from third party in connection with the research report 10 MOFSL has not engaged in market making activity for the subject company
  • 18. 19 July 2023 18 Media | Update ******************************************************************************************************************************** The associates of MOFSL may have: - financial interest in the subject company - actual/beneficial ownership of 1% or more securities in the subject company at the end of the month immediately preceding the date of publication of the Research Report or date of the public appearance. - received compensation/other benefits from the subject company in the past 12 months - any other potential conflict of interests with respect to any recommendation and other related information and opinions.; however the same shall have no bearing whatsoever on the specific recommendations made by the analyst(s), as the recommendations made by the analyst(s) are completely independent of the views of the associates of MOFSL even though there might exist an inherent conflict of interest in some of the stocks mentioned in the research report. - acted as a manager or co-manager of public offering of securities of the subject company in past 12 months - be engaged in any other transaction involving such securities and earn brokerage or other compensation or act as a market maker in the financial instruments of the company(ies) discussed herein or act as an advisor or lender/borrower to such company(ies) - received compensation from the subject company in the past 12 months for investment banking / merchant banking / brokerage services or from other than said services. - Served subject company as its clients during twelve months preceding the date of distribution of the research report. The associates of MOFSL has not received any compensation or other benefits from third party in connection with the research report Above disclosures include beneficial holdings lying in demat account of MOFSL which are opened for proprietary investments only. While calculating beneficial holdings, It does not consider demat accounts which are opened in name of MOFSL for other purposes (i.e holding client securities, collaterals, error trades etc.). MOFSL also earns DP income from clients which are not considered in above disclosures. Analyst Certification The views expressed in this research report accurately reflect the personal views of the analyst(s) about the subject securities or issues, and no part of the compensation of the research analyst(s) was, is, or will be directly or indirectly related to the specific recommendations and views expressed by research analyst(s) in this report. Terms & Conditions: This report has been prepared by MOFSL and is meant for sole use by the recipient and not for circulation. The report and information contained herein is strictly confidential and may not be altered in any way, transmitted to, copied or distributed, in part or in whole, to any other person or to the media or reproduced in any form, without prior written consent of MOFSL. The report is based on the facts, figures and information that are considered true, correct, reliable and accurate. The intent of this report is not recommendatory in nature. The information is obtained from publicly available media or other sources believed to be reliable. Such information has not been independently verified and no guaranty, representation of warranty, express or implied, is made as to its accuracy, completeness or correctness. All such information and opinions are subject to change without notice. The report is prepared solely for informational purpose and does not constitute an offer document or solicitation of offer to buy or sell or subscribe for securities or other financial instruments for the clients. Though disseminated to all the customers simultaneously, not all customers may receive this report at the same time. MOFSL will not treat recipients as customers by virtue of their receiving this report. Disclaimer: The report and information contained herein is strictly confidential and meant solely for the selected recipient and may not be altered in any way, transmitted to, copied or distributed, in part or in whole, to any other person or to the media or reproduced in any form, without prior written consent. This report and information herein is solely for informational purpose and may not be used or considered as an offer document or solicitation of offer to buy or sell or subscribe for securities or other financial instruments. Nothing in this report constitutes investment, legal, accounting and tax advice or a representation that any investment or strategy is suitable or appropriate to your specific circumstances. The securities discussed and opinions expressed in this report may not be suitable for all investors, who must make their own investment decisions, based on their own investment objectives, financial positions and needs of specific recipient. This may not be taken in substitution for the exercise of independent judgment by any recipient. Each recipient of this document should make such investigations as it deems necessary to arrive at an independent evaluation of an investment in the securities of companies referred to in this document (including the merits and risks involved), and should consult its own advisors to determine the merits and risks of such an investment. The investment discussed or views expressed may not be suitable for all investors. Certain transactions -including those involving futures, options, another derivative products as well as non-investment grade securities - involve substantial risk and are not suitable for all investors. No representation or warranty, express or implied, is made as to the accuracy, completeness or fairness of the information and opinions contained in this document. The Disclosures of Interest Statement incorporated in this document is provided solely to enhance the transparency and should not be treated as endorsement of the views expressed in the report. This information is subject to change without any prior notice. The Company reserves the right to make modifications and alternations to this statement as may be required from time to time without any prior approval. MOFSL, its associates, their directors and the employees may from time to time, effect or have effected an own account transaction in, or deal as principal or agent in or for the securities mentioned in this document. They may perform or seek to perform investment banking or other services for, or solicit investment banking or other business from, any company referred to in this report. Each of these entities functions as a separate, distinct and independent of each other. The recipient should take this into account before interpreting the document. This report has been prepared on the basis of information that is already available in publicly accessible media or developed through analysis of MOFSL. The views expressed are those of the analyst, and the Company may or may not subscribe to all the views expressed therein. This document is being supplied to you solely for your information and may not be reproduced, redistributed or passed on, directly or indirectly, to any other person or published, copied, in whole or in part, for any purpose. This report is not directed or intended for distribution to, or use by, any person or entity who is a citizen or resident of or located in any locality, state, country or other jurisdiction, where such distribution, publication, availability or use would be contrary to law, regulation or which would subject MOFSL to any registration or licensing requirement within such jurisdiction. The securities described herein may or may not be eligible for sale in all jurisdictions or to certain category of investors. Persons in whose possession this document may come are required to inform themselves of and to observe such restriction. Neither the Firm, not its directors, employees, agents or representatives shall be liable for any damages whether direct or indirect, incidental, special or consequential including lost revenue or lost profits that may arise from or in connection with the use of the information. The person accessing this information specifically agrees to exempt MOFSL or any of its affiliates or employees from, any and all responsibility/liability arising from such misuse and agrees not to hold MOFSL or any of its affiliates or employees responsible for any such misuse and further agrees to hold MOFSL or any of its affiliates or employees free and harmless from all losses, costs, damages, expenses that may be suffered by the person accessing this information due to any errors and delays. Investment in securities market are subject to market risks. Read all the related documents carefully before investing. Registration granted by SEBI and certification from NISM in no way guarantee performance of the intermediary or provide any assurance of returns to investors. Registered Office Address: Motilal Oswal Tower, Rahimtullah Sayani Road, Opposite Parel ST Depot, Prabhadevi, Mumbai-400025; Tel No.: 022 - 71934200 / 71934263; www.motilaloswal.com. Correspondence Address: Palm Spring Centre, 2nd Floor, Palm Court Complex, New Link Road, Malad (West), Mumbai- 400 064. Tel No: 022 71881000. Details of Compliance Officer: Neeraj Agarwal, Email Id: na@motilaloswal.com, Contact No.:022-40548085. Grievance Redressal Cell: Contact Person Contact No. Email ID Ms. Hemangi Date 022 40548000 / 022 67490600 query@motilaloswal.com Ms. Kumud Upadhyay 022 40548082 servicehead@motilaloswal.com Mr. Ajay Menon 022 40548083 am@motilaloswal.com Registration details of group entities.: Motilal Oswal Financial Services Ltd. (MOFSL): INZ000158836 (BSE/NSE/MCX/NCDEX); CDSL and NSDL: IN-DP-16-2015; Research Analyst: INH000000412 . AMFI: ARN .: 146822. IRDA Corporate Agent – CA0579. Motilal Oswal Financial Services Ltd. is a distributor of Mutual Funds, PMS, Fixed Deposit, Insurance, Bond, NCDs and IPO products. Customer having any query/feedback/ clarification may write to query@motilaloswal.com. In case of grievances for any of the services rendered by Motilal Oswal Financial Services Limited (MOFSL) write to grievances@motilaloswal.com, for DP to dpgrievances@motilaloswal.com.