1. Research Journal of Biotechnology Vol. 10 (7) July (2015)
Res. J. Biotech
105
RAPD and ISSR based Intra-specific molecular genetic
diversity analysis of Cymbopogon flexuosus L. Stapf
with a distinct correlation of morpho-chemical
observations
Saikia Debajit, Dutta Sukriti, Ghosh Sneha, Lal Mohan* and Bhau Brijmohan Singh
Division of Medicinal Aromatic and Economic Plants, CSIR-North-East Institute of Science and Technology (CSIR-NEIST),
Formerly Regional Research Laboratory - Jorhat,, Council of Scientific and Industrial Research (CSIR), Jorhat 785 006, Assam, INDIA
*drmohanlal80@gmail.com
Abstract
Cymbopogon flexuosus L. Stapf is a valuable
medicinal plant that belongs to the family Poaceae. In
this report, genotypic and phenotypic variations
among 12 genotypes of C. flexuosus were assessed
based on three marker systems namely morphological,
biochemical and molecular markers i.e. Random
Amplified Polymorphic DNA (RAPD) and Inter-simple
sequence repeat (ISSR). Through this study we are
trying to develop a fine relationship among the
germplasm by correlating the genotypic and
phenotypic data with respect to betterment of essential
oil quality and quantity. The UPGMA dendrogram
constructed from compiled ISSR and RAPD analysis
shows highest dissimilarity between genotype RLJ-M3
and RLJ-M10 (0.57) and the highest similarity
between genotype RLJ-M7 and RLJ-M9 (0.90).
Keywords: Cymbopogon flexuosus, RAPD, morpho-
chemical, genetic diversity, intra-specific.
Introduction
The genus Cymbopogon flexuosus (Poaceae) is a tall
perennial aromatic grass, though restricted in its
distribution to selected patches of subtropical parts of Asia,
Africa and America, has acclaimed significant global
demand because of its varied range of applications in
different industries. Among 140 species of the genus
reported, more than 52 have been from Africa, 45 from
India, 6 each in Australia and South America, 4 in Europe,
2 in North America and the remaining are distributed in
South Asia12
. It is used as a starting material for synthesis
of Vitamin A, in aromatherapy and in perfumery and
flavourful grass, has therapeutic properties and is used
internally as a medicinal tea.8,20
Despite the significant variations in the essential oil
composition, Cymbopogon species and cultivars are
morphologically indistinguishable16
. The significant
variation of morphology and oil characteristics of various
species and varieties of Cymbopogon is not sufficient to
conclude precisely the relatedness among the morphotypes
and chemotypes. The identification of different
varieties/cultivars/germplasm based on morphological traits
implies culture inspection at different stages and is not
reliable because many traits are governed by complex
genetic interactions.
Molecular markers based on DNA sequences offer means
of identification with much greater reliability than the
morphological traits.2,16
DNA markers such as RAPD,
ISSR provide extensive polymorphism at DNA level used
for differentiating closely related genotypes which help to
find out the extent of genetic diversity. RAPD and ISSR
markers have already been successfully used on other
medicinal and aromatic crops.4,5,13,14,28
Like RAPD
markers, ISSR markers are extensively used for fingerprint
between the individuals. ISSR technique is a powerful,
rapid, simple, reproducible and inexpensive way to assess
genetic diversity or to identify closely related cultivars in
many plant species.5,9
In this present study we tried to estimate the extent of intra
species genetic diversity by using the potentials of RAPD
and ISSR marker analysis in relation to chemo-variation
observed in oil constituents among 12 different genotypes
of Cymbopogon flexuosus. With respect to morphological
characterizations, we have also tried to find out a fine
relationship among the various morphotypes, chemotypes
and genotypes of the 12 genotypes, which may help in
further improvement of the species for better quality and
quantity of essential oil. Polygenetic relationships have
been established among the 12 genotypes of Cymbopogon
flexesus with the help of RAPD and ISSR analysis.
Material and Methods
Plant Materials: Cymbopogon flexuosus plants were
grown in the experimental farm of CSIR-Northeast Institute
of Science and Technology (NEIST), Jorhat, India.
Selection of the lines on the base of different
morphologically and high oil yield lines and 12 genotypes
of Cymbopogon flexuosus L. Stapf (named as RLJ-M1,
RLJ-M2, RLJ-M3, RLJ-M4, RLJ-M5, RLJ-M6, RLJ-M7,
RLJ-M8, RLJ-M9, RLJ-M10, RLJ-M11, RLJ-M12) from
the experimental farm was used in this study. Each
accession was vegetative propagated from the tussocks and
maintained in the experimental farm.
Morphological analysis: The assessment of variability
through genetic parameters as well as molecular level in
selected genotypes of C. flexuosus L. Stapf was studied at
Research Farm CSIR-NEIST, Jorhat, Assam, India. The 12
2. Research Journal of Biotechnology Vol. 10 (7) July (2015)
Res. J. Biotech
106
genotypes of lemongrass were grown in a Complete
Randomized Block Design with 3 replications in a plot size
of 3m x 3m with spacing of 60 cm between rows and 60 cm
between plants. Standard cultural practices were followed
to raise a good crop.
Morphological study of the 12 genotypes of Cymbopogon
flexuosus was done through naked eyes. Data were
recorded on the basis of number of leaves/plant, leaf
breadth (cm), length of leaves (cm), length of spike (cm),
vegetative plant height (cm), number of tillers/bush and
number of internodes on main stem. Herbage yield was
estimated on the basis of 4 cutting of whole plot in the year
and total amount of the herbage yield was calculated in
tones per year. The essential oil was extracted from pooled
areal parts of the ten randomly selected plants from the plot
(in the month of July) analysed by hydro-distillation of
Clevenger apparatus. Yield in term of oil percentage was
calculated as the mean of 3 samples. The oil content was
estimated on fresh weight basis.
DNA extraction and PCR amplification: Tender young
leaf samples of the 12 genotypes of C. flexuosus were
collected for DNA extraction. Among different methods of
DNA isolation, rapid isolation of DNA15
with slight
modification was found to be the most efficient protocol. A
total of 13 random RAPD primers (RPI, Bangalore genei,
Bangalore) and 4 random ISSR primers (e-oligoes) were
selected for genetic diversity analysis after preliminary
primer screening. RAPD analysis was carried out with final
volume of 25 μL containing 30 ng DNA, 1.5 µl 2.5 mM
dNTPs, 2.5 mM 10X Buffer A with 15 mM MgCl2, Water
(Protease, RNase, DNase free), 1.5 μl Taq DNA
polymerase (1U/1 μl) and 5 pmol primers (Bangalore
Genei, Bangalore).
The amplification reaction was carried out in a Veriti 96
well Thermo Cycler (Applied Biosystem) using 94 °C for 3
min (initial denaturation) followed by 35 cycles of
amplification (95 °C for 54 sec- denaturation, 45 °C for 45
sec- annealing and 72 °C for 2 min- extension) and 72 °C
for 10 min for final elongation. ISSR analysis was carried
out with final volume of 25 μL containing 25ng DNA, 2 µl
2.5 mM dNTP, 2.5 mM 10X Buffer A with 15 mM MgCl2,
Water (Protease, RNase, DNase free), 1.7μl Taq DNA
polymerase (1U/1 μl) and 1.3 μl of 50 ng/μl primers (e-
oligos, RRL-ISSR PRI Jan 8, 2008). All PCR products
were separated on 1.5% (w/v) agarose gel containing
ethidium bromide. The gel carrying the amplified bands
was documented with the help of a gel Doc system (G:
BOX, Syngene, UK) for scoring of the bands (Figure 1).
Data analysis: The morphological data were analysed by
calculating analysis of variance for different characters of
the 12 genotypes as shown in the table 1. RAPD and ISSR
profiles were analyzed by scoring of amplicons obtained
from different microsatellite primers in the presence and
absence of bands as present (1) or absent (0) for all the 12
genotypes. The data in binary format were used to compute
pair wise similarity coefficient matrix for phylogenetic
analysis utilizing the SIMQUAL (similarity for quantitative
data) method in NTSYSpc software. The genetic distance
was calculated by the similarity coefficient of Jacccard.
The average similarity matrix was used to generate a tree
for cluster analysis based on dendrogram constructed by
UPGMA (Unweighted Pair Group Method with Arithmetic
average).
Results
Analysis of morphological profile: Morphologically all
the 12 genotypes under study showed profound variation in
their morphological characters (Table 1). Lemon grass
genotype RLJ-M8 showed maximum number of
leaves/plant (2420), Vegetative plant height (198 cm), No.
of tillers/bush (101) and Herbage yield (90.30 tons/ha)
respectively. On the other hand the maximum number of
characters like No. of leaves/plant, No. of tillers/bush and
Herbage yield tons/ha showed the lowest value in genotype
RLJ-M12. The highest value of oil yield percentage was in
RLJ-M6 (0.81%) and the lowest value was in RLJ-M11
(0.33%). RLJ-M3 showed the highest value (160 cm) of
leaves length and lowest value of leaf breadth (1.0 cm) and
vegetative plant height (129 cm).
Analysis of RAPD and ISSR profiles: Intra-specific
genetic polymorphism and similarities of 12 genotypes of
C. flexuosus were analyzed by RAPD and ISSR analysis.
13 positive RAPD primers (from 25 primers tested)
produced a total number of 98 scorable loci of which 81
(82.65%) were polymorphic and 17 (17.34%) were
monomorphic (Table 4). However 4 ISSR primers (from 25
primers tested) produced 59 scorable loci showing 93.22%
polymorphism against 4 (6.78%) monomorphic loci (Table
5). The overall percentage of polymorphism from both
RAPD and ISSR analysis was found to be 86.62% against
13.37% monomorphism. These polymorphic amplified loci
together were able to distinguish the different genotypes
from each other. In this RAPD and ISSR analysis, the
binary data obtained was used for construction of
dendrogram based on UPGMA cluster analysis to find out
the genetic relationship among the genotypes.
RAPD profile analysis: Based on RAPD markers alone,
the similarity index values ranged from 0.52 to 0.90 and the
dendrogram generated from UPGMA cluster analysis
grouped the 12 genotypes into 5 main clusters (Figure 2).
Genotype RLJ-M1 grouped in one cluster D1 and appeared
to be distinct from all others. Cluster D2 comprised 8
genotypes which were further grouped into 3 sub-clusters.
The first sub-cluster comprised RLJ-M2, RLJ-M4, RLJ-
M7, and RLJ-M9. Second sub-cluster comprised RLJ-M5
and the third sub cluster consisted of RLJ-M6, RLJ-M11
and RLJ-M12. Genotypes RLJ-M4 and RLJ-M7 of cluster
D2 appeared to be closest to each other with a 0.90
similarity coefficient. Genotype RLJ-M8, RLJ-M10 and
RLJ-M3 formed 3 separate simplicifolious line C2, B2 and
3. Research Journal of Biotechnology Vol. 10 (7) July (2015)
Res. J. Biotech
107
A
A2 respectively showing dissimilarity with other genotypes
studied.
ISSR profile analysis: From UPGMA cluster analysis of
ISSR data a dendrogram was shown in the figure 3,
Jaccard’s similarity coefficient ranged from 0.49 to 0.96. 2
broad clusters A and B formed the dendrogram of 12
genotypes. Within cluster A, 4 sub-clusters were formed
where third and forth sub-cluster, genotype RLJ-M8 and
RLJ-M2 grouped in 2 different simplicifolious lines
appeared to be distinct from all others. The first one was
genotype RLJ-M1 and second formed a group with
genotypes RLJ-M3, RLJ-M4 and RLJ-M12. On the other
hand cluster B also formed 4 sub-clusters where first one
was genotype RLJ-M5 and second was grouped by
genotypes RLJ-M10 and RLJ-M11. The third sub-cluster
formed simplicifolious lines with genotype RLJ-M6
whereas the last one consisted with the closest group of
genotypes RLJ-M7 and RLJ-M9 with a similarity
coefficient 0.96.
Combined RAPD and ISSR profile analysis: For
UPGMA cluster analysis the data obtained from RAPD and
ISSR were combined. The dendrogram generated from the
UPGMA cluster analysis of combined RAPD and ISSR
data gave similar clustering pattern with Jaccard’s
similarity coefficient ranging from 0.57 to 0.90. The
Jaccard’s similarity coefficient indicates that the genotype
RLJ-M7 was most closely associated with genotype RLJ-
M9 and also a close association was obtained between
genotype RLJ-M4 and genotype RLJ-M7. However
genotype RLJ-M3 was distinctly associated with genotype
RLJ-M10. The UPGMA dendrogram of the 12 genotypes
as shown in the figure 4 was arranged as one
simplicifolious and as one broad group named as A1 and
A2. The simplicifolious one (A1, genotype RLJ-M3)
showed a very much distinct relationship (dissimilarity)
from the rest and the other group (A2) formed 2 clusters B1
and B2 where B1 consisted with genotype RLJ-M2 and
RLJ-M8.
Within cluster B2, 5 sub-clusters were formed and genotype
RLJ-M1 grouped in first sub-cluster and appeared to be
distinct from all others. The second sub-cluster consisted of
genotype RLJ-M4, RLJ-M7 and RLJ-M9 whereas as third
one was RLJ-M5. RLJ-M6. RLJ-M11 and RLJ-M12
consisted of forth sub cluster and the last one RLJ-M10 was
immerged as a distinct line from the others. The pair wise
similarity coefficient matrix indicates that the lowest
similarity was between genotype RLJ-M3 and genotype
RLJ-M10 (0.57) and the highest similarity was observed
between genotype RLJ-M7 and genotype RLJ-M9 (0.90)
(Table 3).
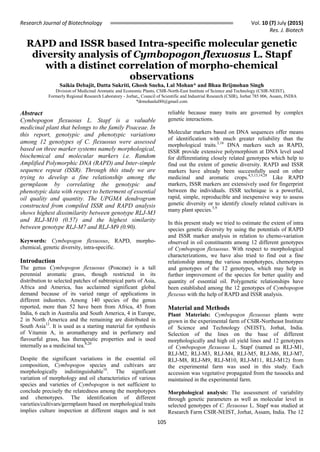
Figure 1: Description of RAPD and ISSR profiles showing 12 genotypes using one marker each RPI-1
for RAPD and 841 for ISSR. A. RAPD marker RPI-2, B. ISSR marker 841.
B
4. Research Journal of Biotechnology Vol. 10 (7) July (2015)
Res. J. Biotech
108
Figure 2: Dendrogram generated using UPGMA cluster analysis of RAPD markers (98 loci) showing genetic
relationship (SM coefficient) among 12 genotypes (RLJ-M1 to RLJ-M12) of C. Flexuosus.
Figure 2: Dendrogram generated using UPGMA cluster analysis of ISSR markers (59 loci) showing genetic
relationship among 12 genotypes (RLJ-M1 to RLJ-M12) of C. Flexuosus.
Coefficient
0.50 0.60 0.71 0.81 0.91
1
2
4
7
9
5
6
11
12
8
10
3
Figure 2: Dendrogram generated using UPGMA cluster analysis of RAPD markers (98
loci) showing genetic relationship (SM coefficient) among 12 genotypes (RLJ-M1 to
RLJ-M12) of C. flexuosus.
RLJ-M1
RLJ-M2
RLJ-M4
RLJ-M7
RLJ-M9
RLJ-M5
RLJ-M6
RLJ-M11
RLJ-M12
RLJ-M8
RLJ-M10
RLJ-M3A2
A1
B2
B1
C1
C2
D2
D1
Coefficient
0.50 0.62 0.73 0.85 0.97
1
3
4
12
8
2
5
10
11
6
7
9
Figure 3: Dendrogram generated using UPGMA cluster analysis of ISSR markers (59
loci) showing genetic relationship among 12 genotypes (RLJ-M1 to RLJ-M12) of C.
flexuosus.
B
A
RLJ-M1
RLJ-M3
RLJ-M4
RLJ-M12
RLJ-M8
RLJ-M2
RLJ-M5
RLJ-M10
RLJ-M11
RLJ-M6
RLJ-M7
RLJ-M9
5. Research Journal of Biotechnology Vol. 10 (7) July (2015)
Res. J. Biotech
109
Figure 2: Dendrogram generated using UPGMA cluster analysis of ISSR + RAPD markers (157 loci) showing genetic
relationship among 12 genotypes (RLJ-M1 toRLJ-M12) of C. Flexuosus.
Table 1
Details of the morphological characteristics of 12 different genotypes of Cymbopogon flexuosus used in the study
Figure 4: Dendrogram generated using UPGMA cluster analysis of ISSR+RAPD
markers (157 loci) showing genetic relationship among 12 genotypes (RLJ-M1 to RLJ-
M12) of C. flexuosus.
B2
B1
Table 1. Details of the morphological characteristics of 12 different genotypes of
Cymbopogon flexuosus used in the study.
Sl.
No.
Characters RLJ-M1 RLJ-
M2
RLJ-
M3
RLJ-
M4
RLJ-
M5
RLJ-
M6
RLJ-
M7
RLJ-
M8
RLJ-
M9
RLJ-
M10
RLJ-
M11
RLJ-
M12
Highest
value
Lowest
value
1 No. of leaves/plant 938 1204 1680 960 890 1624 1220 2420 1150 1110 980 789 2420 789
2 Leaf breadth (cm) 1.2 1.2 1.0 1.4 1.6 1.8 1.4 1.5 1.9 2.1 2 1.7 2.1 1.0
3 Length of
leaves(cm)
145 143 160 157 140 104 129 138 158 120 110 145 160 104
4 Length of
spike(cm)
82 84 92 112 86 76 60 80 89 98 110 103 112 60
5 Vegetative plant
height(cm)
165 159 129 142 155 172 174 198 192 168 158 173 198 129
6 No. of tillers/bush 79 68 78 62 96 55 49 101 56 75 61 41 101 41
7 No. of internodes
on main stem
5 6 7 5 7 8 7 6 5 7 8 8 8 5
8 Oil yield % (w/v) 0.55 0.52 0.76 0.65 0.45 0.81 0.55 0.75 0.46 0.52 0.33 0.42 0.81 0.33
9 Herbage yield
tones/ha
65.25 64.23 82.10 65.00 69.00 42.00 75.65 90.30 73.14 61.30 64.30 42.00 90.30 42.00
6. Research Journal of Biotechnology Vol. 10 (7) July (2015)
Res. J. Biotech
110
Table 2
Analysis of variance for different morphological characters in 12 genotypes of Cymbopogon flexuosus
Table 3
Pair wise genetic similarity between 12 genotypes of Cymbopogon flexuosus based on
Jaccard’s coefficients from combined ISSR and RAPD analysis (157 loci).
Table 2: Analysis of variance for different morphological characters in 12 genotypes of
Cymbopogon flexuosus
Sl. No. Characters Treatment sum of
square
CV Mean
1 No. of leaves/plant 26.205** 2.69 1247.08
2 Leaf breadth 22.258** 2.78 1.56
3 Length of leaves 0.925** 3.16 137.41
4 Length of spike 4.330** 4.96 89.33
5 Vegetative plant h8 (cm) 9.698** 5.86 165.41
6 No. of tillers/bush 9.322** 5.40 68.41
7 No. of internodes on main stem 6.48** 2.10 6.58
8 Oil yield % (w/v) 5.34* 2.02 0.56
9 Herbage yield tones/ ha 2.405** 6.15 70.35
** Significant at P=0.01 level and * Significant at P=0.05 level
Table 3: Pair wise genetic similarity between 12 genotypes of Cymbopogon flexuosus
based on Jaccard’s coefficients from combined ISSR and RAPD analysis (157 loci).
RLJ-M1 1.00
RLJ-M2 0.68 1.00
RLJ-M3 0.65 0.64 1.00
RLJ-M4 0.75 0.75 0.69 1.00
RLJ-M5 0.69 0.63 0.61 0.74 1.00
RLJ-M6 0.68 0.66 0.61 0.73 0.73 1.00
RLJ-M7 0.70 0.71 0.63 0.83 0.75 0.70 1.00
RLJ-M8 0.65 0.68 0.63 0.71 0.59 0.71 0.64 1.00
RLJ-M9 0.64 0.69 0.62 0.80 0.71 0.68 0.90 0.61 1.00
RLJ-M10 0.63 0.61 0.57 0.69 0.73 0.71 0.66 0.61 0.71 1.00
RLJ-M11 0.71 0.70 0.63 0.77 0.73 0.77 0.77 0.66 0.73 0.77 1.00
RLJ-M12 0.67 0.73 0.71 0.77 0.64 0.68 0.68 0.67 0.68 0.66 0.77 1.00
M1 M2 M3 M4 M5 M6 M7 M8 M9 M10 M11 M12
7. Research Journal of Biotechnology Vol. 10 (7) July (2015)
Res. J. Biotech
111
Table 4
Showing degree of polymorphism from RAPD data analysis of 13 RPI primers for 12 genotypes
Discussion
Genetic differences were highly significant for all the
characters indicating that there was sufficient variability in
the material under study; selection might be effective for
these characters (Table 2).
The genetic differences were highly significant for different
morphological characters studied. High heritability
estimates in broad sense were observed for all the
characters. High heritability with low genetic advance
recorded for oil and herbage yield contents indicated that
these characters are under non-additive gene action. These
observations were in agreement with the findings of Singh
and Singh26
and Singh et al.27
This might be due to the fact
that most of the genotypes were developed from a cross
pollinated population and thus might have included the
entire spectrum of variability at least for all the characters
under study.
On the other hand RAPD and ISSR markers are found to be
the most efficient in case of construction of a relationship
of C. flexuosus cultivars among other methods viz.
morphological and chemical method. The two marker
systems, ISSR and RAPD used in the present study have
also been used as effective tools to evaluate genetic
diversity and to throw light on the phylogenetic
relationships in Brassica napi, Allium sect. Sacculiferum7
,
Asimina tri- loba10,19
and Trigonella foenum-graecum6
.
RAPD marker was found to be more efficient in estimation
of molecular diversity of different genotypes of C.
flexuosus than ISSR marker as evident from large values of
polymorphic loci, PIC and average number of polymorphic
bands per primer. A possible explanation for the difference
in resolution of RAPDs and ISSRs is that the two-marker
techniques target different portions of the genome. RAPD
analysis in our study showed significant genetic variation in
the lemon grass genotypes.
Table 4: Showing degree of polymorphism from RAPD data analysis of 13 RPI primers
for 12 genotypes.
Primer Sequence (5’-3’) Number of
monomorphic
products
Number of
polymorphic
products
Total number of
amplified products
% of
polymorphism
RPI-2 AACGCGTCGG 2 5 7 71.42
RPI-17 AGGCGGGAAC 1 2 3 66.66
RPI-12 ACGGCAACCT 2 3 5 60
RPI-19 AGGTGACCGT 1 7 8 87.5
RPI-6 ACACACGCTG 0 5 5 100
RPI-23 CCAGCAGCTA 1 4 5 80
RPI-3 AAGCGACCTG 0 6 6 100
RPI-16 AGGCGGCAAG 0 9 9 100
RPI-18 AGGCTGTGTC 0 7 7 100
RPI-1 AAAGCTGCGG 2 11 13 84.61
RPI-10 AGCATGAGCG 2 7 9 77.77
RPI-14 ACTTCGCCAC 4 3 7 42.85
RPI15 ACCTGAAGCC 2 12 14 85.71
8. Research Journal of Biotechnology Vol. 10 (7) July (2015)
Res. J. Biotech
112
Ganjewala8
also concluded in his study that RAPD profiles
proved to be very useful tool in assessment of genetic
diversity at the intra-species level (in cultivars) in the three
representative selected cultivars of East Indian lemongrass.
The RAPD cluster analysis revealed marked similarities
among these cultivars indicating that they have a single
source of origin no matter whether they have likely or
unlikely essential oil composition. Our findings are in
contrary to the finding of Sarma et al24
who studied degree
of polymorphism in seed protein in different populations of
lemon grass. They reported no significant difference among
the populations of lemon grass using seed protein. The
RAPD and ISSR analysis result showed the genotypic
relationship of the closest association in genotype RLJ-M7
and genotype RLJ-M9 and the most diverse association or
polymorphism in genotype RLJ-M3 and genotype RLJ-
M10 of the 12 genotypes of C. flexuosus (Table 3). Hence,
the result of the preliminary RAPD method is capable of
revealing nuclear DNA variation in patchouli cultivars.
The high number polymorphic markers detected in this
study could be result of high diversity among the material
used. The utility of RAPD markers in estimating genetic
variability has been demonstrated in several studies on
medicinal and aromatic plants.4,8,13,14,17,28
In similar study,
Adawy et al1
estimated the genetic distance among four
Egyptian date palm cultivars based on ISSRs; this ranged
from 80.2% to 89.0%. Using ten ISSR primers, Ben Saleh
and El-Helaly3
calculated the molecular distance among 15
Tunisian costal date palm cultivars. The Kentand Garn
Gazel were the nearest varieties in the group with genetic
distance of 21.13% (dissimilarity) and Ftimi and Smiti
were the farthest with a genetic distance of comparative
studies of using compost combined 90.45%. These
inconsistency between the molecular and chemotypic
diversity observed among the accessions of lemongrass
species of present study suggests that genotype and
environment interactions also led to the diversification of
chemical constituents, other than genotypic
differences.22,23,25
As can be seen that this study is based on limited number of
molecular marker, which thought to be resolved a part of
functional diversity derived or not derived from genes
governing phytochemicals and hence further analysis with
more number of functional markers particularly from genes
involving in biosynthetic pathways of phytochemicals can
give better picture of genetic relationships among the
accessions of Cymbopogon in relation to phytochemicals.
With this study we can conclude that the molecular analysis
of different genotypes of C. flexuosus through ISSR and
RAPD fingerprinting provides a powerful tool for the
generation of potential diagnostic markers for cultivar
analysis. Knowledge of molecular marker aided genetic
diversity profiles, parallel to morphological and
biochemical relatedness and differences among the
Cymbopogon species could offer added advantages of
strategic combination of traits and exploitation of the
germplasm diversity. Such regional diversity may be
exploited for the generation for potential hybrid lines with
controlled breeding and hybridization strategies for
expression of agronomically useful traits. Therefore studies
on other chemotypic traits of wild counterparts and other
cultivated species and varieties of Cymbopogon along with
the use of combination of sensitive marker systems such as
AFLP and SCAR and SSLP should be considered to screen
and develop more suitable and tightly linked markers for
improved traits and its further utilization in plant
improvement and breeding programmes for exploitation of
genetic resources for the sake of commercial and academic
needs.
Acknowledgement
Authors are also thankful to Council of Scientific &
Industrial Research (CSIR), Govt. of India for financing the
network project (BSC-0110). Authors are also thankful to
Dr. S.C. Nath and Dr. P.R. Bhattacharyya, Chief Scientists,
MAEP Division and Director, CSIR-North East Institute of
Science & Technology (NEIST), Jorhat, India for their
consistent support and advice to carry out this work.
References
1. Adawy S.S., Ebtissam H.A.H., Saker M.M. and El-Itriby H.A.,
Intra-and Inter varietal variation of upper Egypt date palm
cultivars (Phoenix dactylifera L.), I. As revealed by RAPD and
ISSR markers, Proceed. Intl. Conf. Genet. Eng. & Appl., Sharm
El-Sheikh, South Sinai, Egypt (April 8-11, 2004), 165-179 (2004)
2. Adhikari S., Bandopadhyay T.K. and Ghosh P.D., Assessment
of genetic diversity of certain Indian elite clones of Cymbopogon
species through RAPD analysis, Indian Journal of Biotechnology,
12, 109-114 (2013)
3. Ben Saleh M. and El-Helaly R., Using ISSR to investigate the
similarities and dissimilarities between some Tunisian date palm
(Phoenix dactylifera L.) cultivars. International Conference on
Date Palm, Kingdom of Saudi Arabia, Ministry of Higher
Education, King Saud University, Qaseem branch, College of
Agriculture and Veterinary Medicine, (16-19 September 2003)
(2003)
4. Bharmauria V., Narang N., Verma V. and Sharma S., Genetic
variation and polymorphism in the Himalayan nettle plant Urtica
dioica based on RAPD marker, Journal of Medicinal Plant
Research, 3, 166–170 (2009)
5. Bhau B. S., Medhi K., Sarkar T. and Saikia S.P., PCR based
molecular characterization of Nepenthes khasiana Hook, f.-
pitcher plant, Genetic Resources and Crop Evolution, 56, 1183-
1193 (2009)
6. Dangi R.S., Lagu M.D., Choudhary L.B., Ranjekar P.K. and
Gupta V.S., Assessment of genetic diversity in Trigonella
foenum-graecum and Trigonella caerulea using ISSR and RAPD
markers, BMC Plant Biology, 4, 13 (2004)
7. Gang H., Dong-Hee L., Jung S.L. and Nam S.L., A study of
taxonomical relationship among species of Allium sect.
9. Research Journal of Biotechnology Vol. 10 (7) July (2015)
Res. J. Biotech
113
Sacculiferum (Alliaceae) and the related species using Inter
Simple Sequence Repeat (ISSR) markers, Botanical Bulletin of
Academia Sinica, 43, 63-68 (2002)
8. Ganjewala D., RAPD Characterization of 3 Selected Cultivars
OD-19, GRL-1 and Krishna of East Indian Lemongrass
(Cymbopogon flexuosus Nees ex Steud) Wats, American-
Eurasian Journal of Botany, 1, 53-57 (2008)
9. Gonzalez A., Coulson M. and Brettell R., Development of
DNA markers for characterization of closely related grapevine
germplasm, Euphytica, 101, 117-125 (2002)
10. Huang H., Layne D.R. and Kubisiak T.L., Molecular
characterization of cultivated pawpaw (Asimina triloba) using
RAPD markers, Journal of American Society of Horticulture
Science, 128, 85-93 (2003)
11. Husain A., Essential oil plants and their cultivation CIMAP,
Lucknow, Journal of Medicinal and Aromatic Plants, 25, 5-7
(1994)
12. Jagadishchandra K.S., Recent studies on Cymbopogon species
with special reference to Indian Taxa, Journal of Plantation
Crops, 3, 1–5 (1975)
13. Kasaian J., Behravan J., Hassany M., Emami S.A., Shahriari
F. and Khayyat M.H., Molecular characterization and RAPD
analysis of Juniperus species from Iran, Genetics and Molecular
Research, 10, 1069–1074 (2011)
14. Khan S., Mirza K.J. and Abdin M.Z., Development of RAPD
markers for authentication of medicinal plant Cuscuta reflexa,
Eur Asia Journal of Bio Sciences, 4, 1–7 (2010)
15. Khanuja S.P.S., Shasany A.K., Darokar M.P. and Kumar S.,
Rapid isolation of PCR amplifiable DNA from the dry and fresh
samples of plants producing large amounts of secondary
metabolites and essential oils by modified CTAB procedure,
Plant Molecular Biology Reporter, 17, 74-17 (1999)
16. Khanuja S.P.S., Shasany A.K., Pawar A., Lal R.K., Darokar
M.P., Naqvi A.A., Rajkumar S., Sundaresan V., Lal N. and
Kumar S., Essential oil constituents and RAPD markers to
establish species relationship in Cymbopogon Spreng, (Poaceae),
Biochemical Systematics and Ecology, 33, 171–186 (2005)
17. Lal R.K., Sharma J.R. and Mishra H.O., Genetic Diversity in
Germplasm of Vetiver Grass, Vetiveria zizanioides (L.) Nash ex
Small, Journal of Herbs Spices and Medicinal Plants, 5, 77– 84
(1997)
18. Patra N.K., Singh H.P., Kalra A., Singh H.B., Mengi N.,
Singh V.R., Naqvi A.A. and Kumar S., Isolation and
development of geraniol rich selection of citronella (Cymbopogon
winterianus), Journal of Medicinal and Aromatic Plant Sciences,
10, 672-676 (1997)
19. Pomper K.W., Crabtree S.B., Brown S.P., Jones S.C. and
Bonney T.M., Assessment of genetic diversity of Pawpaw
(Asimina Triloba) culti- vars with Inter Simple Sequence Repeat
markers, Journal of American Society of Horticultural Sciences,
128, 521-525 (2003)
20. Prasad M.P. and Shekhar S., Antimicrobial activity of
Cymbopogon Species against human pathogens and molecular
characterization by RAPD markers, Asian Journal of Biology and
Life Sciences, 2, 13-18 (2013)
21. Sangwan N.S., Farooqi A.H.A. and Sangwan R.S., Effect of
drought stress on growth and essential oil metabolism in
lemongrasses, New Phytologist, 128, 173-179 (1994)
22. Sangwan R.S., Singh-Sangwan N. and Luthra R., Metabolism
of acyclic monoterpenes: partial purification and properties of
geraniol dehydrogenase from lemongrass (Cymbopogon felxuosus
Stapf.) leaves, Journal of Plant Physiology, 142, 129-134 (1993)
23. Sangwan S.C. and Croteau R.B., Genomic organization of
plant terpene synthases and molecular evolutionary implications,
Genetics, 158, 811-832 (2001)
24. Sarma A., Sarma H., Sarma T.C. and Handique K., Screening
of essential oil obtained from inflorescence of lemongrass
[Cymbopogon flexuosus (Nees ex Steud.) Wats] accessions,
Indian Journal of Natural Products and Resources, 2, 236-241
(2011)
25. Shasany A.K., Lal R.K., Patra N.K., Darokar M.P., Garg A.,
Kumar S. and Khanuja S.P.S., Phenotypic and RAPD diversity
among Cymbopogon winterianus Jowitt accessions in relation to
Cymbopogon nardus Rendle, Genetic Resources and Crop
Evolution, 47, 553-559 (2000)
26. Singh O.P. and Singh T.P., Genetic variability among some
genotypes for morphological characters in lemongrass
(Cymbopogon flexuosus L. Stapf), Indian Perfumer, 43, 35-36
(1999)
27. Singh S.P., Singh H.P., Singh A.K. and Tiwari R.K., Genetic
variability and character association in lemongrass (Cymbopogon
flexuosus L. Stapf), Journal of Spices and Aromatic Crops, 14,
155-157 (2005)
28. Verma N., Koche V., Tiwari K.L. and Mishra S.K., RAPD
analysis reveals genetic variation in different populations of
Trichodesma indicum – A perennial medicinal herb, African
Journal of Botany, 8, 4333–4338 (2009).
(Received 10th
December 2014, accepted 28th
January
2015)
*****