Download to read offline
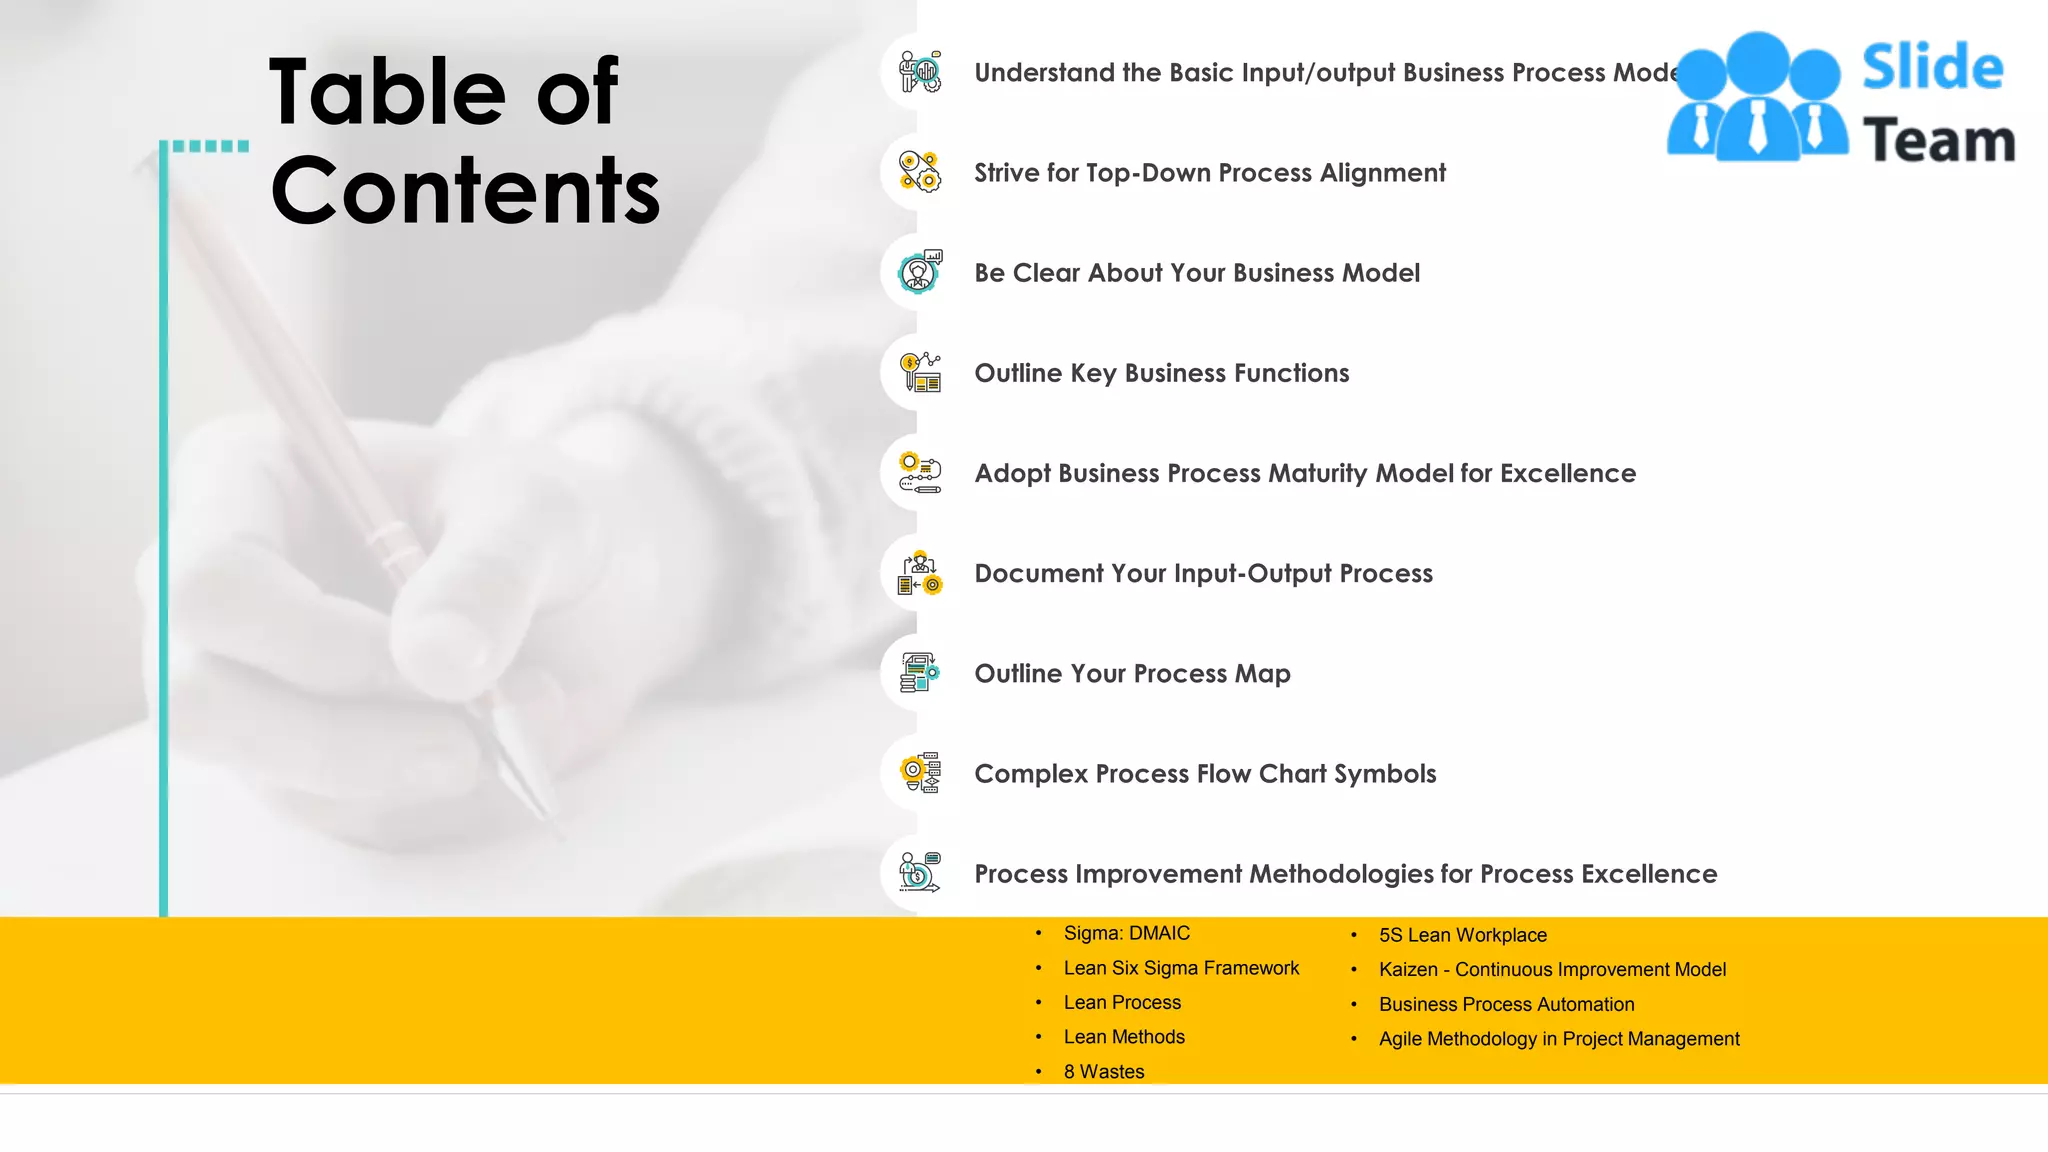
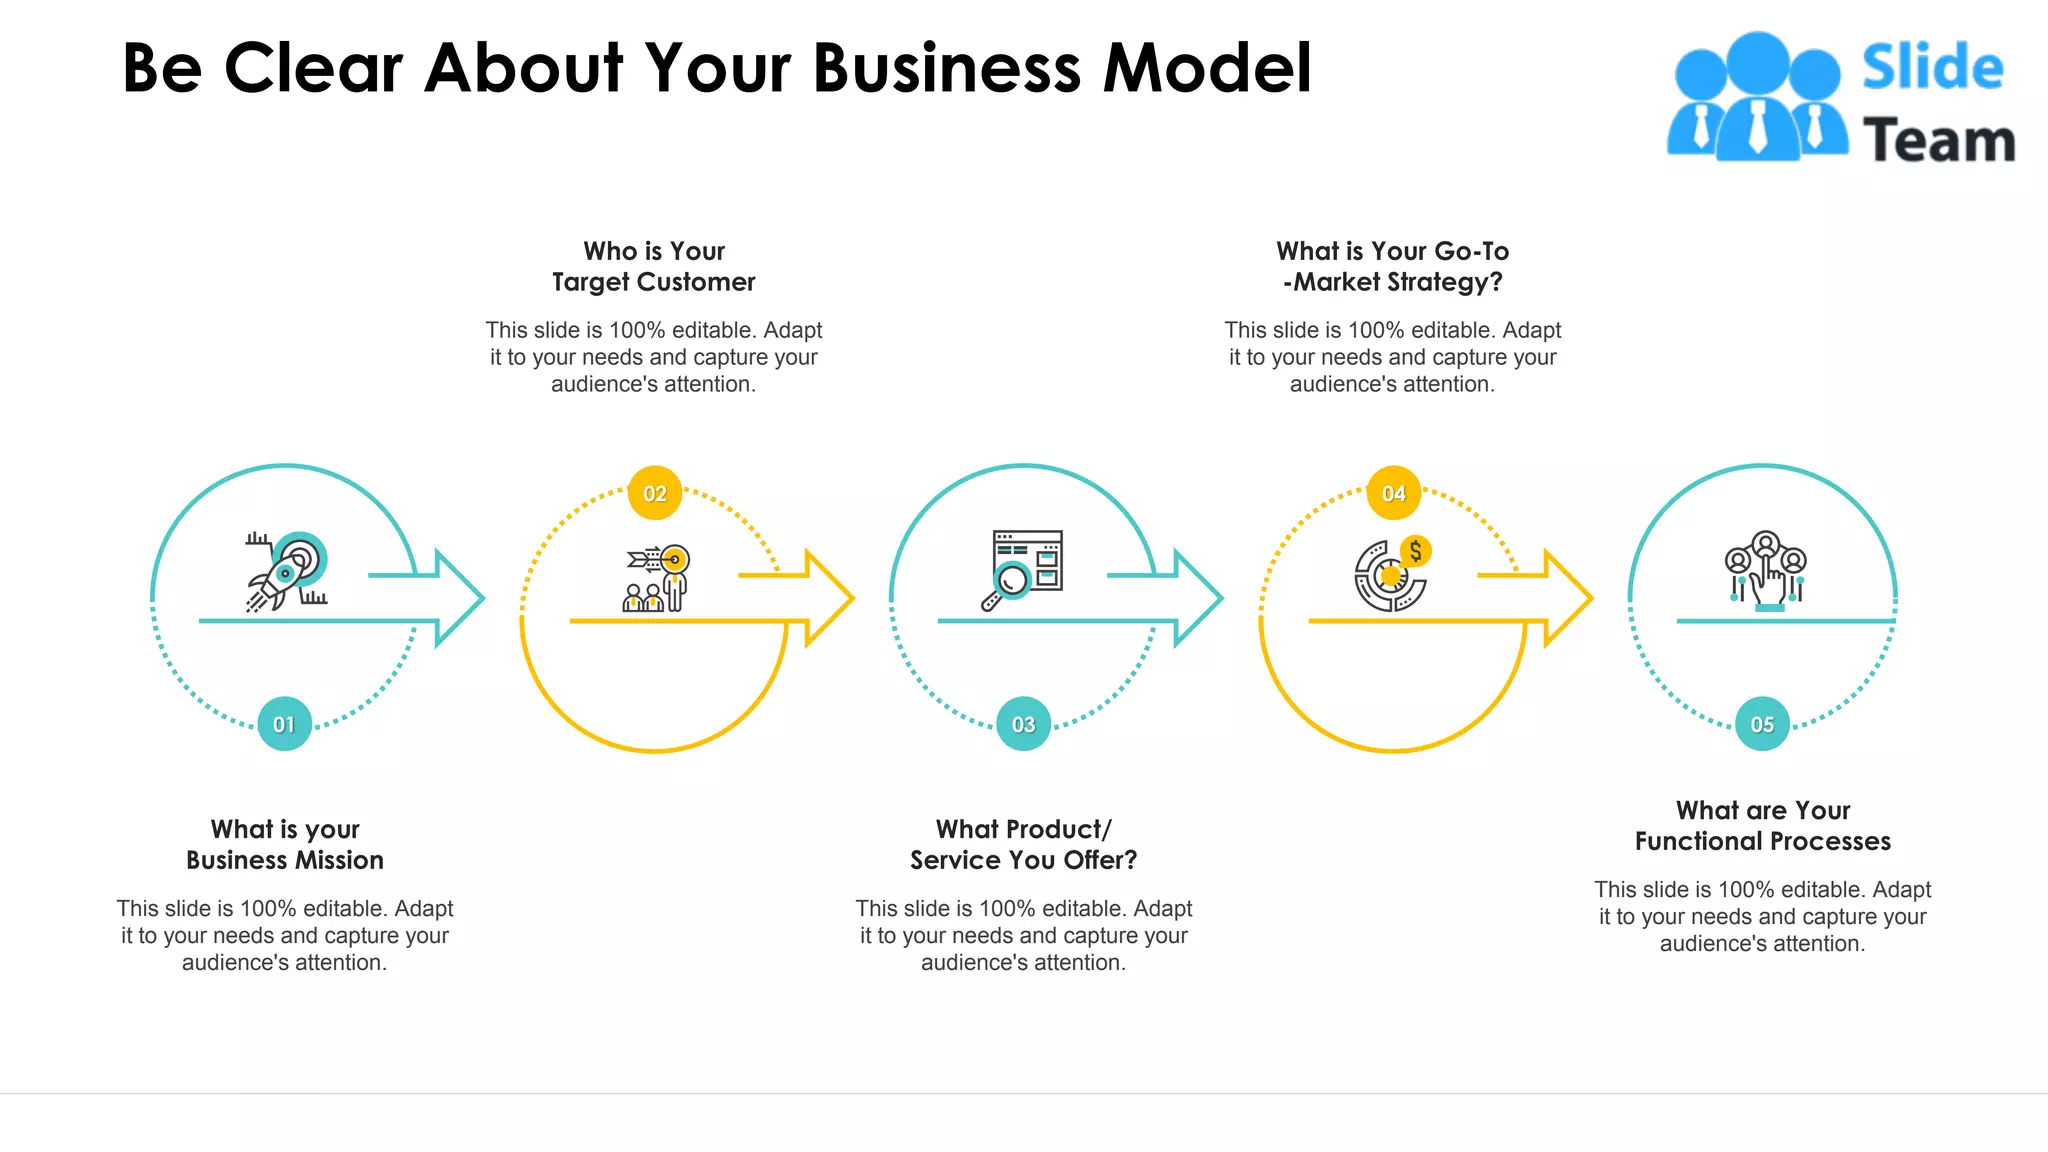
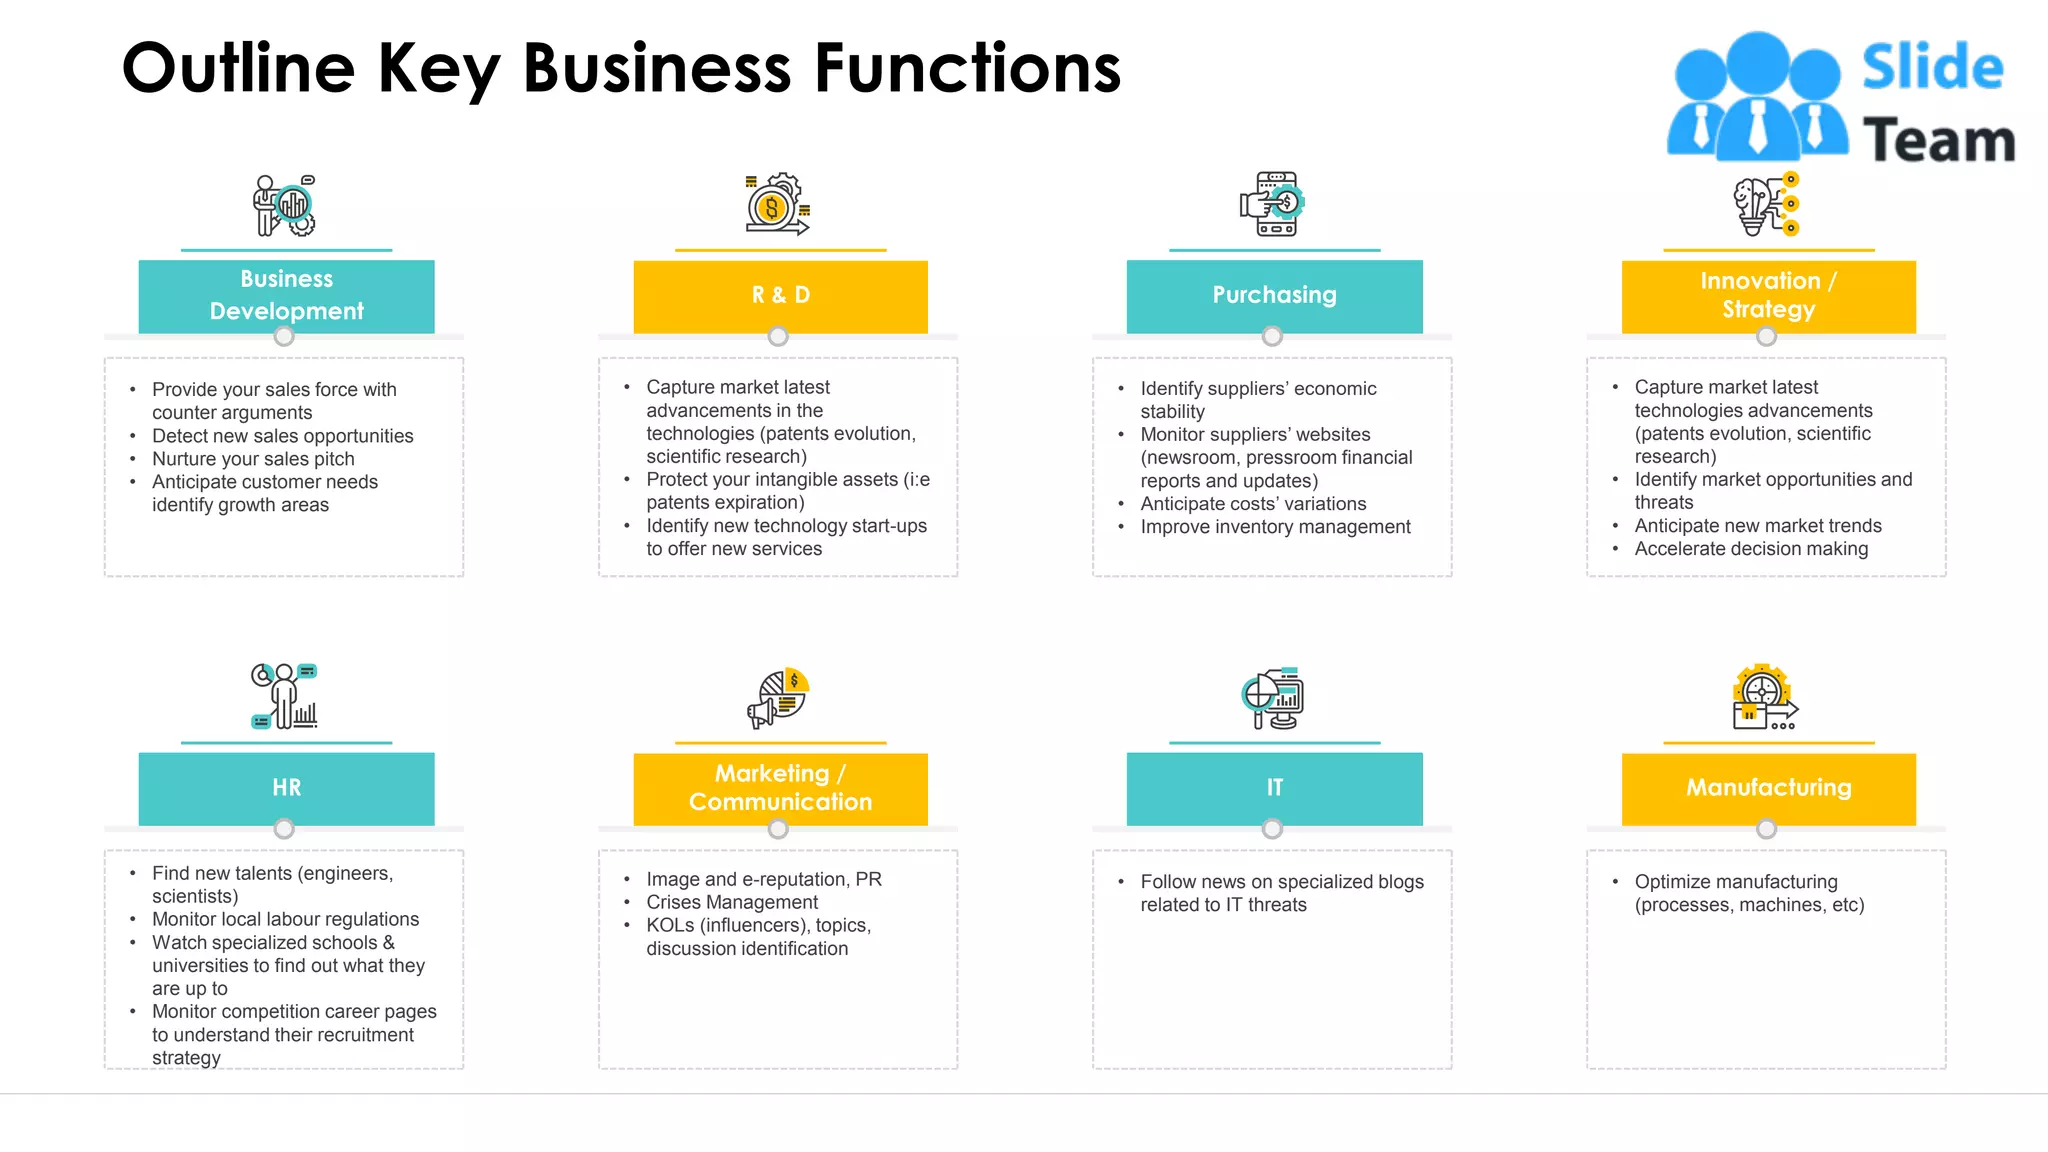
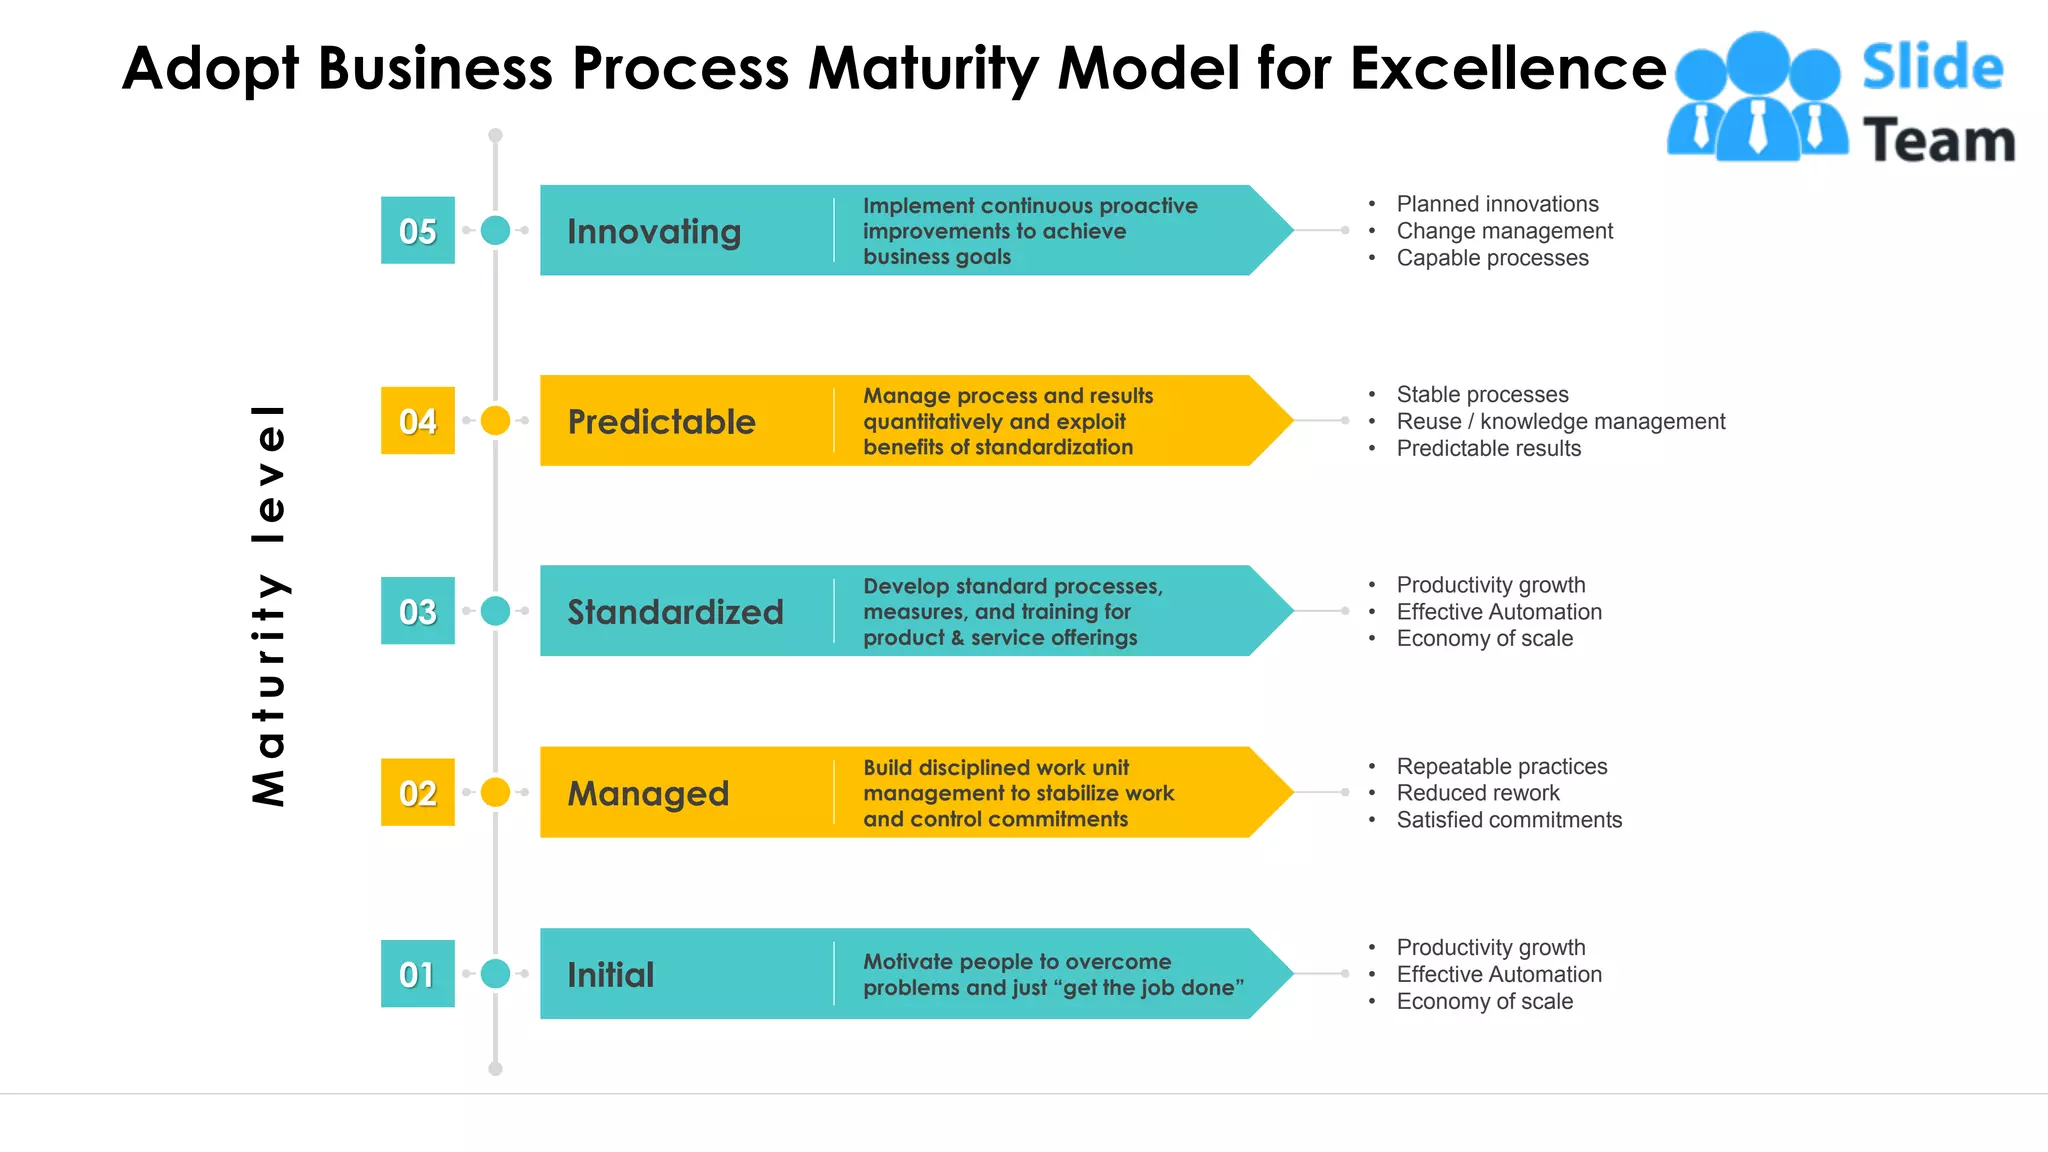
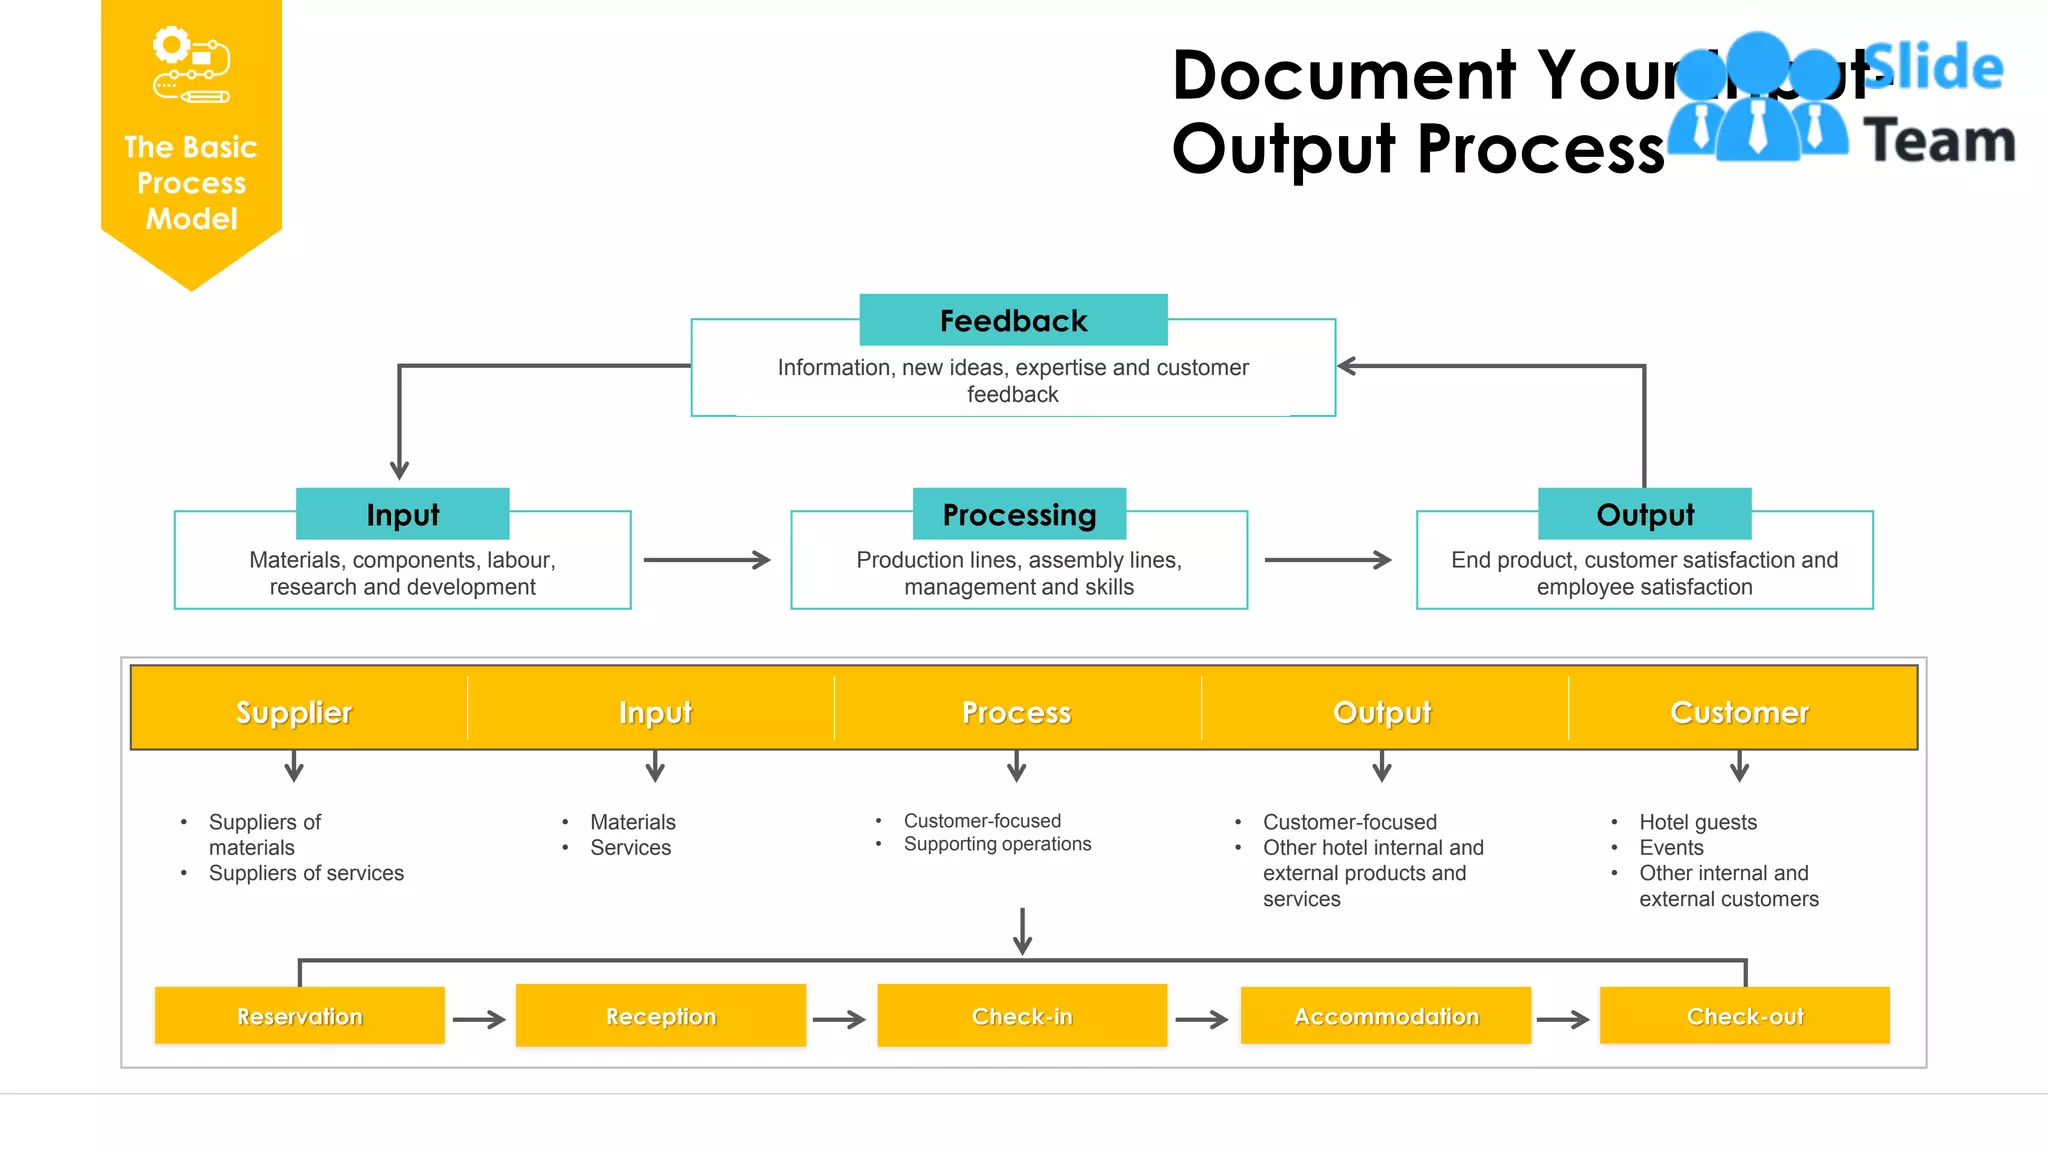
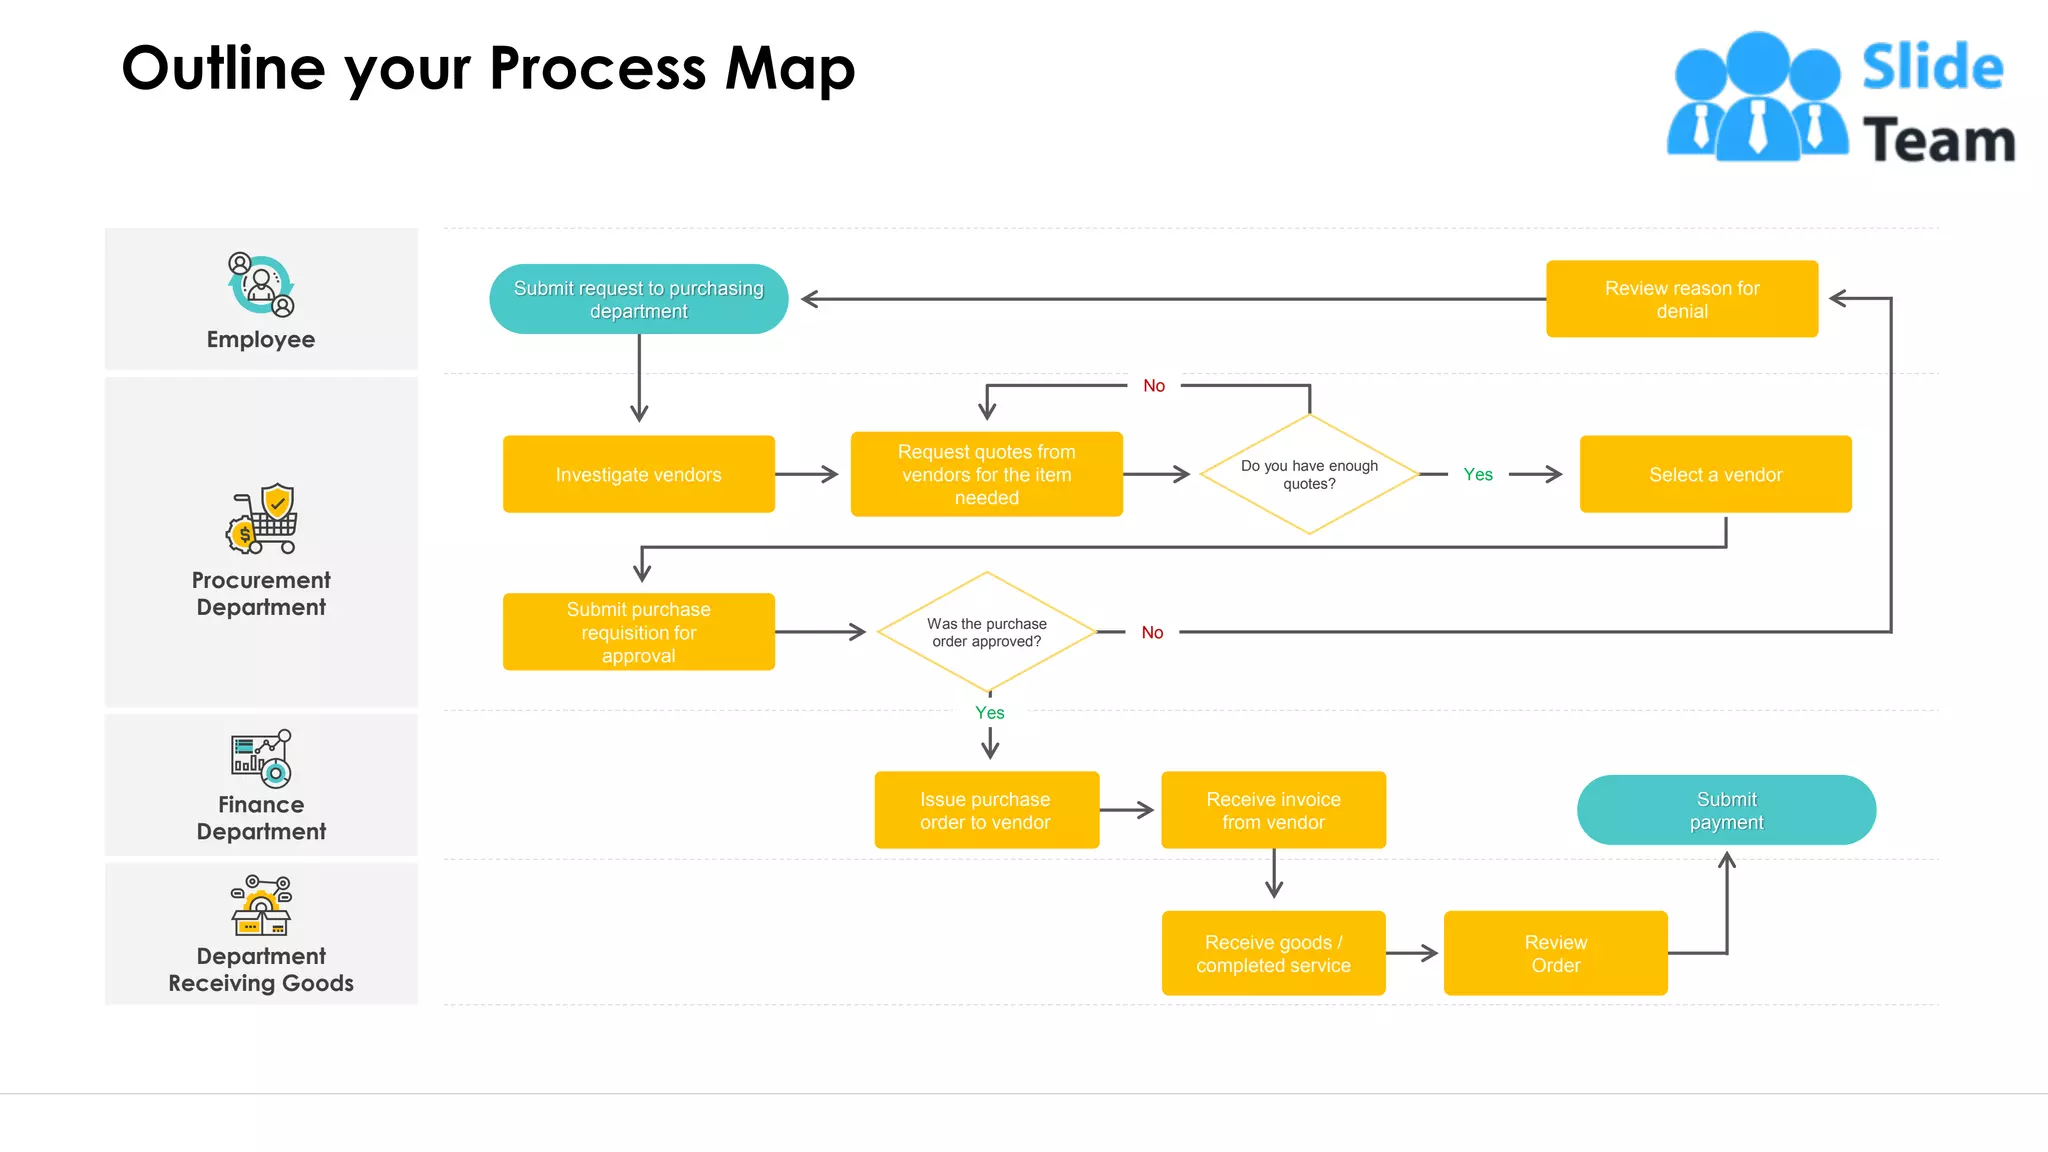
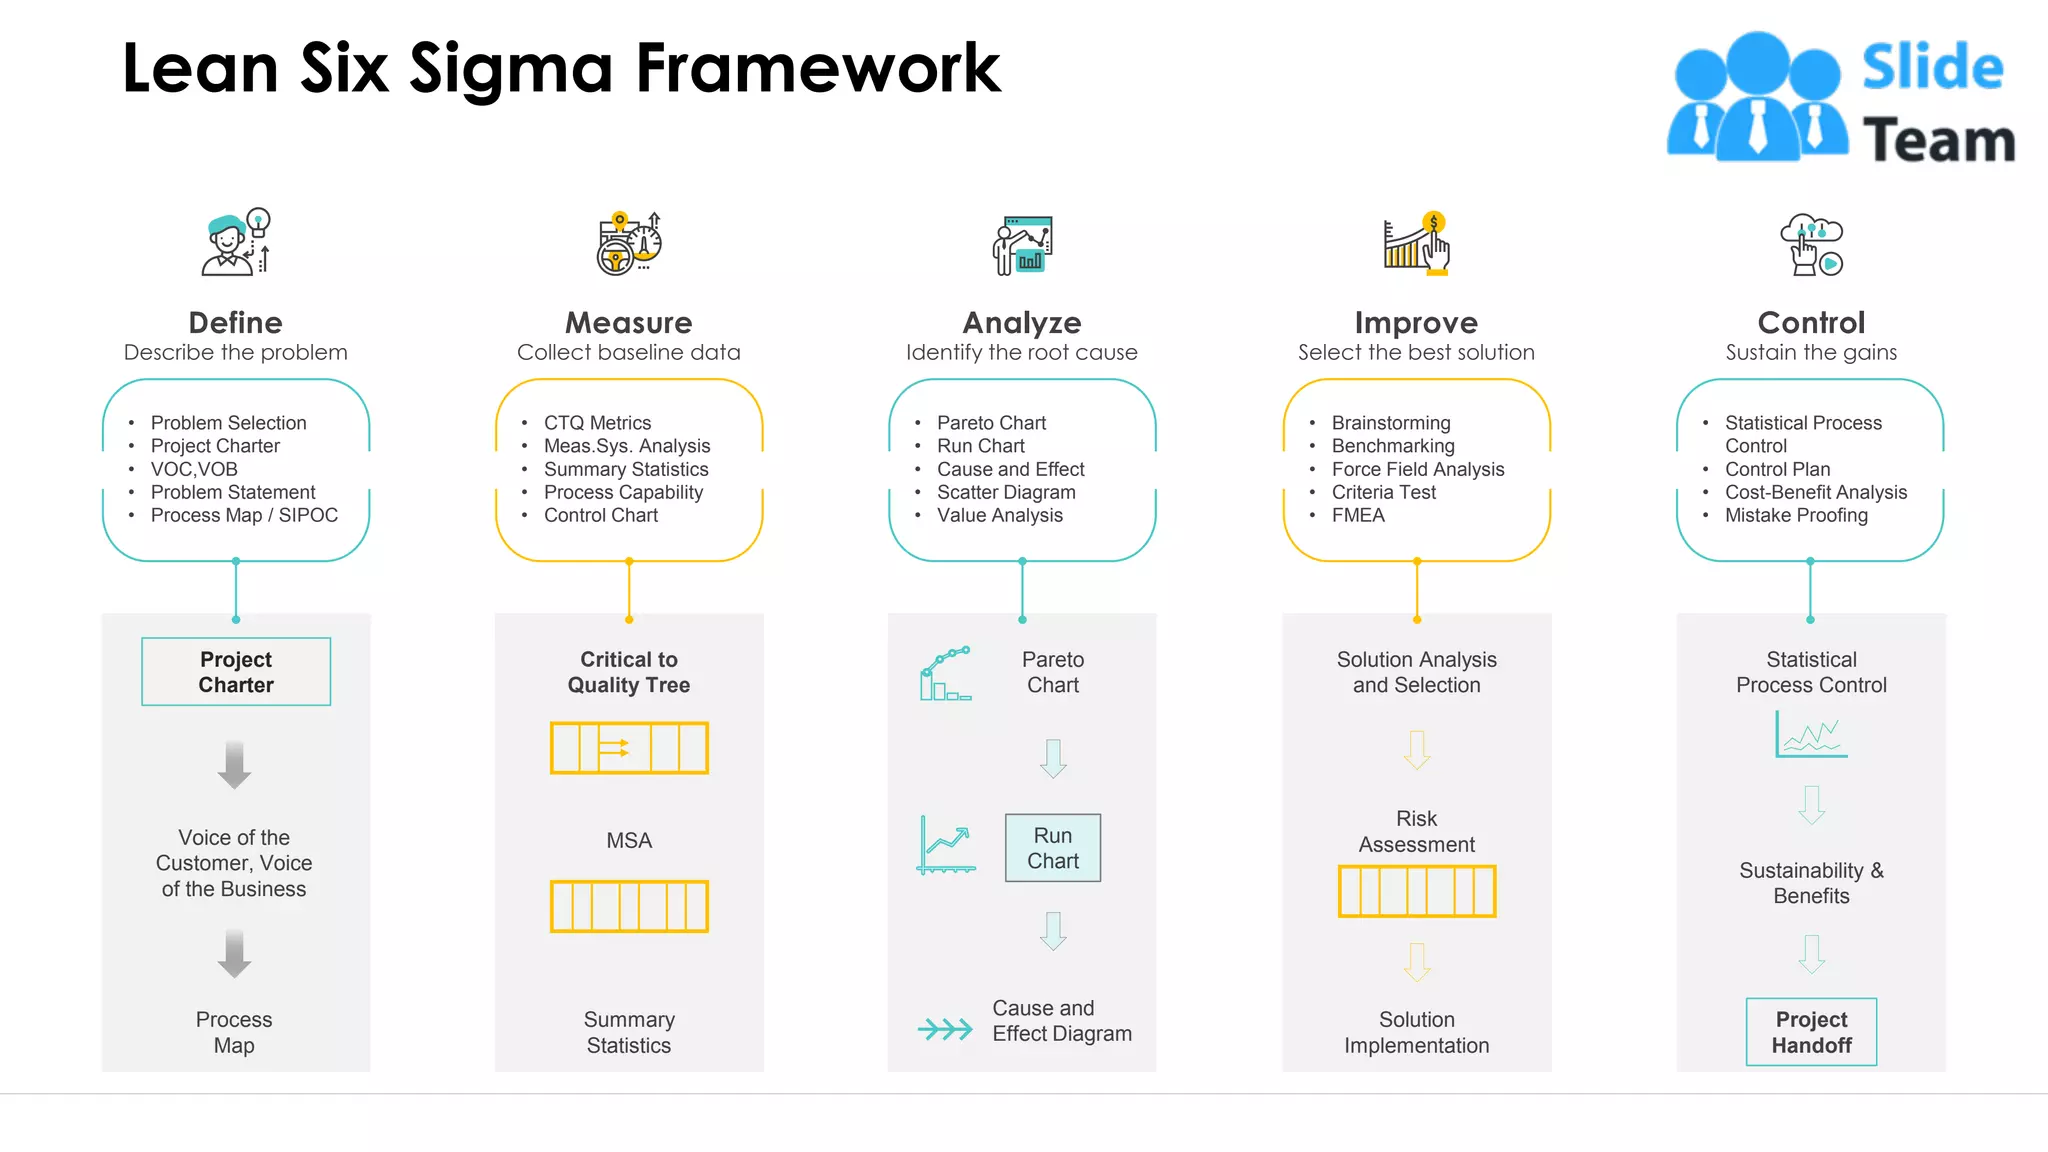
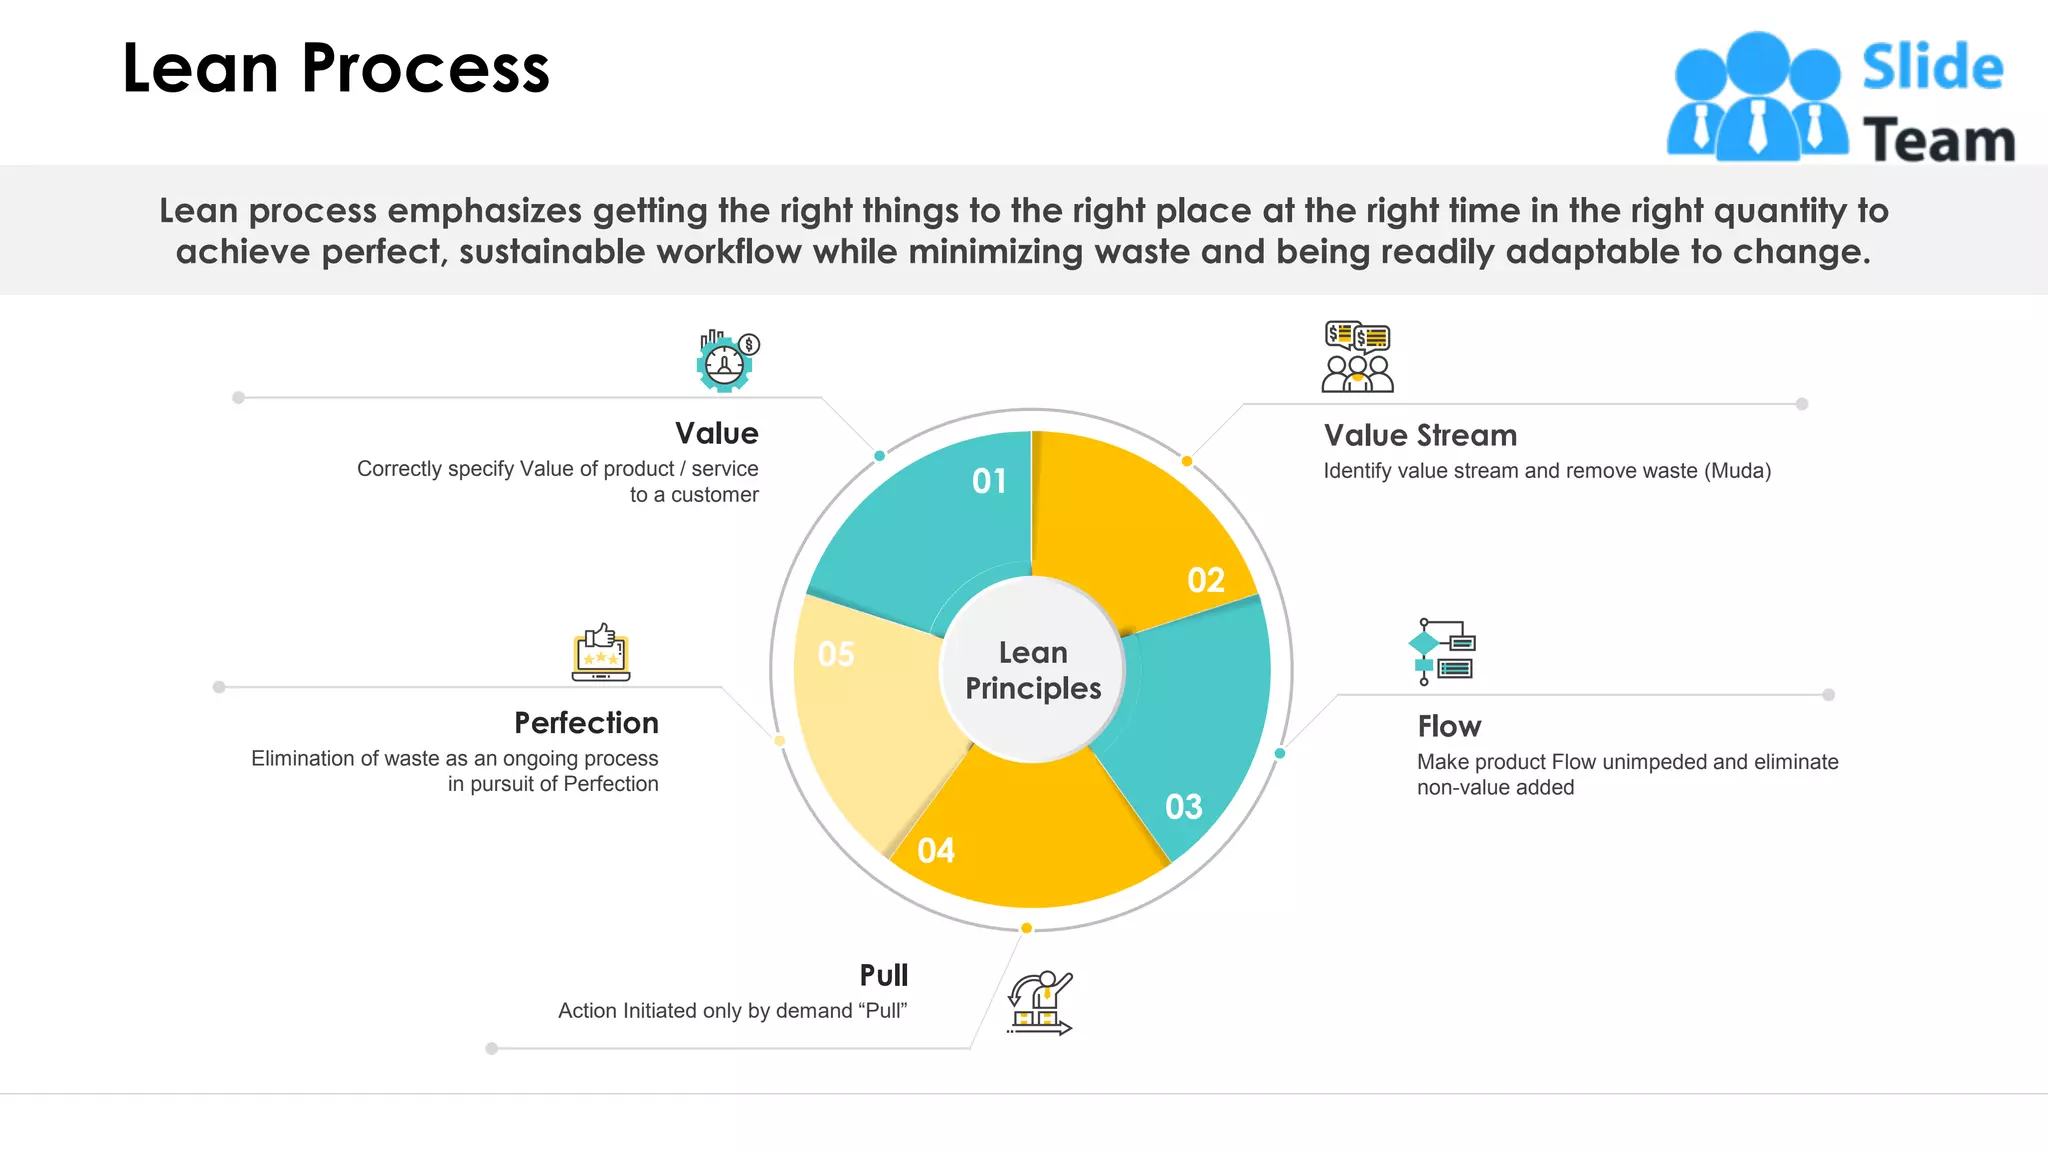
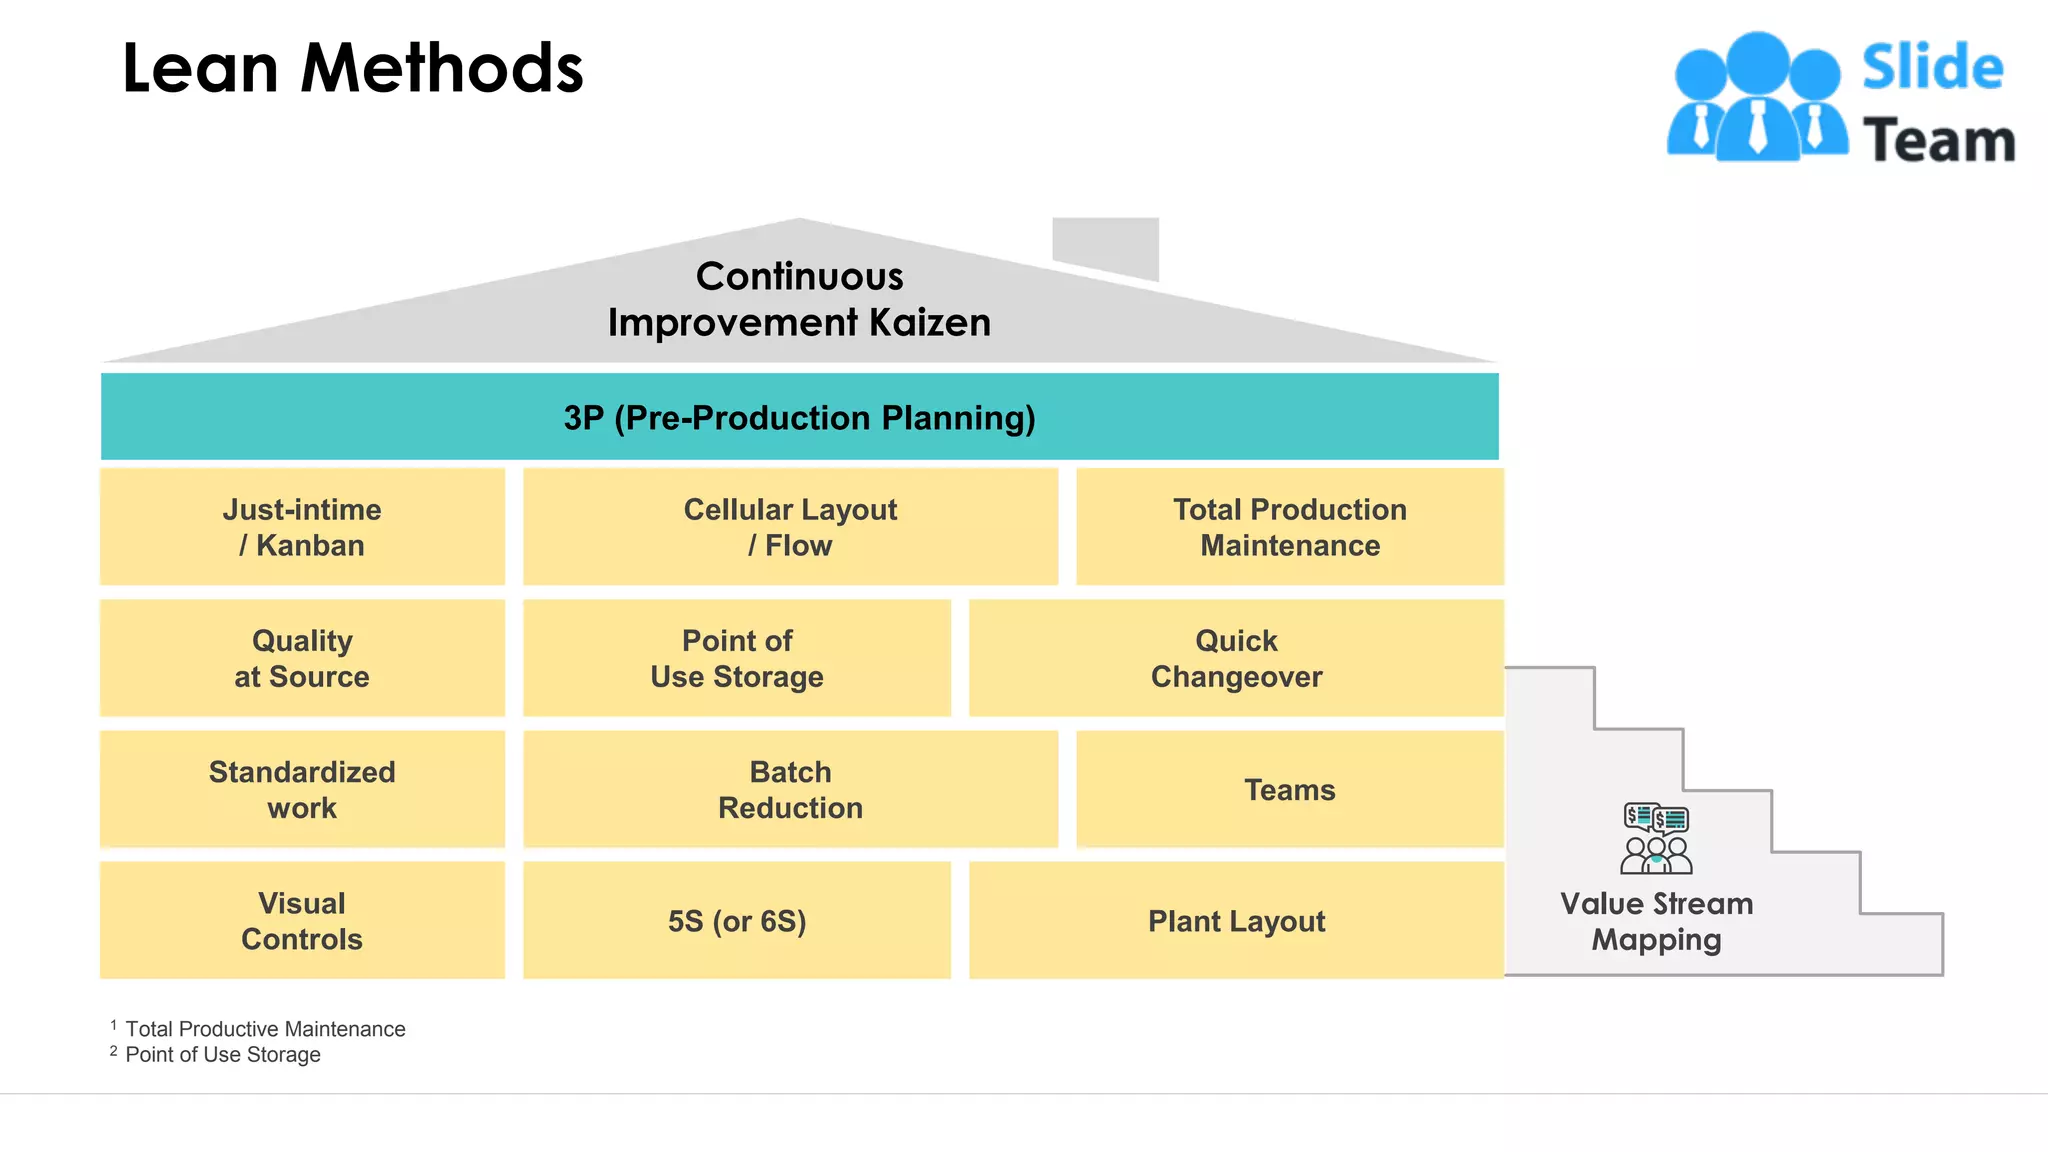
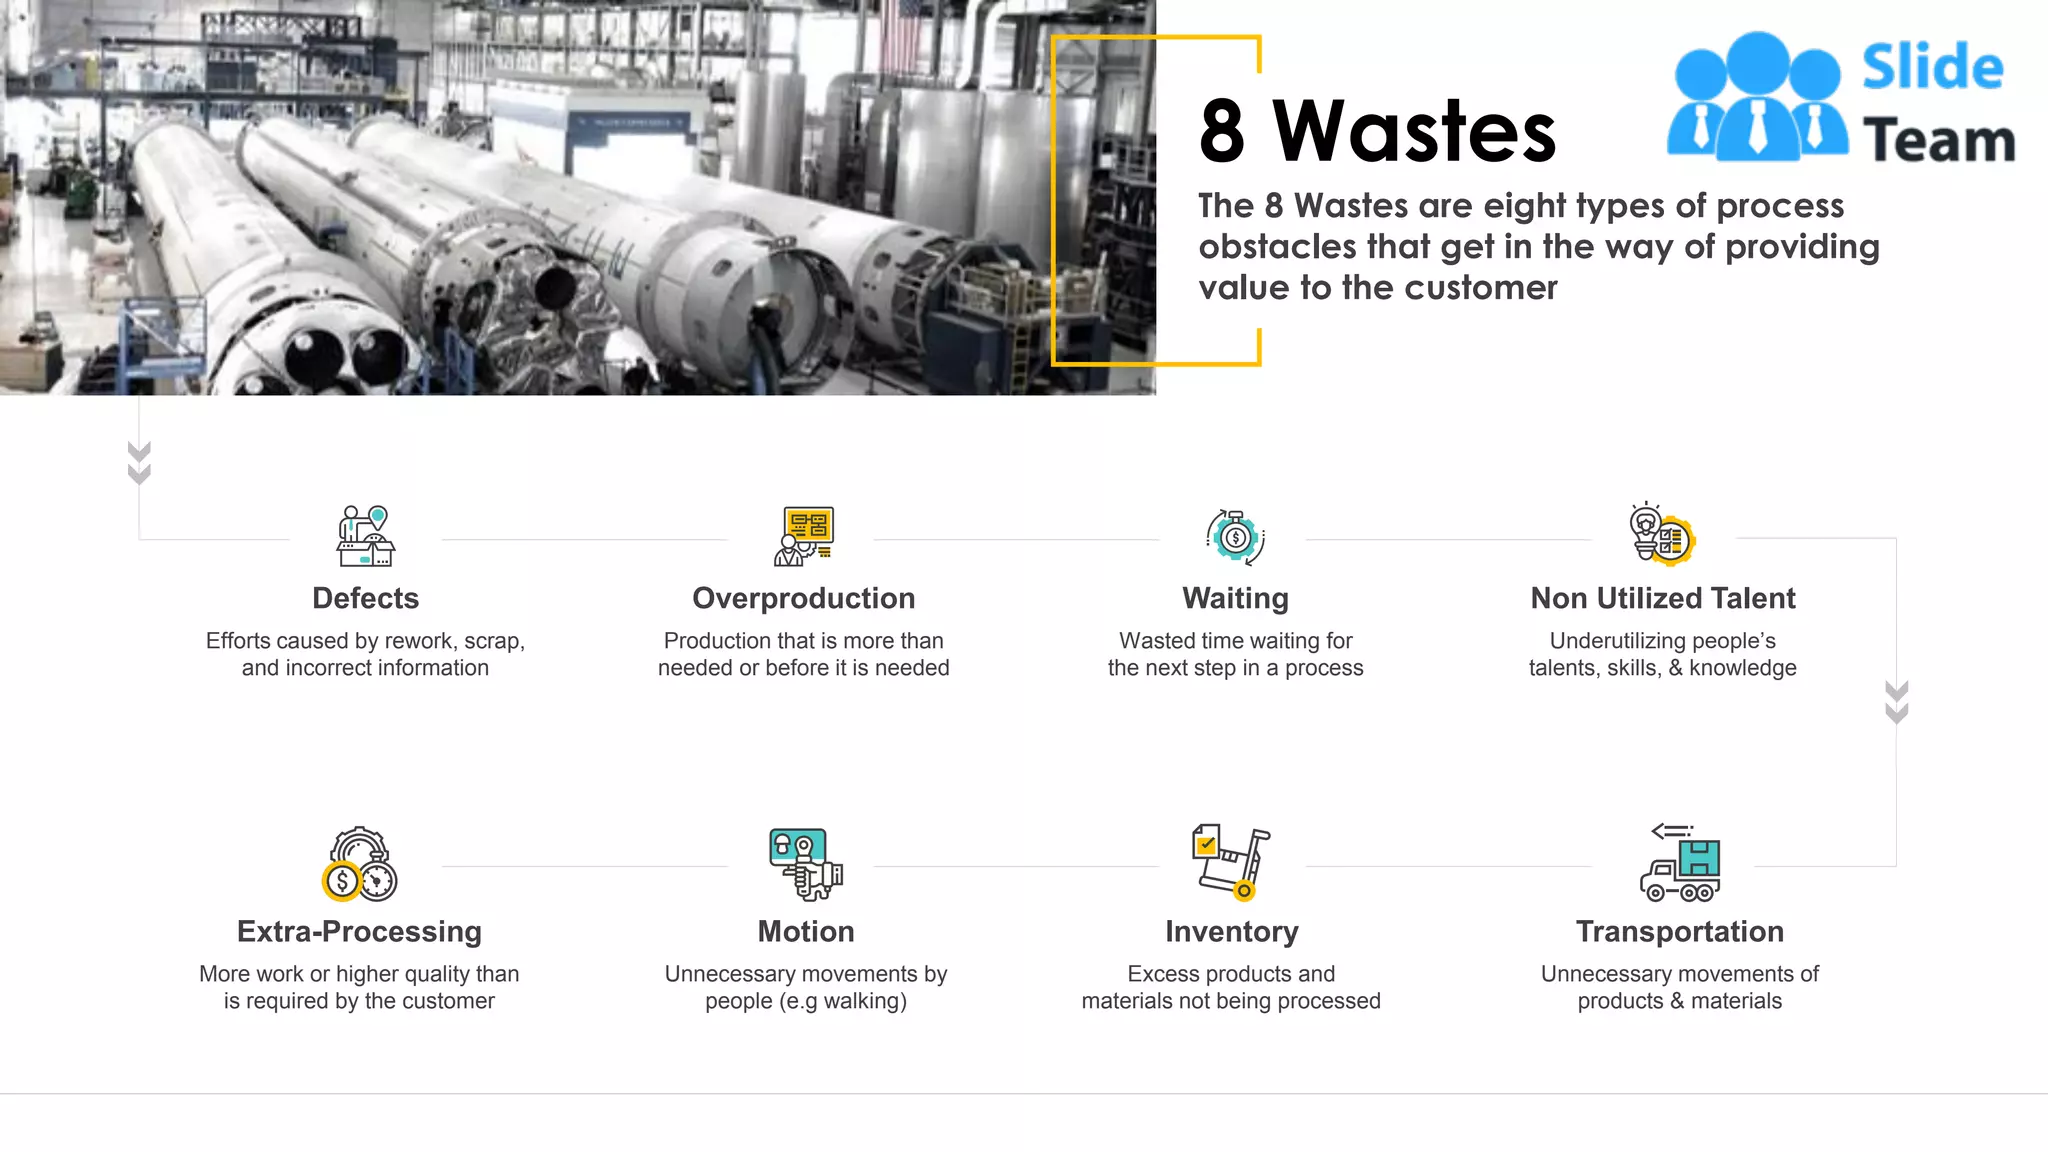
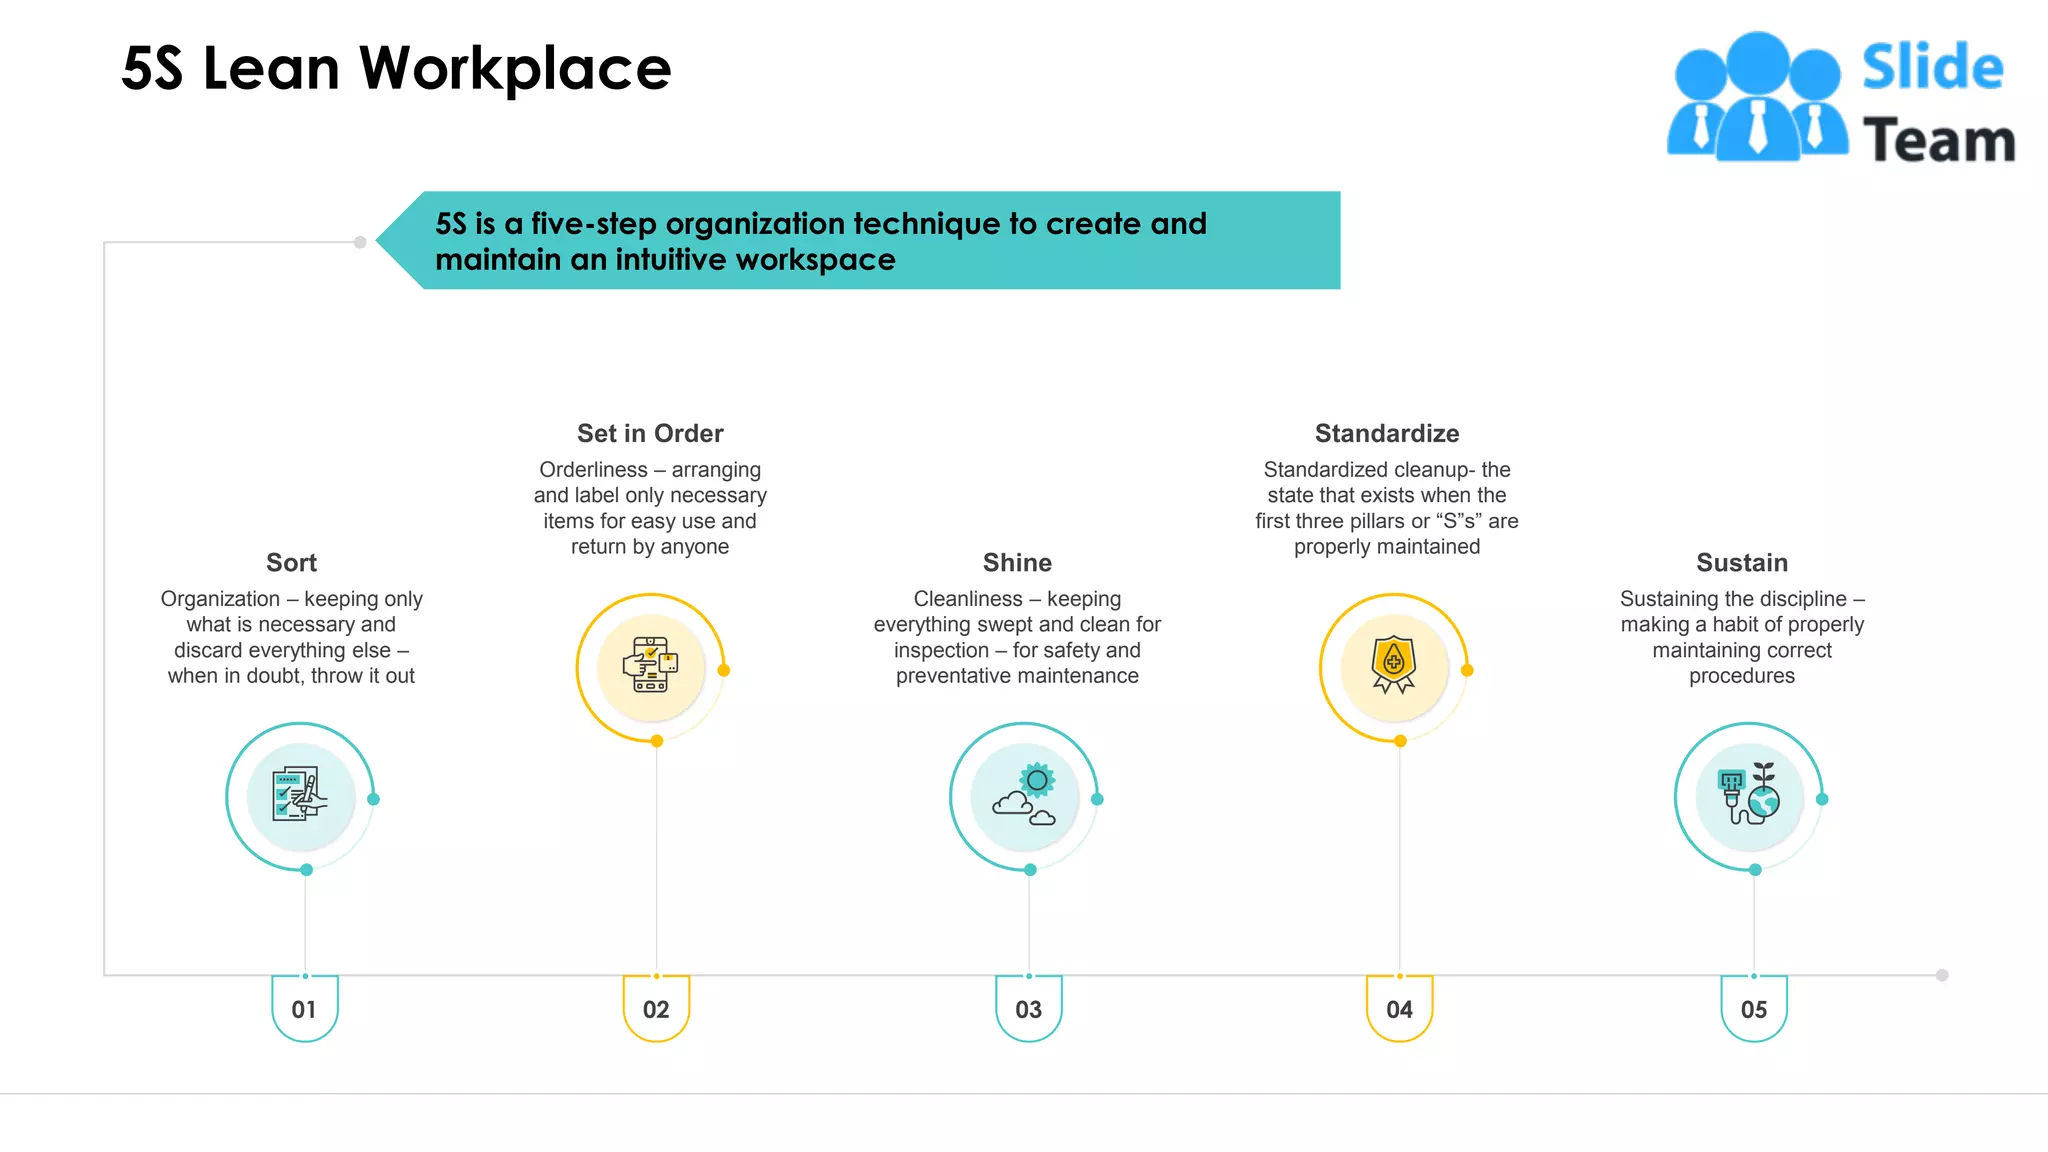
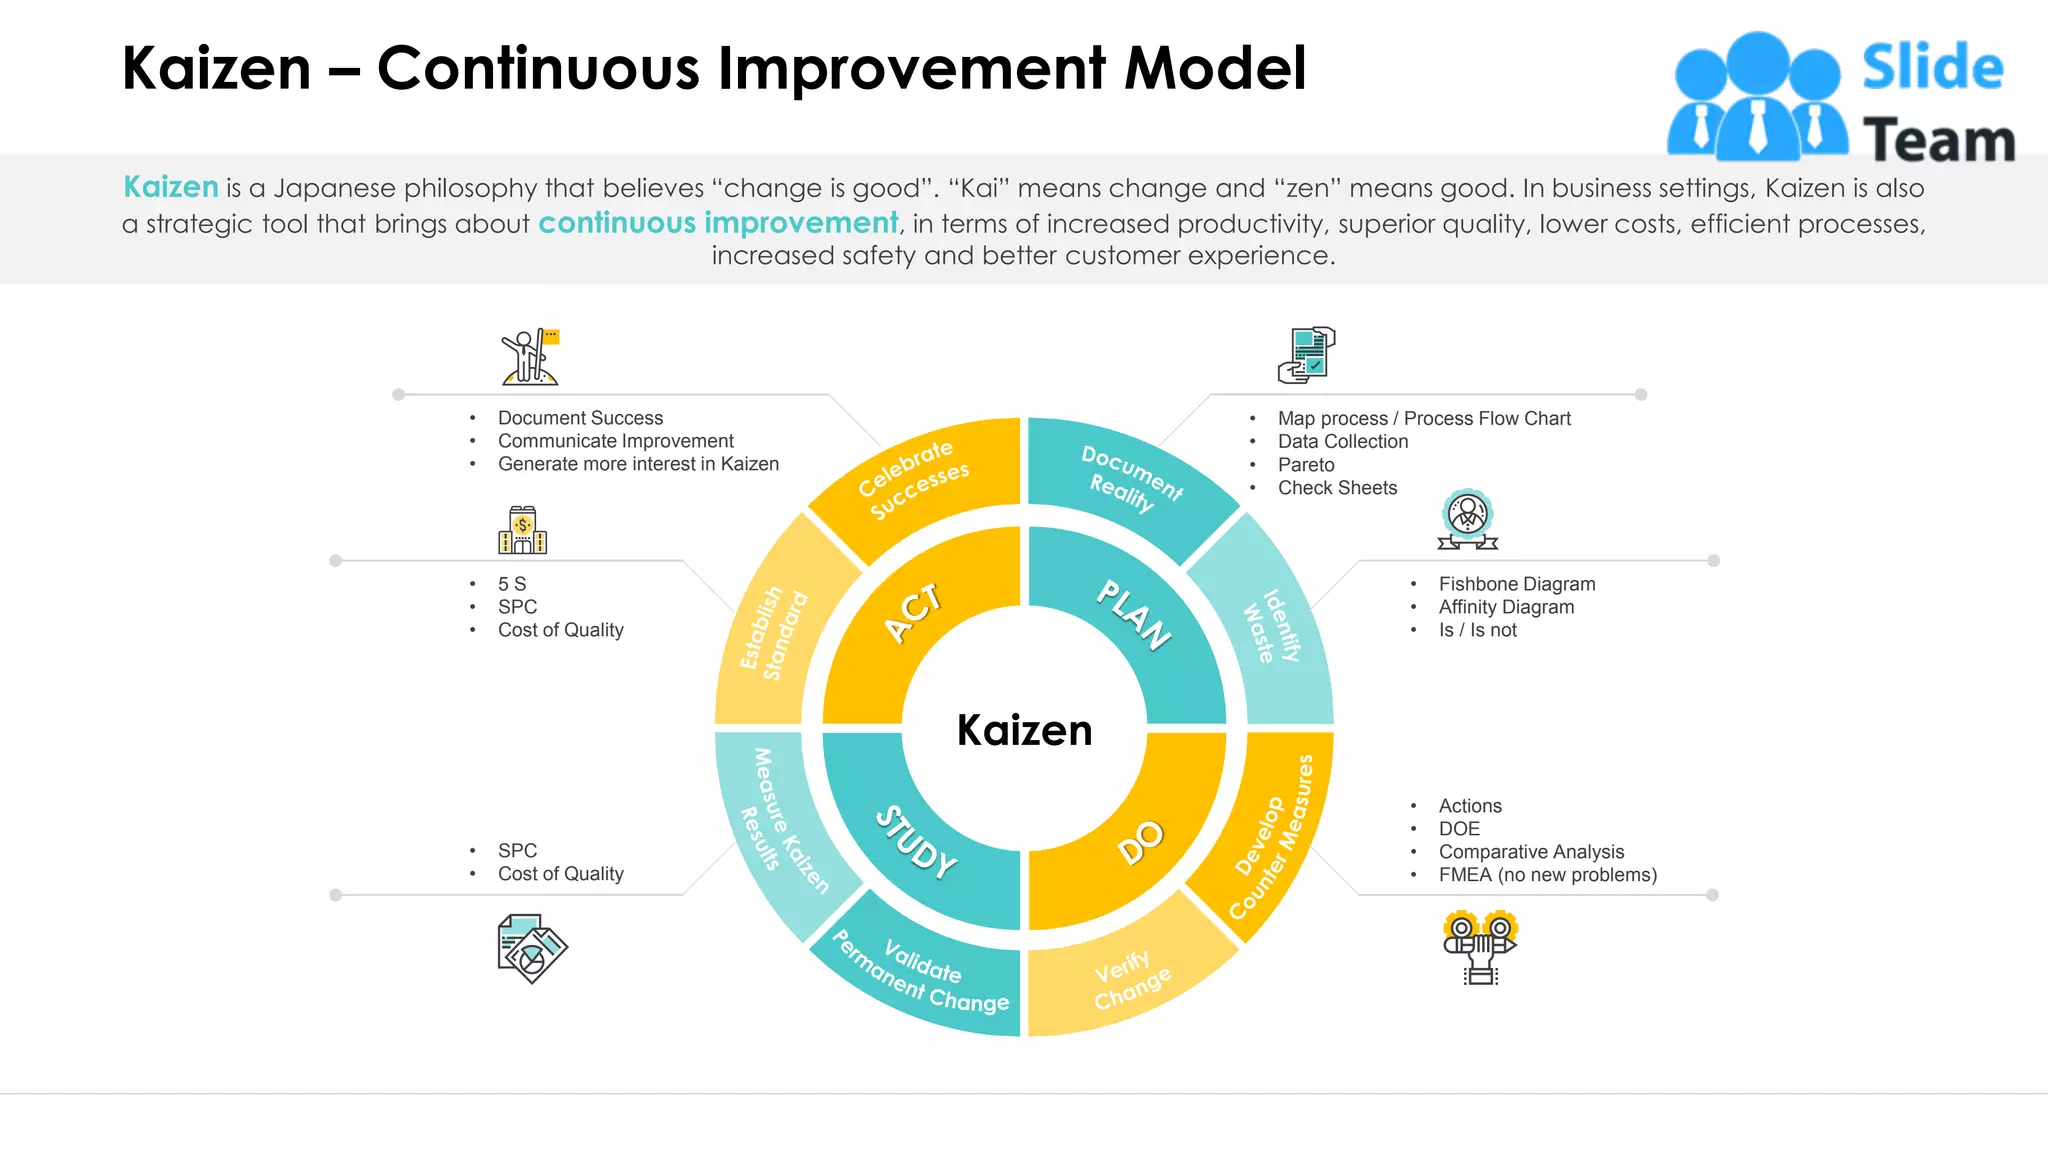
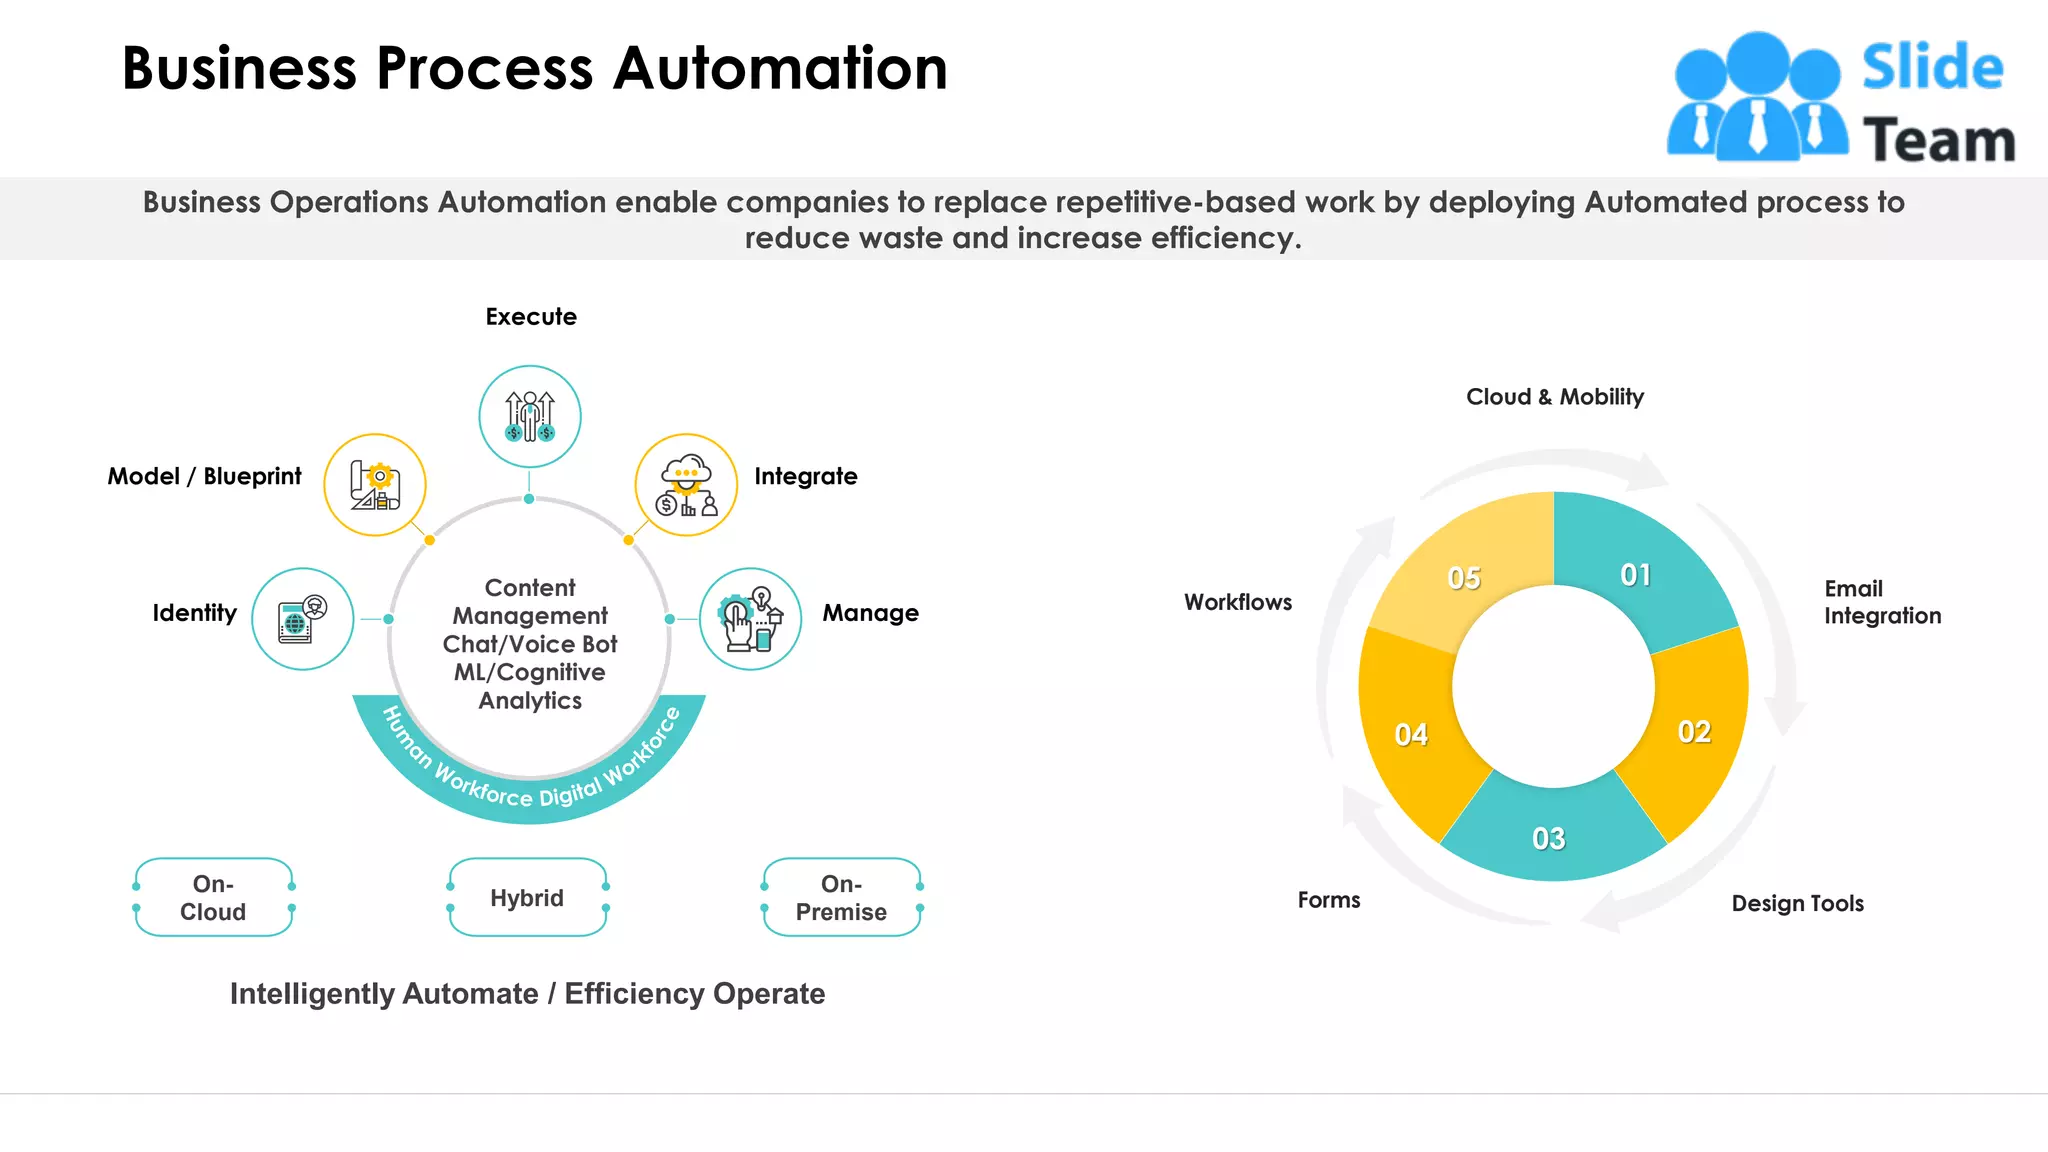
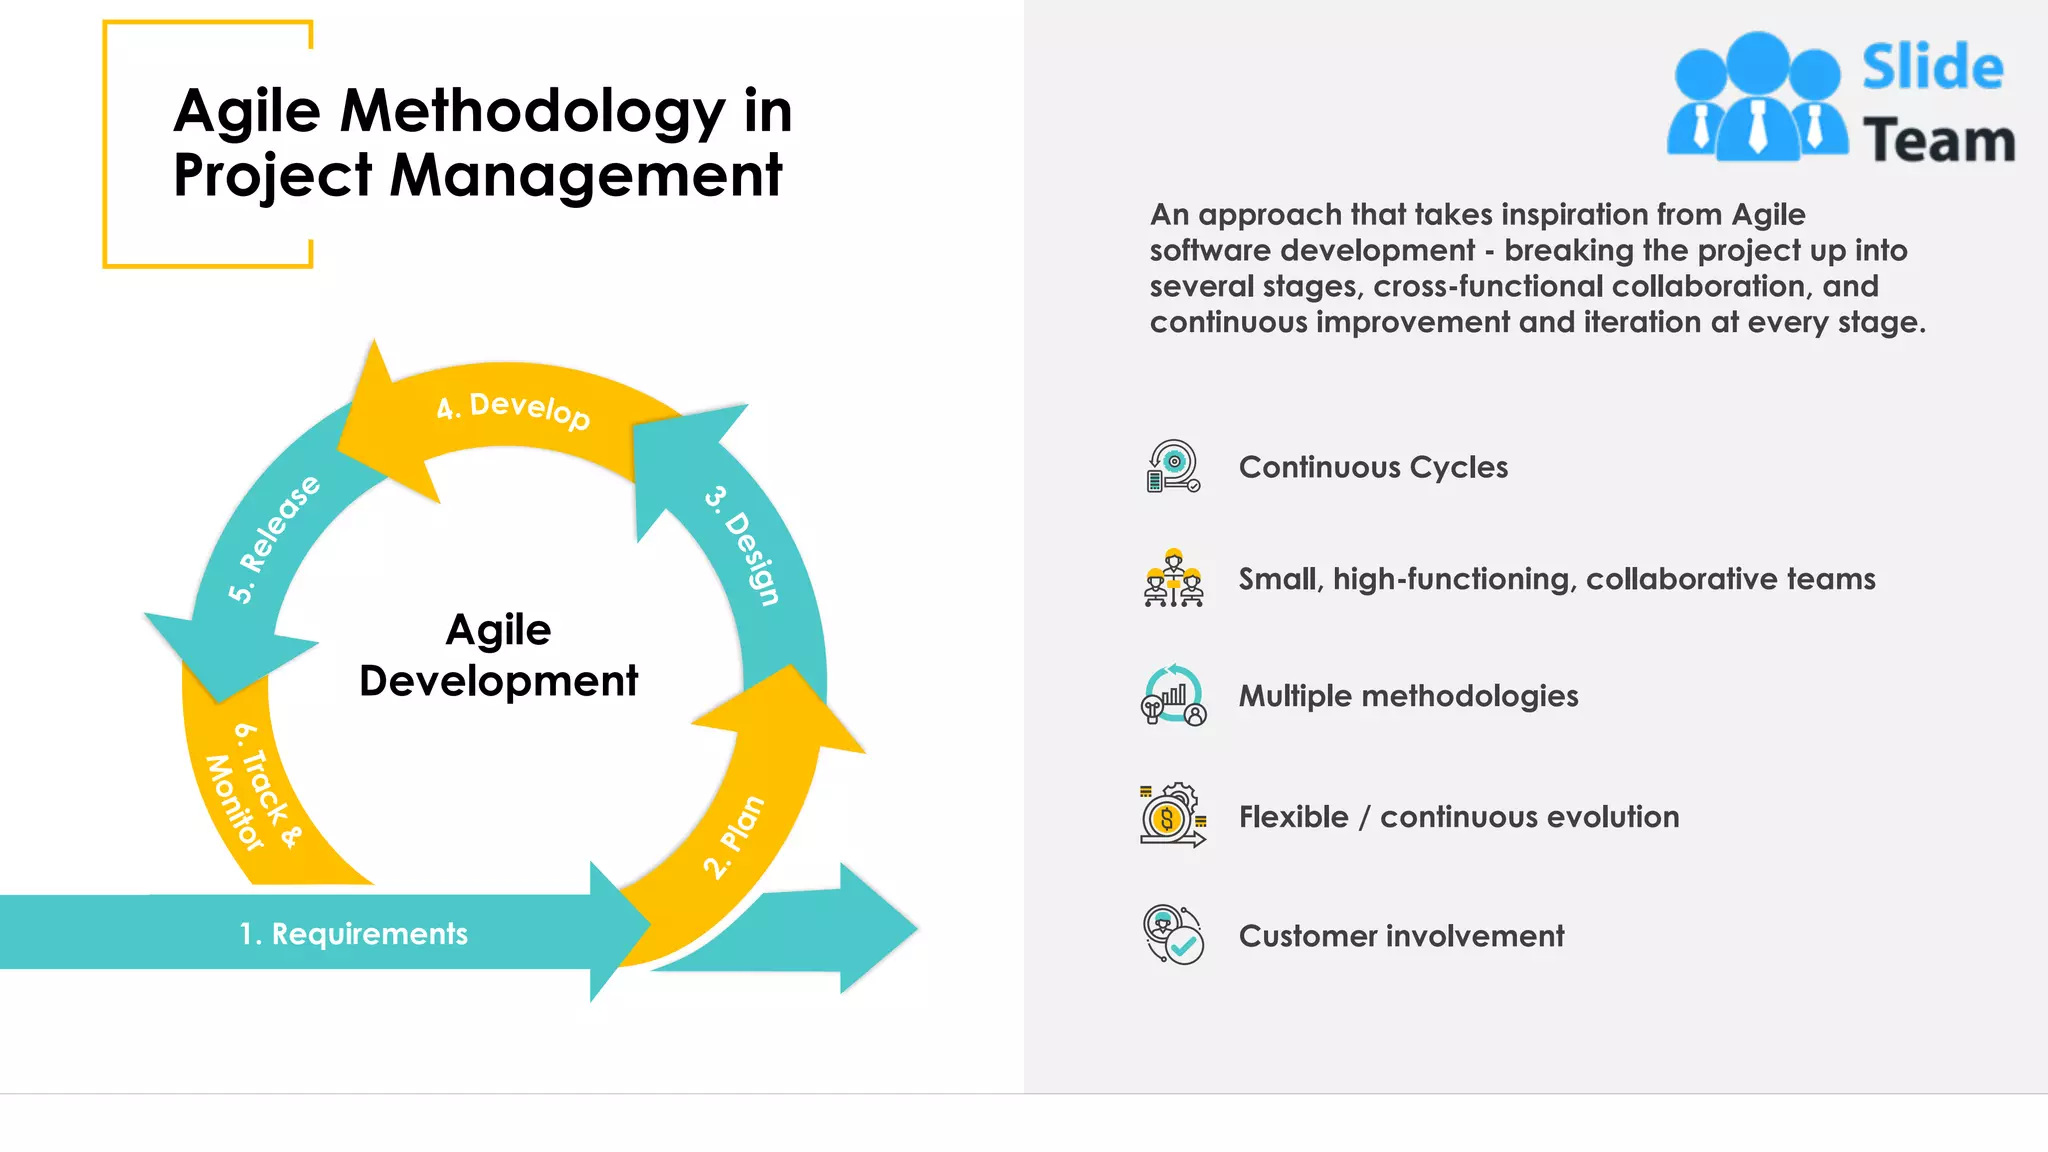


The document outlines strategies for aligning business functions to maximize ROI, emphasizing process improvement methodologies like Six Sigma and Lean. It covers the importance of understanding business processes, documenting input-output models, and the role of continuous improvement frameworks such as Kaizen. Additionally, it highlights the necessity of adopting business maturity models, employing business process automation, and utilizing agile methodologies for project management.


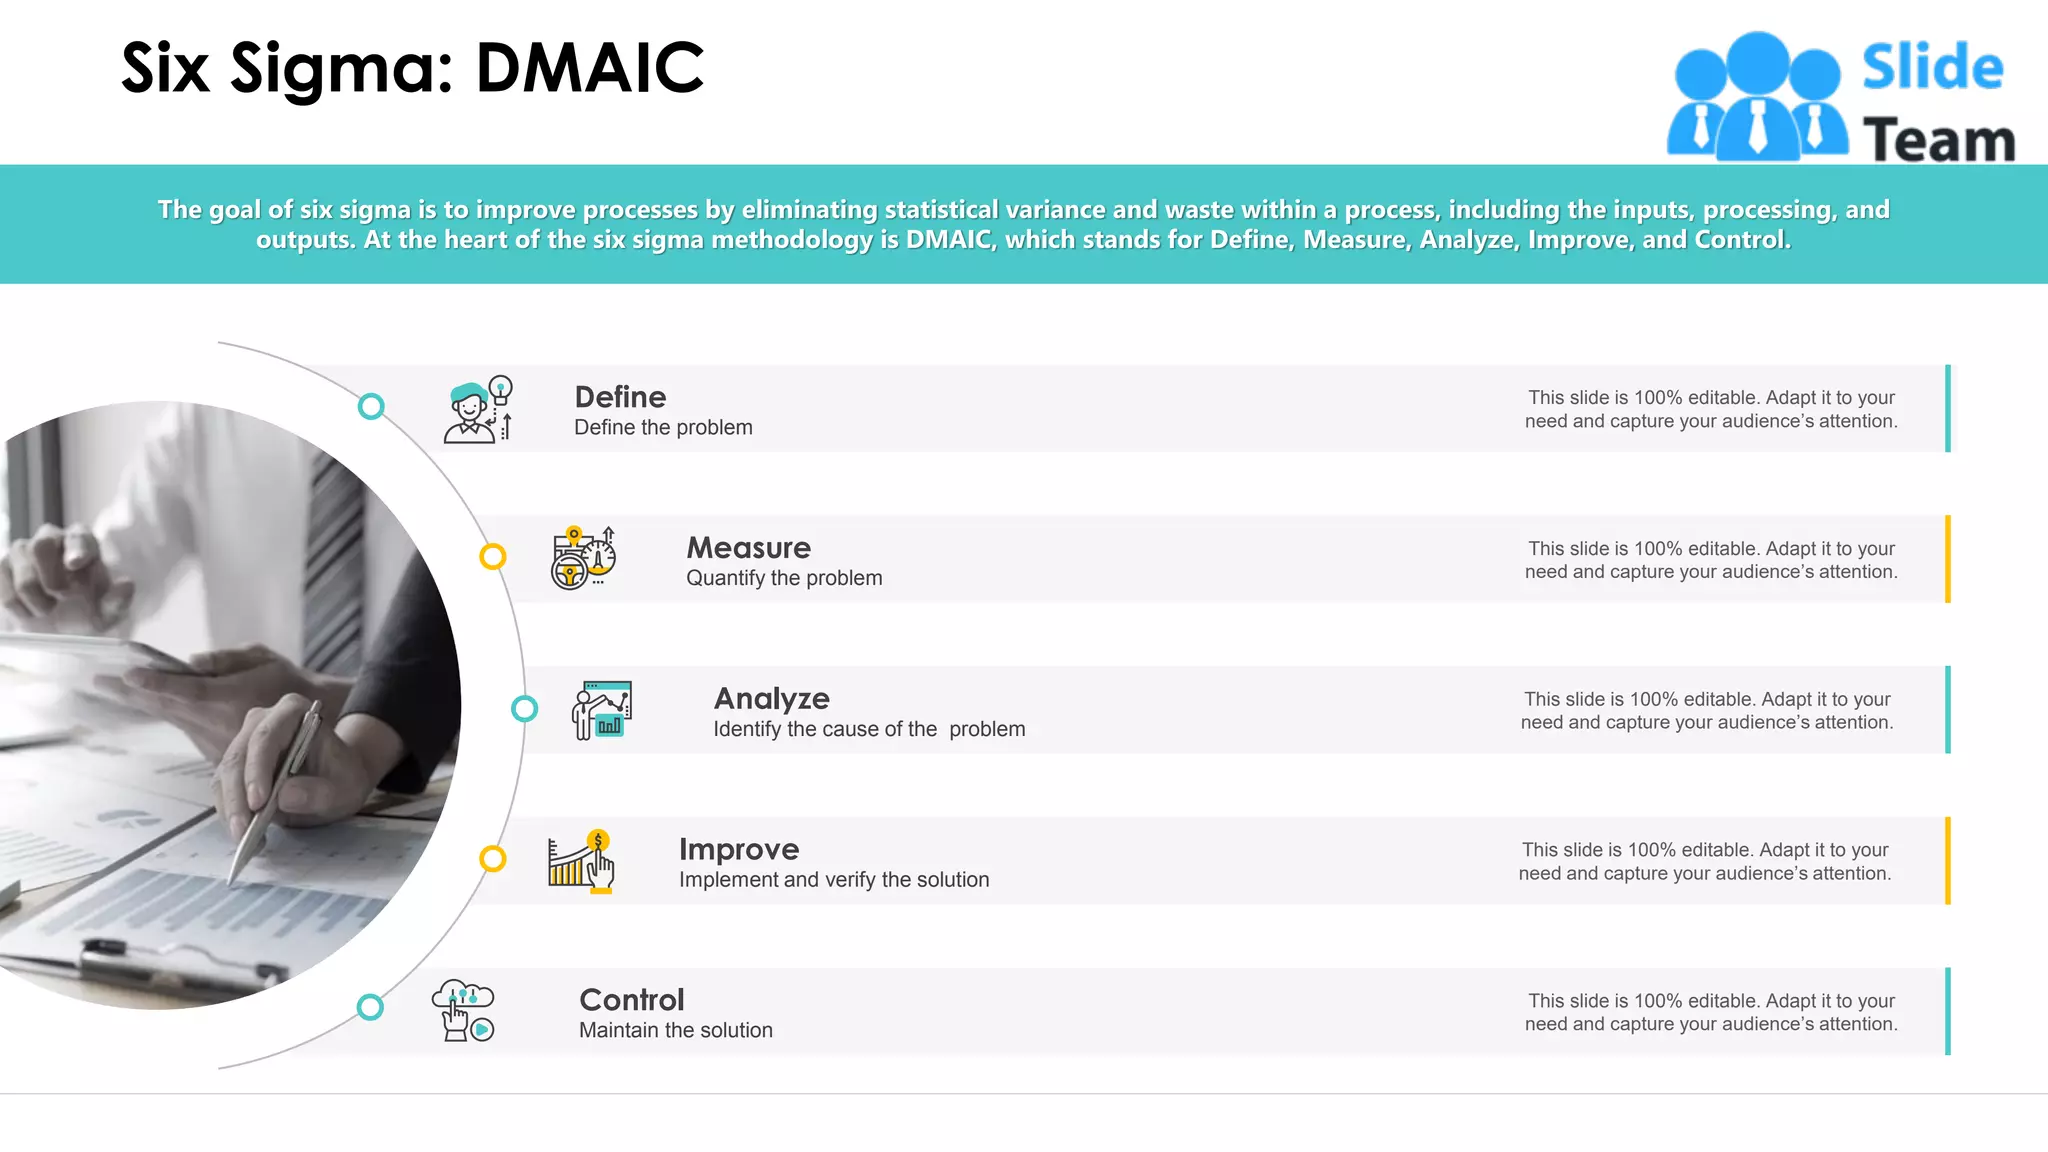
![Six sigma[2]](https://cdn.slidesharecdn.com/ss_thumbnails/sixsigma2-191019145307-thumbnail.jpg?width=640&height=640&fit=bounds)


