Global Cyber Security Or Critical Risk Dashboard
•
0 likes•542 views

"You can download this product from SlideTeam.net" Presenting this set of slides with name Global Cyber Security Or Critical Risk Dashboard. The topics discussed in these slides are Global, Cybersecurity, Overall Progression, Critical Risks Identified, Highlights. This is a completely editable PowerPoint presentation and is available for immediate download. Download now and impress your audience. https://bit.ly/3wS33PQ
Report
Share
Report
Share
Download to read offline

Recommended
Recommended
More Related Content
What's hot
What's hot (20)
Incident Management Powerpoint Presentation Slides
Incident Management Powerpoint Presentation Slides
Profiling for SAP - Compliance Management, Access Control and Segregation of ...
Profiling for SAP - Compliance Management, Access Control and Segregation of ...
Microsoft-CISO-Workshop-Security-Strategy-and-Program (1).pdf
Microsoft-CISO-Workshop-Security-Strategy-and-Program (1).pdf
Implementing and Running SIEM: Approaches and Lessons
Implementing and Running SIEM: Approaches and Lessons
Enterprise Cybersecurity: From Strategy to Operating Model
Enterprise Cybersecurity: From Strategy to Operating Model
Information security management system (isms) overview
Information security management system (isms) overview
Data Migration Plan PowerPoint Presentation Slides
Data Migration Plan PowerPoint Presentation Slides
Cyber Security For Organization Proposal PowerPoint Presentation Slides
Cyber Security For Organization Proposal PowerPoint Presentation Slides
Similar to Global Cyber Security Or Critical Risk Dashboard
Similar to Global Cyber Security Or Critical Risk Dashboard (20)
Quality Assurance Tools PowerPoint Presentation Slides
Quality Assurance Tools PowerPoint Presentation Slides
Tools Of Quality Management PowerPoint Presentation Slides
Tools Of Quality Management PowerPoint Presentation Slides
Tools Of Quality Control PowerPoint Presentation Slides
Tools Of Quality Control PowerPoint Presentation Slides
Enterprise Risk Management Overview PowerPoint Presentation Slides
Enterprise Risk Management Overview PowerPoint Presentation Slides
Enterprise Risk Management Overview Powerpoint Presentation Slides
Enterprise Risk Management Overview Powerpoint Presentation Slides
Concept Of Risk Management PowerPoint presentation Slides
Concept Of Risk Management PowerPoint presentation Slides
Approach For System Analysis PowerPoint Presentation Slides
Approach For System Analysis PowerPoint Presentation Slides
Project Risk Assessment PowerPoint Presentation Slides
Project Risk Assessment PowerPoint Presentation Slides
Business Risk Management Outline PowerPoint Presentation Slides
Business Risk Management Outline PowerPoint Presentation Slides
A Practical Guide to Selecting the Right Control Chart eBook
A Practical Guide to Selecting the Right Control Chart eBook
More from SlideTeam
More from SlideTeam (20)
Customer Support And Services Guide Powerpoint Presentation Slides
Customer Support And Services Guide Powerpoint Presentation Slides
Word Of Mouth WOM Marketing Strategies To Build Brand Awareness Powerpoint Pr...
Word Of Mouth WOM Marketing Strategies To Build Brand Awareness Powerpoint Pr...
Strategic Staff Engagement Action Plan Powerpoint Presentation Slides
Strategic Staff Engagement Action Plan Powerpoint Presentation Slides
Traditional Marketing Channel Analysis Powerpoint Presentation Slides Mkt Cd
Traditional Marketing Channel Analysis Powerpoint Presentation Slides Mkt Cd
Integrating Asset Tracking System To Enhance Operational Effectiveness Comple...
Integrating Asset Tracking System To Enhance Operational Effectiveness Comple...
Designing And Implementing Brand Leadership Strategy Powerpoint Presentation ...
Designing And Implementing Brand Leadership Strategy Powerpoint Presentation ...
How Amazon Generates Revenues Across Globe Powerpoint Presentation Slides Str...
How Amazon Generates Revenues Across Globe Powerpoint Presentation Slides Str...
Guide For Effective Event Marketing Powerpoint Presentation Slides Mkt Cd
Guide For Effective Event Marketing Powerpoint Presentation Slides Mkt Cd
Managing Business Customers Technology Powerpoint Presentation Slides
Managing Business Customers Technology Powerpoint Presentation Slides
Unearthing Apples Billion Dollar Branding Secret Powerpoint Presentation Slid...
Unearthing Apples Billion Dollar Branding Secret Powerpoint Presentation Slid...
Developing Flexible Working Practices To Improve Employee Engagement Powerpoi...
Developing Flexible Working Practices To Improve Employee Engagement Powerpoi...
Product Corporate And Umbrella Branding Powerpoint Presentation Slides Brandi...
Product Corporate And Umbrella Branding Powerpoint Presentation Slides Brandi...
Communication Channels And Strategies For Shareholder Engagement Powerpoint P...
Communication Channels And Strategies For Shareholder Engagement Powerpoint P...
Responsible Tech Playbook To Leverage Business Ethics Powerpoint Presentation...
Responsible Tech Playbook To Leverage Business Ethics Powerpoint Presentation...
Generating Leads Through Targeted Digital Marketing Campaign Powerpoint Prese...
Generating Leads Through Targeted Digital Marketing Campaign Powerpoint Prese...
Boosting Profits With New And Effective Sales Strategic Plan Powerpoint Prese...
Boosting Profits With New And Effective Sales Strategic Plan Powerpoint Prese...
Methods To Implement Traditional Marketing Powerpoint Presentation Slides Mkt Cd
Methods To Implement Traditional Marketing Powerpoint Presentation Slides Mkt Cd
Comprehensive Guide To Sports Marketing Strategy Powerpoint Presentation Slid...
Comprehensive Guide To Sports Marketing Strategy Powerpoint Presentation Slid...
Global Shift Towards Flexible Working Powerpoint Presentation Slides
Global Shift Towards Flexible Working Powerpoint Presentation Slides
Recently uploaded
Gurgaon, a bustling satellite city near Delhi, has witnessed rapid urbanization and population growth in recent years. As the city expands, the need for affordable housing solutions becomes increasingly critical. Design Forum International, renowned for its architectural innovation and social responsibility, stands at the forefront of designing affordable housing projects that cater to the diverse needs of Gurgaon's residents. Let's explore the transformative role of housing architects from Design Forum International in reshaping the landscape of affordable housing in Gurgaon.Redefining Affordable Housing in Gurgaon The Role of Housing Architects from ...
Redefining Affordable Housing in Gurgaon The Role of Housing Architects from ...Design Forum International
Recently uploaded (20)
Essential UI/UX Design Principles: A Comprehensive Guide
Essential UI/UX Design Principles: A Comprehensive Guide
In Saudi Arabia Jeddah (+918761049707)) Buy Abortion Pills For Sale in Riyadh
In Saudi Arabia Jeddah (+918761049707)) Buy Abortion Pills For Sale in Riyadh
18+ Young ℂall Girls Vadodara Book Esha 7427069034 Top Class ℂall Girl Serviℂ...
18+ Young ℂall Girls Vadodara Book Esha 7427069034 Top Class ℂall Girl Serviℂ...
Redefining Affordable Housing in Gurgaon The Role of Housing Architects from ...
Redefining Affordable Housing in Gurgaon The Role of Housing Architects from ...
Jual Obat Aborsi Semarang ( Asli No.1 ) 085657271886 Obat Penggugur Kandungan...
Jual Obat Aborsi Semarang ( Asli No.1 ) 085657271886 Obat Penggugur Kandungan...
Abortion pills in Jeddah +966572737505 <> buy cytotec <> unwanted kit Saudi A...
Abortion pills in Jeddah +966572737505 <> buy cytotec <> unwanted kit Saudi A...
Abortion pills in Riyadh +966572737505 <> buy cytotec <> unwanted kit Saudi A...
Abortion pills in Riyadh +966572737505 <> buy cytotec <> unwanted kit Saudi A...
Global Cyber Security Or Critical Risk Dashboard
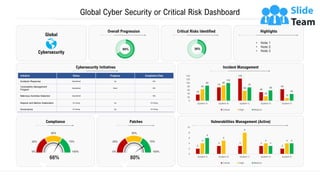
- 1. Global Cyber Security or Critical Risk Dashboard Cybersecurity Initiatives Initiative Status Progress Completion Date Incidents Response Operational Up N/A Vulnerability Management Program Operational Down N/A Malicious Activities Detection Operational - N/A Reports and Metrics Elaboration On Going Up On Going Governance On Going Up On Going This graph/chart is linked to excel, and changes automatically based on data. Just left click on it and select “Edit Data”. Incident Management 35 75 125 48 65 65 86 56 25 15 85 100 75 58 38 0 20 40 60 80 100 120 140 System A System B System C System D System E Critical High Medium Vulnerabilities Management (Active) 2 3 3 3 2 4 5 8 4 4 6 3 4 0 2 4 6 8 10 System A System B System C System D System E Critical High Medium Compliance 66% 0% 25% 50% 75% 100% Patches 80% 0% 25% 50% 75% 100% Highlights • Note 1 • Note 2 • Note 3 Overall Progression 65% Critical Risks Identified 35% Global Cybersecurity
- 2. Instructions to Edit This Slide This slide has been made in PowerPoint using basic PowerPoint shapes, and all graphics are 100% editable in PowerPoint. You can change color, size and orientation of any element to your liking, and add/edit any piece of text anywhere. Edit any Shape All images are 100% editable in PowerPoint Change color, size and orientation of any icon to your liking” 1. Select the Graph and right click -> Select "Edit Data" 2. An excel matrix will automatically show up 3. Enter the values based on your requirements and hit enter 4. The Graph/Chart shape will automatically adjust according to your data, and anytime you can go and change the value again Edit Excel-linked Chart This is a Data Driven Chart/Graph and the shape automatically adjusts according to your data 3. 2. 1. Resize any Shape and Edit Color 3. 1. 2. Select from Thousands of Editable Icons on Every Topic These icons are available at the Icons section on www.slideteam.net