Information System Security Benchmark Dashboards
•
0 likes•37 views

"You can download this product from SlideTeam.net" Presenting this set of slides with name - Information System Security Benchmark Dashboards. This is a three stage process. The stages in this process are Information Security Strategy, Information Security Plan, Information Protection Strategy. https://bit.ly/3rioHMz

Recommended
Recommended
More Related Content
Similar to Information System Security Benchmark Dashboards
Similar to Information System Security Benchmark Dashboards (20)
More from SlideTeam
More from SlideTeam (20)
Recently uploaded
Recently uploaded (20)
Information System Security Benchmark Dashboards
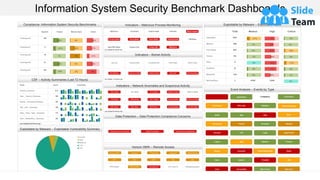
- 1. Indicators – Malicious Process Monitoring Information System Security Benchmark Dashboards Compliance- Information System Security Benchmarks Exploitable by Malware – Exploitable Matrix CSF – Activity Summaries (Last 72 Hours) Exploitable by Malware – Exploitable Vulnerability Summary Indicators – Botnet Activity Indicators – Network Anomalies and Suspicious Activity Data Protection – Data Protection Compliance Concerns Verizon DBIR – Remote Access Event Analysis – Events by Type Systems Passed Manual check Failed Technique 26 185 Technique 27 11 Technique 28 19 Technique 29 37 Technique 45 183 Event Count Trend Data Domain_summary 612 User _ Source _Summary 198 Hourly _ Command Summary 192 SSL _Cert _ Summary 169 Daily _ Host _ login _ Summary 110 User _ Destination _ Summary 105 Critical High Medium Low Info Last Updated: 1 Minute Ago Last Updated: 57 Minutes Ago Last Updated:58 Minute Ago This graph/chart is linked to excel, and changes automatically based on data. Just left click on it and select “edit data”. Last Updated:56 Minutes Ago Last Updated:56 Minutes Ago Last Updated:56 Minutes Ago Malicious Unwanted Custom Hash Indicator Multi Crashes Process Spike Virus Spike Error Spike Change Spike FIM Spike New EXE Spike Unique Unix Unique Win Malicious Bot List Inbound Nets Out Bound Net DNS Clean URLS Clean Bot Attacks Inbound Traffic Outbound Net Bot Auth Bot Anomalies DNS Spike SSL Spike PVS Spike Network Spike NetFlow Spike File Spike Web Spike 404+ Spike Inbound Spike Out Bound Spike SSH 30m+ VNC 30m+ RDP 30m+ Internal Spike Connect Spike Data And Communication Media Protraction Portable Devices/Remove Unusual VPN Intrusion Threat List Long-term IPSEC/Ike/Isa VPN SSH RDP VNC SSL VPN Sniffed SSH Sniffed Compliance F Go To My Pc Remote/Anywhere 50% 46% 41% 21% 76% 4% 38% 78% 5% 3% 45% 22% 1% 49% 21% 6% 6% 4% 0% 9% 7% 10% 17% Total Medium High Critical Exploitable 8870 Malware 3384 Core Impact 2621 Canvas 932 Elliot 12 ExloitHub 22 Metasploit 1534 Bad AutoRuns 0 NONE NONE 21% 5% 5% 9% 0% 5% 3% 92% 88% 83% 4% 89% 85% 4% Application Compliance Connection Continuous Data Leak Database Detected Change DHCP DNS DOS Error File Access Firewall Honeypot Indicator Intrusion LCG Login Login Failure Logout NBS Network Process Restart Scanning Social Networking Spam Starts System Threatilst USB Virus Vulnerability Web Access Web Error
- 2. Instructions To Edit This Slide This slide has been made in PowerPoint using basic PowerPoint shapes, and all graphics are 100% editable in PowerPoint. You can change color, size and orientation of any element to your liking, and add/edit any piece of text anywhere.
- 3. All images are 100% editable in PowerPoint Change color, size and orientation of any icon to your liking”
- 4. 1. Select the Graph and right click -> Select "Edit Data" 2. An excel matrix will automatically show up 3. Enter the values based on your requirements and hit enter 4. The Graph/Chart shape will automatically adjust according to your data, and anytime you can go and change the value again Edit Excel-linked Chart This is a Data Driven Chart/Graph and the shape automatically adjusts according to your data 1 2 3
- 5. Edit Color 1. Select the shape to change the color and Right click the object( click any object which you want to change color) 2. Choose Format Data Series in the dialog box. 3. Choose “Fill” in the Format Shape box then “Solid” or “Gradient” depending on the appearance of the object. Change colour as shown in the picture. 1 2 3
- 6. Select From Thousands Of Editable Icons On Every Topic These icons are available at the Icons section on www.slideteam.net