1. Fracture Toughness
1. Group Info
Group 2 MSE 527L
Rna Waheb
Siddhesh Sawant
Dhaval Prajapati
Pavan Kumar Nanne
Ryan Oh
Rameen Hassanzadeh
2. Abstract
Two samples of 7075 Aluminum were prepared for a fracture toughness investigation. The first,
a compact tension specimen was prepared in accordance with ASTM E-399, was successfully tested
under tensile load. The sample, starting with a 0.9in crack length, reached a maximum load of 4435 lbs
before fracturing with a final crack length of 1.415 in. Using 95% of the slope of the linear fit of the
linear regime of load vs crack-mouth opening displacement (COD), PQ was determined to be 2731 lbs,
indicating a KQ of ~89 ksi in1/2
. However, it was deterimied that this KQ value is invalid for being KIC
due to the Pmax:PQ ratio.
The second ssample, prepared as a single edge-notch bend sample, was tested under 3pt bend. It
was found to fracture while still in the linear P vs COD regime, and to have an unmeasurable final
crack length. It reached a maxium load of 4295 lbs.
3. Procedure
In this lab, two samples of 7075 Aluminum (E=68 GPa, σYS =
70ksi, σYS = 76ksi) were prepared in specific shapes for standardized
testing (ASTM E-399) of their crack-induced fracture properties. The
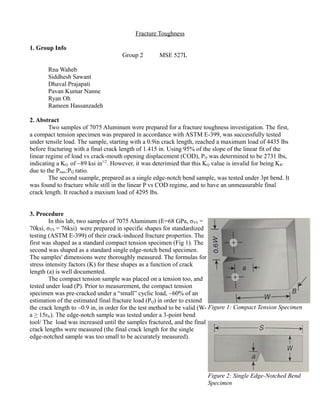
first was shaped as a standard compact tension specimen (Fig 1). The
second was shaped as a standard single edge-notch bend specimen.
The samples' dimensions were thoroughly measured. The formulas for
stress intensity factors (K) for these shapes as a function of crack
length (a) is well documented.
The compact tension sample was placed on a tension too, and
tested under load (P). Prior to measurement, the compact tension
specimen was pre-cracked under a “small” cyclic load, ~60% of an
estimation of the estimated final fracture load (PQ) in order to extend
the crack length to ~0.9 in, in order for the test method to be valid (W-
a ≥ 15rIc). The edge-notch sample was tested under a 3-point bend
tool/ The load was increased until the samples fractured, and the final
crack lengths were measured (the final crack length for the single
edge-notched sample was too small to be accurately measured).
Figure 1: Compact Tension Specimen
Figure 2: Single Edge-Notched Bend
Specimen
2. 4. Results and Discussion
The formulas for determining the stress concentration for these samples is well document. For
the compact tension specimen, the formula is as follows:
K =
P
BW
(1/2)
f (a/W )
Where P is the load and a is the crack length. B and W are dimensions of the sample, as can be seen in
Fig 1. f is the formula defined below:
f (x)=
(2+ x)
(1−x)
(3/2)
×(0.886+4.64x−13.32x
2
+14.72x
3
−5.6x
4
)
Similarly, for the single edge-notched bend sample,
K =
PS
BW
(3/2)
f (a/W )
f (x)=
3x
(1/2)
(2(1+2x)(1−x)
(3/2)
)
×(1.99+x(1−x)(2.15−3.93x+2.7x
2
))
Here, S is the sample length as seen in Figure 2.
For the starting crack length values (0.9in for the compact tension sample, and 0.26in for the
single edge-notch sample), K reduces to ~12*P and 7.7*P respectively.
As mentioned in the methods section, the samples were tested under load until fracture. Figures
3 and 4 show the results of their load vs crack mouth displacement.
3. As can be seen from the graphics, the compact tension sample showed a linear region up to
Figure 3: load vs crack mouth open displacement for the compact tension sample
Figure 4: Load vs crack mouth open displacment for the edge-notched sample, tested
under 3pt bend.
4. COD ~ 0.02, after which the displacement rate vs load began to increase. The edge-notch sample
fractured while still in a linear regime. The samples fractured once the increase in K due to the growing
crack rank reached a critical point, after which the crack propagation went “sonic,” resulting in the
complete fracture of the sample.
For the compact tension sample, this critical crack length was found to be 1.415 in, and
fractured at a load PMax = 4435lbs. The load at Similarly, the edge-notch sample fractured on a load of
PMax = 4295lbs, though a could not be measured, and an accurate K cannot be established.
The critical load (PQ) and fracture toughness (KQ) are determined by finding the slope of the
linear regime of the load vs COD for the sample. Then, determining where a slope 5% less than that
intersects with the load/COD curve (PV). This is illustrated below, in Figure 5.
Using this method, PQ is found to be 2731 lbs. Using this value for P, and our final crack length,
we can determine KQ.. We find this value to be ~89.1 ksi in1/2
. However, this value for K is only valid
(ie: is KIC) under certain conditions. Using our solve PQ, we can take another step in determining the
validity of this test. For the test to be valid, the following formula would need to be true:
PMax
PQ
<1.10
So, in order for our KQ to be our desired KIC, we need to check our load values. Plugging in our
numbers, we get
PMax
PQ
=
4435
2731
= 1.62
Clearly, 1.6 is not less than 1.10. Unfortunately, this implies that our test is invalid, so our KQ is
not a valid KIC.
Figure 5: The close-to-linear regime of the compact tension sample. The two lines give
the linear fit of the regime (top) and Pv, which is 95% of that linear fit (bottom)
5. In summary:
Sample Pre-test
crack
length (in)
K(P) (ksi
in1/2
)
Pmax (lbs) Final crack
length (in)
PQ (lbs) KQ (ksi
in1/2
)
KIC?
Compact
Tension
0.9 12*P 4435 1.415 2731lbs 89.1ksi in1/2
No
Single
Edge-
Notch
Bend
0.26 7.7*P 4295 - - - -
Table 1: Data summary for Compact Tension sample and Single Edge-Notch bend sample. The Edge-
Notch sample fractured while still in a linear regime, and the final crack length was unmeasureable.
6. Errata to Report
In the case of the edge-notch bend sample, the discussion in this report is incorrect in some of
its statements. Because the sample is “Type 1,” a 95% slope line is not required to find PQ. Instead, by
definition, Pmax = PQ. This implies that KQ is calculable, using the Pmax value for the load. The results,
using the measured pre-crack length as the post crack length (they were not significantly different for
this sample), can seen below in Table 2.
Sample Pre-test
crack
length (in)
K(P) (ksi
in1/2
)
Pmax (lbs) Final crack
length (in)
PQ (lbs) KQ (ksi
in1/2
)
KIC?
Single
Edge-
Notch
Bend
0.26 7.7*P 4295 0.26 4295 33.1 No
The question does this KQ represent KIC remains. The first check, taking the ratio of PQ and Pmax
looks as follows.
PMax
PQ
= 1≤1.1
To summarize, it passes by definition. However, this is not only criteria that must be passed in
order for this KQ value to represent KIC. The second is that a theoretical “length,” LQ must be small
compared to the sample thickness and crack length.
LQ=2.5(
K IC
σYS
)
2
≤B ,a
For the edge notch sample, B=W, and LQ resolves to the following.
LQ=2.5(
K IC
σYS
)
2
=2.5(
K IC
(Pmax/W
2
)
)
2
=2.5(
33.1
4.77
)
2
=121inches
The resulting value is signifcantly larger than W and a from the sample, and therefore, KQ does
not represent KIC.
6. 7. References
1. "Fracture Toughness Testing and Residual Load-Carrying Capacity of a Structure."
Massachusetts Institute of Technology. 2004
7. 7. References
1. "Fracture Toughness Testing and Residual Load-Carrying Capacity of a Structure."
Massachusetts Institute of Technology. 2004