
Recommended
More Related Content
What's hot
What's hot (20)
Similar to P&ID Presentation.pdf
Similar to P&ID Presentation.pdf (20)
Recently uploaded
Recently uploaded (20)
P&ID Presentation.pdf
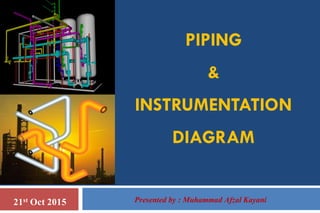
- 1. PIPING & INSTRUMENTATION DIAGRAM 21st Oct 2015 Presented by : Muhammad Afzal Kayani
- 2. Objective The aim of this course is to develop a basic understanding of analyzing/interpreting P & I Diagrams and its utilization
- 3. P & ID ❑ Introduction ❑ Skill for Analysis & interpretation of Process Flow Diagrams ❑ 3 Level of Diagrams ❑ Introduction to Block Flow Diagram (BFD) ❑ Introduction to Process Flow Diagram (PFD) ❑ PFD Symbology & Abbreviation ❑ Introduction to Piping & Instrumentation Diagram (P & ID)
- 4. P & ID ❑ P & ID Symbology & Abbreviation ❑ Introduction to Process Control Loop ❑ How To Read a P & ID ❑ Piping Specifications & Decoding ❑ Interlock System ❑ Piping Isometrics ❑ Equipment Elevation Drawings
- 5. Introduction WHY skill is necessary for chemical plant personnel in analyzing & interpreting Process Flow Diagrams ?
- 6. Introduction ❑ Complex chemical processes ❑ High temperature, pressure, energy ❑ High reactivity & toxicity of chemicals ❑ Serious consequences in case of missed communication ❑ Appropriate process diagrams are required for clear visual information ❑ Skill is required in analyzing & interpreting these diagrams Flow Diagrams communicate information about a process in the most effective way.
- 7. Introduction ❑ Block Flow Diagram (BFD) ❑ Process Flow Diagram (PFD) ❑ Piping and Instrumentation Diagram (P&ID) – often referred to as Mechanical Flow Diagram 3 Levels of Diagram are generally applied in process industry.
- 8. Introduction Each step shows additional information.
- 10. Block Flow Diagram (BFD) ◼ BFD shows overall processing picture of a chemical complex & is useful as an orientation tool. ❑ Chemical process can be broken down into basic areas or blocks. ❑ Diagram consists of a series of blocks representing different equipments or unit operations that are connected with input & output streams. Air NH3 Urea Prills Ammonia Unit Urea Unit Bagging & Shipping Utility Unit Fuel Gas Utility Unit Steam NG CO2
- 11. Block Flow Diagram (BFD) Following conventions are used, ❑ Only limited information is available about each process unit. ❑ Each block represents a process function which in reality may consist of several pieces of equipment. ❑ Major flow lines shown with arrows giving direction of flow. ❑ Flow goes from left to right whenever possible. ❑ Light streams (gases, vapors) move towards top and heavy streams (solid, liquid) go towards bottom. Diagram is very useful for “getting a feel” for the process & is a starting point for developing a PFD.
- 12. Block Flow Diagram (BFD)
- 13. Block Flow Diagram (BFD)
- 16. Process Flow Diagram (PFD) PFD provides basic information of the following, 1. Process fundamental details 2. Process stream Information 3. Equipment information
- 17. Process Flow Diagram (PFD) ❑ Bulk of information about chemical process is available as compared to BFD. ❑ There are no universally accepted standards about contents of information. ❑ PFD information for same process may differ from one company to another company.
- 18. Process Flow Diagram (PFD) It normally includes, ❑ All Major Equipments with a descriptive name & unique equipment number ❑ Process condition & chemical composition of each stream ❑ Bypass & Re-circulation Streams ❑ Flow & equipment summary table ❑ Basic control loops, illustrating the control strategy used to operate the process during normal operation Showing the connectivity & flow relationship between major equipments of plant
- 19. Process Flow Diagram (PFD) It does not include, ❑ Minor piping details (Piping line #, piping class) ❑ Manual isolation & shut-off valves ❑ Flanges ❑ Vents & drains ❑ Instrumentation ❑ Safety relief valves Displays the flow relationship between major equipments of plant
- 20. Introduction to Process Flow Diagram (PFD) ❑ Computer generated with the help of process simulators ❑ CAD Package ❑ Standard symbols / icons are used ❑ Arrows show the flow of chemicals ❑ Produced on large sheet of paper ❑ Used for visitor information and new employee training
- 21. Process Flow Diagram (PFD) ❑ PFD are produced by drafting department working with process engineering. ❑ A well-known engineering & construction firm (consultant) may be hired for above task. ❑ PFD & PIDs are approved after completion. ❑ The value of the PFD does not end with the construction of plant. ❑ It remains the document that best describes the process, and is used in the training of operators and new engineers. ❑ It is consulted regularly to diagnose operating problems that arise and to predict the effects of changes on the process.
- 23. Process Equipment Identification T – Turbine K - Compressor E - Heat Exchanger V - Vessel P - Pump R - Reactor C – Column / Tower T - Storage Tank F - Fired Heater Conventions used for identifying Process Streams & Equipment Utility Streams CW : Cooling Water NG : Natural Gas UN : Utility Nitrogen IA : Instrument Air HS : High Pressure Steam FG : Fuel Gas DMW : De-mineralized Water FW : Fire Water Process Streams PG : Process Gas AL : Liquid Ammonia US : Urea Solution
- 26. Equipment Numbering System P – 101 A/B Pump 01 Area Pump # 01 Back up pump is available
- 27. Information Flags ❑ Not all process information is of equal importance. ❑ Information critical to the safety & operation of the plant is included. ❑ This includes temperature pressure & flow rates of feed & product streams. ❑ The information provided on the flags is also included in the flow summary table. Therefore flags are useful in reducing size of flow summary table.
- 28. Information Flags For Stream Identification Stream information is added to the diagram by attaching “ information flags”
- 31. Piping & Instrumentation Diagram
- 32. ❑ Principal or core document in a process industry ❑ Overall document used to define a process ❑ Provides information to begin planning for construction of plant ❑ The P & ID includes every mechanical aspect of the plant except stream flows, pipe routing, pipe lengths, pipe fittings, supports, structure & foundations ❑ Sets of symbols are used to depict mechanical equipment, piping, piping components, valves, drivers and instrumentation and controls. ❑ There is no universal, national, international standard that specifies what information should be included on a P&ID ❑ Some changes will probably be included when the revision is issued ❑ Reflect process improvements and additions, as well as changing control technology. Introduction to P & ID
- 33. Development of a P & ID ❑ P & IDs develop in steps ❑ Lay out a conceptual pass at showing vessels, equipmentand major piping ❑ The instrumentation and controls are typically added next ❑ Specialists fill in the information regarding the equipment: size, rating, throughput, and utility usage (horsepower) ❑ P & IDs are controlled documents formally issued at various stages. Control means changes to the drawings are identified and documented. ❑ Formal issue process occurs several times in the course of a project.
- 34. Introduction to P & ID It includes, ❑ Basic operational & startup information ❑ Equipment capacity & rating ❑ Piping details (Piping line #, piping class) ❑ All isolation valves with identification ❑ Startup & flushing lines ❑ Interconnections ❑ Vents & drains ❑ Safety relief valves ❑ Control loops & Instrumentation ❑ DCS Inputs ❑ Interlocks ❑ Vendor & contractor interface Defines a process – Equipment, piping and all monitoring & control components
- 35. Piping & Instrumentation Diagram (P & ID) ❑ Used for planning & construction of plant ❑ Used to operate the process ❑ Used for maintenance & modification of process ❑ Used by mechanical technicians & safety personal ❑ Used for HAZOP study of plant ❑ Controlled document formally issued at various stages of project
- 36. P & ID Symbology & Abbreviation
- 37. P & ID Symbols - Abbreviations PRESSURE PC = Controller PI = Indicator PIC = Indicator-controller PR = Recorder TEMPERATURE TE = Temperature sensing element Th = Thermometer Indicator TRC = Recorder-controller TR = Recorder LEVEL LC = Controller LG = Glass LI = Indicator LR = Recorder FLOW FC = Controller FE = Test orifice plate FI = Indicator FR = Recorder
- 38. P & ID Symbols - Abbreviations SELF OPERATED CONTROL VALVES FCV = Flow LCV = Level PCV = Pressure TCV = Temperature MISCELLANEOUS SG = Sight Glass FV = Straightening Vains HC = Hand Control PSD = Pressure Safety Device PSV = Pressure safety valve
- 39. Location Of Instrument Locally Mounted Mounted on panel board in control room Mounted on local panel board Local Transmitter Electric – Pneumatic Converter
- 40. Process Control Loop Simple instruments permit direct reading of a process variable in the field. These devices include pressure gauges, thermometers, level gauges and rotameters. Automatic Control Loop It consists of three parts ❑ Sensing ❑ Comparing ❑ Correcting
- 41. Process Control Loop In automatic control, the three devices – the transmitter that senses, the controller that compares, and the control valve that corrects – are interconnected to form a control loop. The interconnection may be pneumatic, electronic, digital, or a combination of all three. The pneumatic component is typically a 3-15 psig (pounds per square inch gauge) instrument air signal. If the interconnection is electronic, a 4-20 mA (mill amperes) signal is usually used.
- 42. Process Control Loop Sensing : To measure / sense a process variable ❑ Flow of fluid in a pipe ❑ Level of a liquid in a tank ❑ Temperature of a fluid in a vessel ❑ Pressure of gas in a pipe Normally these process variables are measured continuously. A transmitter measures the process in some way and transmits the information to a central location (sends an electrical signal) where the comparison takes place. The central location is usually a control room where plant operators monitor the process, or, the rack room where the process control computer is located that performs the comparison.
- 43. Process Control Loop: Temperature Sensing RTD Thermocouple
- 44. Process Control Loop : Level Sensing Capacitance Type Float Type Differential pressure Type Bubbler Type Radar Type Radioactive
- 46. Process Control Loop : Flow Sensing Magnetic Type Venturi Type Orifice Type Vortex Type Flow Totalizer
- 47. Sight Glass
- 48. Level Glass
- 49. Flow Measurement Flow Glass Orifice Plate Venturi Tube Pitot Tube Flow Totalizer Magnetic Flowmeter Vortex Meter
- 50. Process Control Loop Comparing : The electronic controller is located in control room in the console and its face plate can be observed by the operator via a shared control system, such as a distributed control system (DCS) or a programmable logic controller (PLC). The value of the process variable is compared with the desired value (the set point), and action is taken to develop a signal to bring the two together. The control is automatic and continuous.
- 51. Process Control Correcting : The control device then develops a signal to bring the process variable and the set point together. From the controller an electronic signal is sent to a device (E/P) in the field that computes the correct valve position & send a pneumatic signal to activate the final control element. This device is most often a control valve or a variable speed pump drive. Control valves usually are pneumatically actuated, often by a 3-15 psi signal & are supplied with a positioner to provide feedback of valve position. In order to warn operator about potential problems , high & low level alarms are provided , they receive the same signal from the transmitter as does the controller.
- 52. Final Control Element Electronic to Pneumatic Converter Final Control Element Control Valve
- 53. Process Control Loop Control Valve Action The control action that finally takes place in the field is not describes explicitly in neither PFD nor P & ID. However is a simple matter to infer that if there is an increase in level of a vessel , the control valve will open slightly and the flow of liquid will increase, tending to lower the level in the vessel. For a decrease in the level of liquid, the valve will close slightly.
- 54. Control Loop Tuning Parameters The response time of the system depends upon type of control action used. P - Proportional or gain – how far away the process variable is from the set point I - Integral or reset – how long the process variable has been away from the set point D - Derivative or rate – how fast the process variable is changing
- 55. Process Control Loop Control valves may fail in various positions – open, closed, locked. The position of a failed valve can have a significant impact on associated equipment, and, therefore, it is of interest to operations personnel. The fail positions may be identified on the P&ID using letters below the valve symbol: FO for Fail Open; FC for Fail Closed; FL for Fail Last or Locked.
- 56. Pressure Loop
- 57. Level Loop
- 58. Flow Loop
- 59. P & ID Symbology & Abbreviation Valve type VS VD VR VB VDR VF VM VP Gate Valve Globe, Needle or Angle Valve Plug Valve Ball or 3-way Plug Valve Check Valve Butterfly Valve Diaphragm Valve Piston Valve
- 60. P & ID Symbology & Abbreviation PLUG BUTTERFLY Three-way Valve Four-way Valve CHECK VALVE
- 61. P & ID Symbology & Abbreviation Welded Valve Flanged Valve
- 62. P & ID Symbology & Abbreviation M M Diaphragm operated With Manual Hand wheel Piston Operated Solenoid Operated Motor Operated
- 63. Line Symbols Instrument Connection to Process Pneumatic Signal Electric Signal Hydraulic Signal Capillary Tube Electromagnetic Signal Software Data Link Mechanical Link Line symbols are used to define the ways information is transferred between the field devices and the central control location. The symbols describe how signals are transmitted between devices.
- 64. Line Symbols Hot Insulated Line Cold Insulated Line Jacketed Line Insulated Line with external tracer Capillary Tube Electrical Transmission Pneumatic Transmission Process piping for Instrument
- 65. P & ID Symbology & Abbreviation
- 66. P & ID Symbology & Abbreviation
- 68. Piping Specification & Decoding It provides information about, ❑ Material of construction ❑ Design temperature & pressure ❑ Line size & thickness ❑ Valves & gaskets compatibility ❑ Used for any branching (off-take) R-101 E-101 8˝-41-P28-99A-T
- 69. Piping Specification & Decoding - Just like equipment, pipes on the flow diagram must be identified - Pipe line symbol, is used in which to place this information - In some instances the pipe specification symbol is located directly in the flow line - In other instances the specification information is written above the line 12˝-30-HS33-55A-I 12˝-30-HS33-55A-I
- 70. Piping Specification & Decoding R-101 E-101 8˝- 01- P28 - 99A -T Line Size Area Code Fluid Type Line No. Material Snam. Spec Rating Internal / External Treatment
- 71. Piping Specification & Decoding 12˝-30-HS33-55A-I V-4301 ME-4302 Line Size Area Code Fluid Type Line No. Snam. Spec. Coating Designator
- 72. System Code Area Code 01 : Urea 02 : Reforming Section 03 : CO2 absorption Section 04 : Synthesis gas compression 05 : Ammonia Synthesis 06 : Steam Generation 07 : Power Generation 08 : CW circulation
- 73. Fluid Type KS Very High Pressure Steam HS High Pressure Steam LS Low Pressure Steam P Process Fluid IA Instrument Air UA Utility Air UN Utility Nitrogen 12˝-30-HS33-55A-I
- 74. Material 1 Carbon Steel 3 Austenitic Stainless Steel 4 Reinforced Thermal Resin Pipe 5 Si Killed Carbon Steel or CrMo steel 6 Ferritic Alloy Steel 7 Cast Steel 8 Austenitic SS or Ferritic Alloy Steel 9 Urea Grade SS 55A
- 75. Material Rating 1 150# 3 300# 5 600# 6 900# 7 1500# 8 2500# 9 Special 55A
- 76. Insulation Specification 12˝-30-HS33-55A-I N Not Painted /Insulated PP Personnel Protected S Internal Treated/External Painted A Internal Treated, External coated B External Coated E Electric traced F Cold Insulated I Hot Insulated T Steam traced V External painted W Jacketed
- 77. Ceramic Lined Pipe Concrete Lined Pipe A- Internal Treated, External coated PIPE COATING DESIGNATOR - A
- 78. Coating and wrapping for underground installation B- External coated PIPE COATING DESIGNATOR - B
- 79. PIPE COATING DESIGNATOR - E E- Electric Traced
- 80. PIPE COATING DESIGNATOR - F Cold Insulated pipe for low temperature service F- Cold Insulated
- 81. PIPE COATING DESIGNATOR- I Hot Insulated pipe for High temperature service I- Hot Insulated
- 82. PIPE COATING DESIGNATOR - V V- External Painted Painted Pipe
- 83. PIPE COATING DESIGNATOR - T T- Steam Traced
- 84. PIPE COATING DESIGNATOR - W W- Jacketed
- 89. Process Conditions A B C D A : Operating Temperature (°C) B : Design Pressure (Mpag) C : Design Temperature (°C) D : Full Vacuum
- 90. Radial Vibration Interlock system
- 91. Axial Vibration Interlock system
- 93. Piping Isometrics ❑ Represents 3D structure of pipe between two points ❑ Drawn to scale ❑ All the fittings including, valves, flanges, elbows etc. are clearly represented ❑ Detail about bill of material needed for execution of piping layout ❑ A table gives the number and detailed description of each type of fittings ❑ Computer aided design tool (CAD) is used for creation ❑ Easy to visualize : not overcrowded with other information Used for fabrication and then construction of the piping system
- 97. Equipment Elevation Drawing ❑ Shows the vertical location of process equipment . ❑ It shows the location of process equipments in relation to existing structures and ground level. ❑ Useful for performing startups and shutdowns.
- 100. Piping Support Types Base Support
- 101. Piping Support Types Variable Spring Support Beam Support
- 102. Piping Support Types Anchor Shoes with slide plate U Clamp Support
- 103. Piping Support Types Constant Load Hanger Variable Spring Hanger