Downloaded 247 times

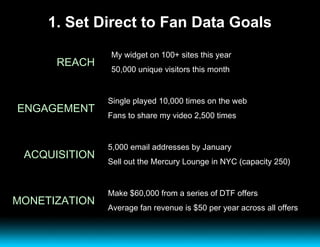
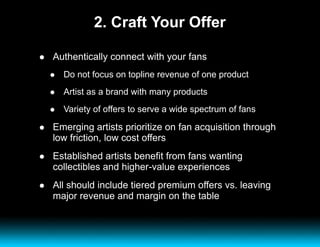

![Further Resources [email_address] Twitter: @shamalman Skype: shamal_topspin Topspin Green Room Topspin Knowledge Base Google Analytics: Conversion University Berklee College of Music Course: Online Music Marketing with Topspin Certificate program: Topspin-Certified Marketer Specialist Copyblogger](https://image.slidesharecdn.com/topspinmarketingwithdataatmidem-100128204641-phpapp02/85/Topspin-s-Marketing-With-Data-Presentation-at-Midem-33-320.jpg)


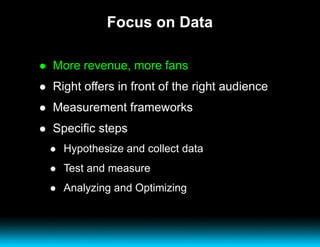
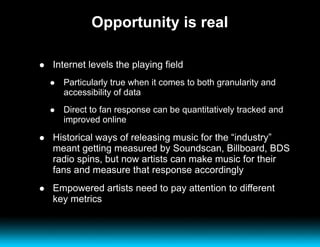
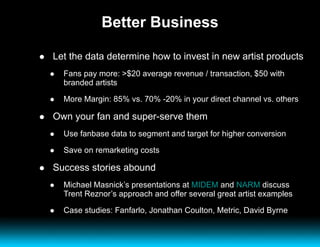
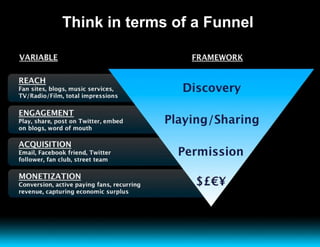
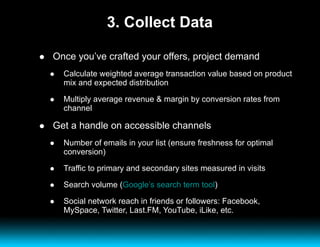
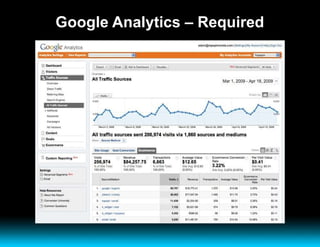
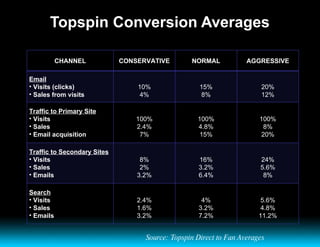
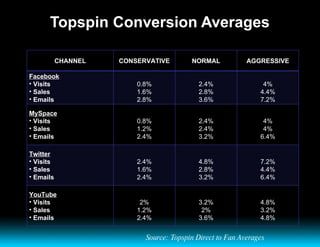
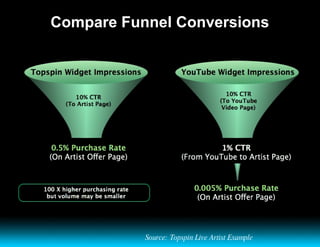
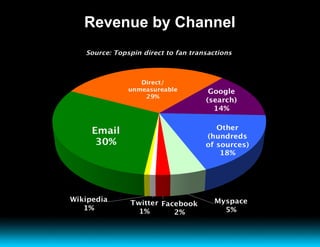
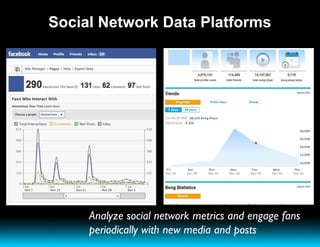
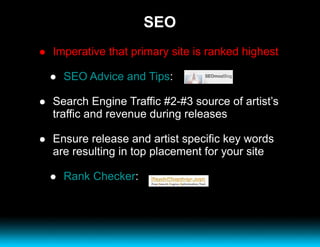
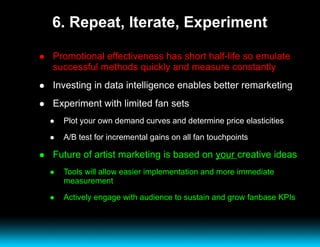
1. The document discusses how artists can leverage data to improve their marketing strategies directly to fans online. It emphasizes setting goals, testing different offers, and analyzing metrics to engage fans and drive revenue. 2. Various channels for acquiring fans and driving traffic are analyzed, including emails, websites, social media, and search. Conversion rates across different channels are provided to help project demand and ROI. 3. An iterative process is recommended where artists continuously test, measure performance, and optimize their approaches based on data insights to better engage and monetize their fanbase over time.


