
Recommended
Recommended
More Related Content
Similar to Training Manual.docx
Similar to Training Manual.docx (20)
Recently uploaded
Recently uploaded (20)
Training Manual.docx
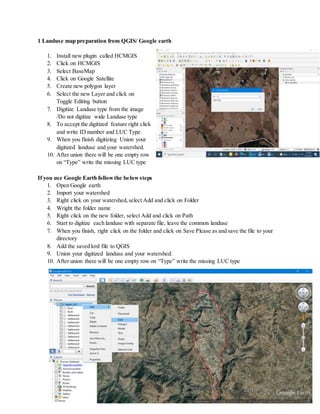
- 1. 1 Landuse map preparation from QGIS/ Google earth 1. Install new plugin called HCMGIS 2. Click on HCMGIS 3. Select BaseMap 4. Click on Google Satellite 5. Create new polygon layer 6. Select the new Layer and click on Toggle Editing button 7. Digitize Landuse type from the image /Do not digitize wide Landuse type 8. To accept the digitized feature right click and write ID number and LUC Type. 9. When you finish digitizing Union your digitized landuse and your watershed. 10. After union there will be one empty row on “Type” write the missing LUC type If you use Google Earth followthe belowsteps 1. Open Google earth 2. Import your watershed 3. Right click on your watershed,select Add and click on Folder 4. Wright the folder name 5. Right click on the new folder, select Add and click on Path 6. Start to digitize each landuse with separate file, leave the common landuse 7. When you finish, right click on the folder and click on Save Please as and save the file to your directory 8. Add the saved kml file to QGIS 9. Union your digitized landuse and your watershed. 10. After union there will be one empty row on “Type” write the missing LUC type
- 2. 2. Editing and Updating Spatial data 2.1 Edit exiting /Reshaping/ data 1. Click Vertex Tool 2. Click on the Layer Vertex will be shown on the Layer 3. Click on one of the vertex and move your curser where you want to move and click, then the shape of your Layer will be changed. 2.2 Delete the existing features 1. Highlight / Select /the Layer you want to edit 2. Click on Toggle Editing tool on the menu bar 3. Select part of the Layer you want to delete 4. Press Delete button on your keyboard 2.3 Split the existing features If the Split Tool is not displayed on your menu bar, right click on top of the QGIS window and check on Digitizing Tools. New tools will be added to your menu bar Click on Split Feature tool from menu bar Click on the boundary where you want to split and digitize and finally right click when you reach to other boundary. 2.4 Merge features
- 3. 1. Select parts of the Layer you want to merge /hold shift key to select more than one feature/ 2. Click on Merge Selected Features button from menu bar, the selected features will be merged and become one feature. 3. TopologyChecker Topologyisthe spatial relationof futureswithrules. Eg. Polygonsmustnotbe overlapped, Polygonsmustnothave gap Polygonsmustnotduplicate etc. Topology checker is plugin in qgis, therefore install the plugin first Click on the topology checker icon Click on configure button Assign rules Click on validate all button You will error list on the topology checker panel Alsoyouwill getredmarkson the map where the eror existes.
- 4. 4. Spatial Analyst Tools 4.1 Clip Raster data 1. Search clip from search box 2. Click on Clip raster with polygon under SAGA 3. Select the woreda DEM on Input box 4. Select the selected watershed under Polygons box 5. Save Clipped file 6. Click Run 4.2 Symbolize raster 1. Right click on clipped DEM
- 5. 2. Click on Symbology on the Layer Property window 3. Select Single band pseudo color under Render Type box 4. Click to classify 5. If you want to change the color, click on the arrow and click on new color Ramp 6. Select Catalog cpt city 7. Select Topography and select Elevation 8. Click ok 4.3 Creating Hillshade 1. Search hillshade from search box 2. Click on Hilshade from Raster terrain analysis option 3. Select DEM file under Elevation Layer box 4. For better visualization make 1.5 on Z factor 5. Leave the rest as default /Azimuth and Vertical angle/ 6. Save Hillshed file 7. Click Run N.B. For better visualization of hillshed and DEM, reduce the transparency of the DEM to 60 and put the hillshade under DEM file.
- 6. 4.4 Create Slope 1. Search slope from search box 2. Click on slope under Raster analysis 3. Select DEM file under Elevation Layer 4. Save Slope file 5. Click on Run 4.5 Reclassify Slope 1. Search reclassify in search box 2. Click Reclassify by Table under Raster Analysis 3. Select Slope Layer under Raster Layer box 4. Click on 3 dotes on Reclassification Table. 5. Write minimum, maximum and value for the respective rows in the table. 6. Click ok 7. Click Run 4.6 Convert to vector and dissolve based on attribute 4.6.1 Convert to vector Follow the previous steps such as poligonize /Raster to polygon/ function, after conversion it is always better to fix geometry of the vector file. Follow the following steps. 1. Search fix on search box
- 7. 2. Click on Fix geometry under Vector geometry 3. Select the converted file under Input Layer box 4. Save fix geometry file 5. Click Run 4.7 Create contour 1. Search contour in the search box 2. Click on Contour under Raster Extraction 3. Select DEM file under Input Layer box 4. Write the contour interval 5. Save contour file 6. Click on Run 5. Creating DEM from Google earth Importyour WatershedtoGoogle earth Draw Path aroundyourwatershed and give name foryour path Rightclickon the name of your path Clicksave Place Asoptionandsave your pathwithfile extensionof KML
- 8. Open your Internet browser and search for “gps visualizer elevation” Click on Assign DEM elevation data to coordinate – GPS Visualizer Click on choose file button and give your path file Click on Convert & add elevation button Click on Download *.gpx file Open Qgis desktop Add point track from the downloaded file Check the name of the column where the elevation is added Interpolate the file using elevation To interpolate: o Open toolbox from qgis o Search IDW o Double click on IDW o Give file name and then field name with that have elevation o Finally you will get your DEM in the map canvas.
- 9. 6. WatershedDelineation What is a Watershed? Watershed is a topographically delineated area drained through a common confluence point on a stream or river, An area that drains rainfall runoff water to a common outlet, Drainage system - The area upon which water fall & the network through which it travels to an outlet. Pour Point - A location at which the rainfall runoff contributing area can be determined. 6.1 Watershed Delineation Methods Different methods have been devised and are used to delineate watersheds. The following are some of the common watershed delineation methods: In this training we will see two of them in detail (watershed Delineation using GPS and topographic map). 1. Watershed delineation using Topographic map (contour, Drainage Patterns), 2. Watershed delineation using hand held GPS (Tracks,points), 3. Automatic watershed delineation from DEM. 6.1.1 Watershed delineationfrom Topographic map Topographic map can be used as a data source to delineate a watershed. In this method contour lines and drainage patterns/networks serve as starting points in delineating a watershed using QGIS software. It is the easiest method of watershed delineation as compared with field delineation using GPS. Before starting delineation watershed from topomaps, you should create new polygon shape file in.
- 10. 6.1.2 Watershed delineationusing GPS points This is another alternative to delineate a watershed. This method is accurate but it is very difficult to do it and time taking. Mostly we can apply for verification /checking/ purpose and to delineate small size community watersheds. To apply this method; 1. GPS points should be collected on the field using hand held GPS, 2. The collected GPS points can be directly transferred into computers using GPS cables and software, 3. Add the transferred data to QGIS and edit errors, if any. 6.1.3 Delineating Watershed by using DEM DEM is a main source of GIS data for watershed delineation. In QGIS some steps should follows to delineate watershed, and these are described below. 1. Fill sinks 1. Add DEM data on qgis 2. Search fill on search box 3. Select fill sink in the terrain analysis-hydrology. 4. On the new dialog box select DEM file 5. Save fill DEM file and leave the rest 6. Click run.
- 11. 2. Creating stream order 1. Search strahler from search box 2. Click on strahler order from terrain analysis channel. 3. Select fill DEM in the elevation box 4. Save the strahler file 5. Click run 3. Remove unnecessary small river braches 1. click on raster on menu bar 2. click on raster calculator 3. double click on straler order file 4. select straler order greater than 5 5. click ok
- 12. 4. Create outlet file Outlets are the point on river junctions where the water passes from the common confluence, it is one of the determinant factors for watershed delineation and it affects the size of the watershed. 1. Click on layer 2. Click on create layer 3. Click on New shepfile 4. Write name and select geometry type point. 5. If you want add two field X and Y and calculate values 5. Watershed delineation 1. search upslope from search box 2. Click upslope area from terrain analysis 3. Copy and paste X-coordinate and Y-coordinate on Target X coordinate and Target Y coordinate. 4. Select Fill DEM on Elevation box. 5. Select deterministic 8 from Method box 6. Save watershed file 7. Click on Run 8. One watershed will be delineated in raster format 6. Conversion 1. Click on Raster on menu bar 2. Click on conversion 3. Click on Polygonize ( Raster to Polygon) 4. Remove the unwanted part by selecting.
- 13. 7. Channel network and drainage basin. /to create vector river channels/ 1. Search channel on search box 2. Click on channel network and drainage basin 3. Select Fill DEM for Elevation box 4. Write 5 on threshold box 5. Remove the tick mark except channels and drainage basin 6. Save the channels and drainage basin files 7. Click Run 8. Clip the river channel 1. Search Clip from search box 2. Click on Clip under vector overlay 3. Select channels in input layer box 4. Select your watershed in overlay layer box 5. Save Clipped file 6. Click on Run The final result looks like the below figure
- 14. If you want to delineate more than one watershed /the entire woreda/,collect from field or create outlet point by the same stapes on the above. And install new plugin called point to catchment zip file. 1. Snap the outlet to the channels 1. Search snap on search box 2. Click on snap geometry to layer 3. Select outlet on input layer box 4. Select channel on Reference layer 5. Write 50 and above on Tolerance box 6. Save the snapped geometry 2. Watershed delineation 1. Expand IHE Delft 2. Click on Calculate catchments from point 3. Select snapped point layer on overflow point layer box 4. Select Fill DEM on DEM Layer box 5. Select Output Folder 6. Click on Run
- 15. N.B Multiple watershed that is equal to your outlet point will be delineated in vector format. The files are single layer to get all in one file you have to merge all files 3. Merge files 1. Search merge on search box 2. Click on Merge vector Layers under Vector general 3. Click on the 3 dot in front of Input Layer box 4. Select all single lyers and click ok 5. Define the projection by clicking on Destination CRS box 6. Save Merged file 7. Click Run N.B Clip your river channels by the merged file The final result looks like the above figure
- 16. 7. Base map and Developmental map preparation 7.1 Base Map Preparation 1. Prepare your Landuse Map 2. Digitize Road, River and Infrastructure Data 3. Prepare Map Layout with basic map elements 4. Export map. 16.2 Location Map Preparation Create the first Data frame and Check Lock Layers and Lock Styles for Layers. With the same way create the second and third data frames and lock it
- 17. 7.3 Developmental Map Preparation Steps to prepare developmental map: 1. Prepare landuse map 2. Prepare slope map, reclassify and convert to vector 3. Clip soil map from the region soil data 4. Intersect the above three maps 5. Dissolve the intersected layer based on LUC type, slope value, soil type and rockiness. 6. Add field called Recommendation with text data type 7. Set criteria for each soil and water conservation technology 8. Open attribute table of the dissolved layer and click on select features using an expressions tool 1. 9. Write the criteria for each SWC technology on the Select by Expressions box 10. Go to the table and write the name the SWC technology for the selected rows and do it for all technologies. 11. Dissolve the layer by using Recommendation field 12. Add field called Area_ha and calculate the area 13. Prepare Map Layout based on the Recommendation Field with appropriate symbology and map layouts. 8. QField for spatial data collection
- 18. 9. Creating Map Layout 1. Click on Projects on top Left of the QGIS Window 2. Click on Layout manager 3. An empty Layout window will open 4. Click on Add Item Menu bar and Click on Add Map tools 5. Make rectangle on the empty layout for your map area,All Maps in QGIS window will appear on the layout. 9.1 Adding map element in map layout 1. Adding a Title:Click on Add Label and Click on the page to place the legend, and move it to where you want it. 2. Adding a Legend: Click on Add legend and Click on the page to place the legend, and move it to where you want it. Not everything on the legend is necessary,so let’s remove some unwanted items. In the Item Properties tab,you’ll find the Legend items panel. Check on show items inside linked maps
- 19. 3. Adding Scale bar: Click on Add Scale Bar tool and Click on the page to place the legend, and move it to where you want it. 4. Adding North Arrow: Click on Add North Arrow and Click on the page to place the legend, and move it to where you want it. 5. Adding Net Line: Select Add shape and Click on Rectangle and Click on the page to place the legend, and move it to where you want it. When it cover your Map change the order of the rectangle below your Map in the Item property window. 6. Adding Grids: Click on the map on your layout or select Map in item property window and find Grid in the item property window 6.1 Click Add button 6.2 Click Modify button 6.3 Edit grid type, Projection, X,Y intervals, Line style, Frame style and tick Draw coordinate option and modify the styles. 15.2 Exporting the Map Layout Finally the map is ready for export! You’ll see the export buttons near the top left corner of the Composer window: The other three buttons allow you to export the map page to a file. There are three export formats to choose from: Export as Image Export as SVG Export as PDF Select Layout menu Click Export as Image or SVG or PDF. As recommendation it is better to use export as image. Use JPEGformat for saving.
- 20. You can change the DPI and other extent or you can keep it Click on Save button The Exported Map looks like this.