
Recommended
Recommended
More Related Content
Similar to Subsurface Miocene Sequence Stratigraphic Framework in the Nile Delta, Egypt.pptx
Similar to Subsurface Miocene Sequence Stratigraphic Framework in the Nile Delta, Egypt.pptx (20)
More from SaadTaman
More from SaadTaman (20)
Recently uploaded
Recently uploaded (20)
Subsurface Miocene Sequence Stratigraphic Framework in the Nile Delta, Egypt.pptx
- 1. Subsurface Miocene sequence stratigraphic framework in the Nile Delta, Egypt The Miocene depositional history of the Nile Delta is dominated by fluvial–deltaic, marginal marine and marine shelf sedimentation. It exhibits radical lateral facies changes due to its tectonic setting. Different attributions in age assignments characterize the Miocene Nile Delta due to the lack of large vertical facies changes, which consists mainly of siliciclastic with different environments. This study uses integrating lithologic, bio stratigraphic, gamma-ray log and benthic foraminiferal biofacies, at four boreholes(Tanta-1, Rommana-1X, El-Fayrouz and Rosetta-7) in the Nile Delta, Egypt. Planktonic foraminifera allow subdivision of the Miocene Nile Delta succession into 12 planktonic biozones and benthic species are used in paleo bathymetic estimates. Eight third-order Nile Delta Miocene sequences are bounded by eight major sequence boundaries, that can be correlated within and outside Egypt based upon planktonic foraminifera biostratigraphy. Chattian/Aquitanian (SB1) and Aquitanian/Burdigalian (SB2), intra-Burdigalian (SB3), Burdigalian/Langian (SB4),Langian/Serravallian (SB5), Serravallian/Tortonian (SB6) Tortonian/Messinian (SB7) and intra-Messinian(SB8): these boundaries in the Nile Delta are controlled by either eustatic processes and/or tectonic events. Each sequence contains a transgressive system tract bounded above by a maximum-flooding surface, and a high stand system tract. The low stand systems tract and falling-stage systems tract is the main gas reservoir in the Nile Delta and recorded only below the Tortonian/Messinian and intra-Messinian sequence boundaries, that are marked by deep incisions and truncations. Variable patterns in the timing of regional deposition and erosion indicate different tectonic and sedimentary regimes, that encompass progressively greater periods of time southward in the Nile Delta
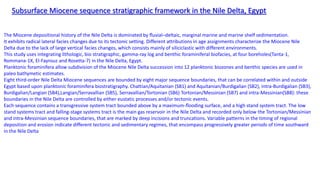
- 2. The Nile Delta has been commonly considered part of the passive leading edge of the colliding African plate along the southern shores of the shrinking Mediterranean Sea (Harms and Wary,1990). It is one of the earliest known deltas in the world and occupies an area of approximately 22,000 km2situated in the north- eastern margin of the African plate at the south-eastern part of the Mediterranean Sea (Fig. 1). The subsurface Miocene successions in the Nile Delta are one of the most important gas reservoirs in Egypt. The Nile Delta at- tracted the attention of many geologists after the giant gas discoveries in the subsurface (Vandre et al., 2007). Nevertheless, there is disagreement about the stratigraphic framework, particularly among different oil companies. The most important investigations have concentrated on the Miocene biostratigraphy and paleoenvironment (Rizzini et al., 1978; Harms and Wary, 1990; Haggag and Abu El Enein, 1991; El-Heiny and Morsi, 1992; Ouda and Obaidalia, 1995; Obeid et al., 2000; Faris et al., 2007; Ismail et al., 2010). The Miocene Nile Delta exhibits radical lateral facies changes due to its tectonic setting, which has led previous authors to use different informal and formal stratigraphic names with different attributions in age assignments. Nile Delta tectonic setting played an important role in configuration of the depositional sequences and the resulted in the initia- tion of many palaeohighs and lows, which played a major role in facies distribution. This made the correlation between these rock units based upon the lithology and geophysical logs very difficult. However, correlations based upon biostratigraphy in different boreholes with the global cycle chart and sequence stratigraphy are very useful tools for local and regional correlations. The main objective of this study is to propose a sequence stratigraphic framework and paleobathymetic framework, using integrated lithological, bio stratigraphic, gamma-ray log, foraminiferal biofacies and their relationship to systems tracts. These well-dated sequences can be correlated with the local and global cycle charts to distinguish the tectonic events from the eustatic signatures within the study stratigraphic successions.
- 4. Comparison of previous lithostratigraphic schemes showing different attributions in age assignments for the subsurface Miocene successions in the Nile Delta basin.
- 5. Lithostratigraphic correlation chart of the subsurface Nile Delta Miocene successions showing its lateral, vertical facies and thickness variations (horizontal distance not to scale).
- 6. Subsurface Miocene planktonic foraminiferal biostratigraphy of the Nile Delta compared to stander biostratigraphic schemes (1 = El-Fayrouz, 2 = Rommana-1X, 3 = Tanta-1 and 4 = Rosetta-7 boreholes).
- 7. Distribution of the most important planktonic foraminifera species, and biostratigraphic zones of the Miocene Nile Delta.
- 31. The Nile Delta has become an economically important region of Egypt, because of large-scale natural gas and oil discoveries in recent decades. The offshore Baltim East field is one of the Nile Delta's major gas producers from the upper Miocene clastic reservoirs, but detailed lithofacies and petrophysical analyses of the Abu Madi gas reservoir have not been conducted to date. This study investigates the petrographical and petrophysical properties of the upper Miocene Abu Madi Formation from the Nile Delta to infer the lithofacies distribution, depositional environments, and reservoir qualities of the Level 3 Main and Lower sands. In this work, we used a variety of data sets, including core samples, petrophysical measurements, and well logs, to identify the most important characteristics of these sandstone reservoirs. Both reservoirs are hydrostatically pressured and exhibit a gas gradient of ∼2.26 MPa/km. We have identified six different lithofacies from the two reservoirs. SEM and thin section analyses indicate that trough cross-bedded (F-1), parallel laminated (F-2), and massive sandstones (F-6) are the primary reservoir lithofacies composed of texturally immature subfeldspathic quartz arenites. These sandstones have sharp bases and exhibit fining-upward trends with ripple laminated siltstone (F-3), heterolithic silt and clay (F-4), and laminated claystone (F-5) facies lying on top. We inferred the reservoir depositional environment as fluvial channels and sequence stratigraphically these incised valley-fills represent low stand systems tract. The reservoir sandstone facies show good porosity (10–28%), mostly interparticle. Chlorite coatings around quartz grains are abundant, while pore-filling kaolinite is the dominant porosity-destroying clay phase. Grain dissolution introduced secondary intergranular porosity along the potassium feldspar cleavage planes within the F-1 lithofacies. Porosity, permeability, and reservoir quality parameters (RQI, NPI, and FZI) calculated from routine core analysis indicate that the F-1 and F-6 lithofacies have excellent hydraulic flow properties with >100 mD permeability, RQI>1 μm and FZI >5 μm, while the fine-to very fine-grained F-2 offers poor to fair reservoir quality defined by a wide permeability range of 0.1–2150 mD. The clay and silt-dominated lithofacies (F-3, F-4, and F-5), due to their impervious nature, act as intra-reservoir vertical permeability barriers. The differences in rock composition and facies control diagenesis and physical properties of the reservoir. The results presented, provide further insight into the exploration of the fluvial channel deposits and regional reservoir quality of the upper Miocene Abu Madi Formation of the Nile Delta
- 32. Arbitrary seismic line passing through different wells in the south-north direction of the Baltim East and North fields (offshore Nile Delta, Egypt), where (1) Bottom Abu Madi, (2) Top Abu Madi, (3) Top Level III Lower, and (4) Top Level III Main.
- 33. Well log signatures and formation pressure gradients within the gasbearing Abu Madi reservoirs from Well BE-1.
- 34. Interpreted lithofacies types in the Abu Madi Formation. (a) F- 1: Trough cross-bedded sandstone, (b) F-2: Parallel laminated sandstone, (c) F-3: Ripple laminated siltstone, (d) F-4: Heterolithic silt and clay, (e) F5: Laminated claystone, and (f) F-6: Massive sandstone.
- 35. Lithofacies distribution within the cored Level 3 Lower reservoir interval in Well BE-1. The blue arrows point towards a fining- upward direction. (For interpretation of the references to colour in this figure legend, the reader is referred to the Web version of this article.)
- 36. Lithofacies distribution within the Level 3 Main reservoir interval in Well BE-1.The blue arrows point towards a fining-upward direction. (For interpretation of the references to colour in this figure legend, the reader is referred to the Web version of this article.)
- 37. High-magnification images of F-6: (a) Thin section showing quartz as dominating mineral phase with minor plagioclase, potassium feldspar, rock fragments, and heavy minerals. Primary interparticle porosity can be seen impregnated with blue dyed resin, depth 3687 m, (b) monocrystalline quartz with minor feldspar, depth 3685.5 m, (c) shows interparticle pores are lined by rimmed chlorite (marked by yellow arrows), depth 3608 m, (d) SEM showing quartz grain coated by chlorite and primary intergranular porosity, depth 3685.5 m, (e) SEM showing pore-filling chlorite plates with denser packing, depth 3608 m, (f) SEM showing chlorite coatings (yellow arrow) and primary intergranular porosity (green arrow), depth 3685.5 m. All samples belong to well BE-1. (For interpretation of the references to colour in this figure legend, the reader is referred to the Web version of this article.)
- 38. Sequence stratigraphy of the Abu Madi Formation and the distribution of the correlated systems tracts, modified after Abdel- Fattah and Tawfik (2015).
- 54. (a) Map of remote‐sensed suspended sediment concentration (SSC) over Wax Lake Delta, Louisiana. Data from Jensen et al. (2019), based on AVIRIS‐NG flyover from 18 October 2016 between 15:25 and 15:41 GMT. (b) Schematic illustrating how change in SSC along a streakline can be used to infer net‐deposition or net‐erosion. The difference between the settling and entrainment fluxes gives the net‐deposition rate. SSC increase from upstream to downstream implies net‐erosion, and SSC decrease implies net‐deposition.
- 55. Procedure for extracting streaklines from image of suspended sediment concentration (SSC). (a) Geometric curvature κ of remote‐sensed SSC. (b) Cost function derived from geometric curvature and SSC. Low concentration (positive κ) streaks have high cost, and high concentration streaks have low cost. (c) Extracted streaklines overlaying the map of SSC.
- 56. (a) Simulated suspended sediment concentration (SSC) from 2D sediment advection‐settling model using hydrodynamic output from ANUGA, overlayed by extracted streaklines. Simulation corresponds to 15:33 GMT on 18 October 2016. (b) True modeled sedimentation rate, calculated as cws. (c) Inferred sedimentation rate from streakline method, −h‖v⃗‖∂c∂s $- h{Vert}vec{v}{Vert}frac{partial c}{partial s}$. Inset shows a region of poor agreement between inferred and simulated sedimentation rates due to diffusion between streaklines. (d) Comparison between inferred sedimentation from streakline method and simulated sedimentation rate, with blue line indicating the mean and gray shading indicating standard deviation, using a bin size of 500 points (22,563 total points). Dashed line indicates 1:1 correspondence
- 57. (a) Map of inferred instantaneous sedimentation rate from the streakline method, based on remote‐sensed suspended sediment concentration (SSC) from 18 October 2016, and depth and velocity magnitude values from the ANUGA hydrodynamic model. Positive sedimentation rate (red) indicates net‐deposition, and negative sedimentation rate (blue) indicates net‐erosion. Insets (b–d) highlight details from the sedimentation rate map. (e) Map of down‐streak SSC gradient, ∂c∂s $frac{partial c}{partial s}$, based on remote‐sensed SSC from 18 October 2016. Positive values (blue) indicate net‐erosion, and negative values (red) indicate net‐deposition.