SlideShare a Scribd company logo
1 of 54
25 YEARS LATER : THE SDT REVISITED.
Ron Lesthaeghe
Feb. 2012
Note the
question format.
ORIGINAL 1986 ARTICLE
Sources of inspiration
• Philippe Ariès : the end of the period of the
“enfant-roi”.
• Reaction to Richard Easterlin’s economic
theory for baby-boom and baby-bust.
• Ronald Inglehart (and A. Maslow): rise of
“post-materialist” needs & values.
The super-narratives ( paradigms)
• Economics (neo-classical):
Homo-economicus, rationality,
cost-benefit calculation.
NO Preference shifts, no ethics or
values.
• Sociology & Psychology :
Accept cost-benefit calculus.
Add Preferences & Values: e.g.
derived from Maslowian drift of
needs.
(e.g.: R. Inglehart Post-
materialism, Lesthaeghe & van
de Kaa SDT)
A. Maslow’s pyramid of needs
1943
R. Inglehart’s postmodernism transition
2005
Lifestyle
contrast
added
Social Class
contrasts
Survival
stressed
Well-being
stressed
The twin transitions: Contrast first & second demographic transitions
• FDT
• EARLIER MARRIAGE
• LOW + DECLINING
COHABITATION
• DECLINING ILLEGITIMACY
• LOW DIVORCE
• HIGH REMARRIAGE
• FERTILITY CONTROL AT
HIGHER AGES
• SHORT Marr-1st Birth Interval
• DEFICIENT
CONTRACEPTION, PARITY
FAILURES
• LOW CHILDLESSNESS
• SDT
• LATER MARRIAGE
• RISE COHABITATION, RISE
SINGLE LIVING
• RISING EXTRA-MARITAL
FERTILITY
• RISE DIVORCE
• LOW REMARRIAGE
• FERTILITY POSTPONEMENT
• EFFICIENT CONTRACEPTION
• HIGHER CHILDLESSNESS
Non-conformism
Postponement
Derived research topics
• 1. Trends and the geographic spread of
the SDT
• 2. Fertility postponement & recuperation.
• 3. The links between the SDT and shifting
values orientations.
• 4. SDT and political voting outcomes.
• 5. Innovation models
• 6. Regional continuities
Life course
progression
neutral
Respar
Single
Coh 0
Mar 0
Coh +
Mar+E
Mar+N
FmNu
Non-conformism = secular,stress individual autonomy,
weaker civil morality, expressive values, distrust
institutions, protest prone, tolerant minorities,world
orientation,"postmaterialist"
Conformism = religious, respect for
authority, trust institutions, conservative
morality, lower tolerance minorities, local or
national identification, expressive values not
stressed.
Respar = resident w ith parents; Single = never married & not in a union; Coh0 = cohabiting & no children;
Mar0 = married & no children; Coh+ = cohabiting w ith children; Mar+E = married w ith children & ever cohabited;
Mar+N = married w ith children & never cohabited; FmNu = formerly married or in union, not yet in new union.
Figure 1 : Flow chart of life course development and hypothesised changes in value
orientations stemming from selection-adaptation mechanism.
Full selection
and adaptation
model requires
panel data.
The “footprints”
model is only
based on
repeated cross-
sections.
European Values Survey 1999-2000 Round : analysis of 80 items via MCA and Benzecry Correspondence Analysis.
Population : men and women 18 through 49.
Step 1: Recode the 80 items so that 1 = non-conformist attitude 0 = conformist. Dichotomization
Step 2: Run Multiple Classification Analysis for each item with 8 categories of household type/trajectory ( Living with
parents, living alone, Cohab no children, Cohab + children, Married 0 children, Married + children never cohab,
idem ever cohab, Formerly Married and not yet in new union), controlling for : gender (2), age and age squared,
Education (4), Employment (5), Urbanity (2). This gives for each item the net deviations from the mean (= overall
% non-conformist) by household category.
Step 3: for each item by household category, recode net deviation to 1 if above the mean, 0 if below. This creates a
distances matrix. Example:
Respar Single Coh0 Coh+ Mar0 Mar+E Mar+N FMNU
item 1 0 0 1 1 0 1 0 1
item 2 0 1 1 1 0 1 0 0
item 80 1 0 1 1 0 0 0 0
Total 43 53 67 62 31 49 25 48
Step 4: Run Correspondence Analysis on above matrix, use projection of items and of household categories in 2
dimensions (discard higher dimensions).
Chart7.1:Number ofpositive netdeviations (= non-conformist) for 80 items according to household position;1999 EVS results for five groups
ofEuropean countries after control for other covariates.
0
10
20
30
40
50
60
70
80
Respar Single Coh0 Coh+ Mar0 Mar+N Mar+E FmNu
Household position respondents
Numberofpositivenetdeviations
Scandinavia-2
West-3
Iberia-2
Central-7
East-5
Number of positive
NET deviations
from item means for
a total of 80 items
indicating a
systematic
preference for the
non-conformist
position. Controls
for: education (4
cat.), employment
position (5), urban-
rural (2), gender (2),
age & age squared.
Respondents aged
18-49.
Deviations for 8
types of household
situations and for 5
groups of European
countries, EVS 1999
0 items picked
All items picked
A: Picks a lot with strong
preference for specific items
of particular type ( e.g. fruits)
B: a lot but indiscriminate
C: picks few items, but with
clear preference that is opposite
from A’s.
D: picks less than average, a
little from everything
Floris van Dijck :”Laid Table”,1622 Jan Davidz de Heem :”A Dessert”,1640
Correspondence Analysis.
West = F+B+D
South = E + P
SDT – Presidential elections
USA
2000 to 2012
Ron Lesthaeghe & Lisa Neidert
Demographic indicators and their two underlying dimensions:
definitions and factor loadings (50 states)
Loading = correlation with: Factor1: SDT* Factor 2 .
Vulnerability * *
% non-Hisp white women 25-29 without children in household, 2000 .933 -.186
% non-Hisp white women 25-29 never married, 2000 .905 -.370
% non-Hisp white ever married women 25-29 without own children in household, 2000 .902 -.097
Abortions per 1000 live births, 1992 .887 .057
% non-Hisp white women 30-34 never married, 2000 .882 -.326
Abortion rate per 1000 women 15-44, 1996 .836 .136
Fertility postponement ratio (fert.30+/ fert.20-29), 2002 .794 -.411
Same sex households per 1000 households, 2000 .754 .191
Non-Hisp white total fertility rate, 2002 -.725 .009
Non-Hisp. white fertility rate 15-19, 2002 -.675 .633
% households that are “families”, 1990 -.642 .328
% households with same or different sex cohabitors, 2000 .517 -.148
Divorce rate per 1000 population, 1990 -.457 .548
Total fertility rate, all races, 2002 .338 -.155
% non-marital births, 1990 .329 .803
% teen births, 1986 -.303 .875
Divorce rate per 1000 population, 1962 -.277 .462
% population 30+ living with and responsible for grandchildren,2000 -.189 .886
% non-marital births, 2000 .182 .851
Factor loadings = or > .500 in bold.
* SDT = Second Demographic Transition dimension ** = Vulnerability of young women and children dimension.
Map of the “Second Demographic Transition” dimension in US counties, ca
2000.
Measured in standard deviations from the counties’ mean (equal to zero).
SDT ca 2000 and
Presidential elections
2012
Extra Hispanic
Extra black
Cartogram of counties : SDT (left) and Election results 2012 (right).
(Areas of counties proportional to population size)
Blue = Democrat
Red = Republican
r = -.880
r = -.871
r = -.839 r = -.887
Zero and partial correlation coefficients between the Second Demographic Transition
dimension in the USA* and the percentage vote for the Republican candidate in 4
presidential elections.
ZERO/PARTIAL CORRELATIONS: SDT factor
Vote for Republican in 2000 2004 2008 2012
No controls -.880 -.871 -.839 -.887
After controls for:
Three structural variables:
Disposable personal income 2001
% population 25+ with BA, 1990
% population metropolitan, 2000
-.787 -.812
-.761 -.847
Three structural variables + Ethnicity
% black, 2000
% Hispanic, 2000
-.841 -.853
-.816 -.866
Three structural variables + Religion
% Evangelical/Mormon
% Catholic
-.734 -.742
-.654 -.784
Religion alone
% Evangelical/Mormon
% Catholic
-.788 -.755
-.699 -.794
* Indicators measured in years around 2000
Reactions :
1990s : Southern and Eastern European colleagues :
“not us, we’re different”.
2003 : Japanese demographers:
“not us, we’re different”
2003: British demographer (Oxford):
“just a northwestern European idiosyncracy”
“only a secondary feature, not a second transition”
Esp
CZ Rep
Bel
1/3
1/2
USA
NZ
Source : D.J. vandeKaa, 2002
Mat = fighting rising prices &
maintaining order
Postmat = giving people greater say &
defending freedom of expression.
Just a Northwestern European idiosyncracy ?
Clearly not !
Well, maybe just a “Western” idiosyncracy ?
=> Far East ?
=> Latin America ?
A glimpse of the Asian marriage postponement :
cohabitation creeping in ?
Incidence and duration of premarital cohabitation in Japan and Taiwan, 2004
• Japan: Gender and Generation Survey, 2004 (Tsuya, 2006)
% Ever-cohabiting Women Men
Age 25-29 (C 1975-80) 20.2 20.6
30-34 (C 1970-75) 16.5 20.6
35-39 (C1965-70) 15.7 15.9
40-44 (C 1960-65) 11.5 15.5
45-49 (C 1955-60) 7.5 10.7
• Japan: Mainichi Shimbun newspaper, 2004 (Raymo, Iwasawa, Bumpass, 2008)
Women % ever cohabiting Mean duration (mths)
Age 25-29 (C 1975-80) 21 21
30-34 (C 1970-75) 21 20
35-39 (C 1965-70) 17 26
40-44 (C 1960-65) 10 21
• Taiwan KAP surveys (Li-Shou Yang)
All married women 20-49 1998 2004
% Ever-cohabiting 12.6 21.6
0%
10%
20%
30%
40%
50%
60%
70%
80%
90%
100%
Chile
Brazil
Bolivia
Argentina
Mexico
CostaRica
Colombia
Ecuador
Venezuela
Cuba
Peru
Panama
1970
1970
1970
1970
1973
1973
1974
1971
1993
1970
2002
2000
2001
2001
2000
2000
2005
2001
2001
2002
2007
2000
Distribution of Regions of Latin American Countries (Box plots):
Rise in percentages cohabiting among all women 25-29 in a union,
ca 1970 to 2000-2007
50 %
33%
75%
% cohabiting union
Data column: M_25_29
0 - 5
5 - 10
10 - 15
15 - 20
20 - 25
25 - 30
30 - 40
40 - 50
50 - 60
60 - 100
No Data
Percentage cohabiting among all women 25-29 currently in a union
Ca 1970 Ca 1980 Ca 1990 Ca 2000
The presumed SDT-TFR
conundrum
• The TFR fallacy
• SDT and the onset of the postponement
transition.
• The neglected part : differential catching
up.
• Getting things right: the cohort approach
SOURCE : D.J. vandeKaa, 2002.
(Inglehart index)
Tomas Sobotka’s replication: SDT2 index with 7 items
(attitudes and values dimension)
This index is based on the 1999/2000 results of the European Values Study, published in
Halman (2001). It is based on the responses in 29 countries to the following questions and
statements.:
“…how important it is in your life: leisure time” (LEISURE, % “very important”)
“How often do you spend time in church, mosque, or synagogue” (CHURCH, % “every
week”);
“Please use the scale to indicate how much freedom of choice and control you feel you have
over the way your life turns out?” (CONTROL, mean value on the scale of 1 (=none control at
all) to 10 (= a great deal of control));
“Do you think that a woman has to have children in order to be fulfilled or is this not
necessary?” (NEED_KIDS, % responses “not necessary”);
“Marriage is an outdated institution” (MARRIAGE, % “agree”);
“A job is alright, but what women really want is a home and children” (F_HOME, % “agree
strongly”);
“One does not have the duty to respect and love parents who have not earned it by their
behaviour and attitudes” (PAR_RESPECT, % “agree”);
“Do you approve or disapprove abortion (…) where a married couple does not want to have
any more children?” (ABORTION, % “approve”).
Several questions were not asked in all the participating countries; the SDT2 index for these
countries was based on the mean score of the responses to the remaining items. Maximum,
minimum and mean values of these indicators and the assigned SDT scores are displayed in
table AP-2.
But a positive association between SDT and period total
fertility : classic case of split correlation
Bulgaria
Poland
GreeceSlovakia
Luxembourg
The Netherlands
United Kingdom Finland
Denmark
France
Sweden
Lithuania
Latvia
Spain
Italy
Hungary
Austria
Estonia
Czech Rep.
Portugal
Germany
Russia
Croatia
Ukraine
Romania
Ireland
Iceland
Slovenia
Belarus
0
1
2
3
4
5
6
7
8
9
10
1.00 1.20 1.40 1.60 1.80 2.00 2.20TFR
SDTIndex
Figure 8a: SDT Index and TFR in 2004 (r=0.71)
All stronger recuperation countries
No or weak recup & late starters
Source of plot : Tomas Sobotka, 2008. Interpretation : Ron Lesthaeghe 2008.
1.50
A strong SDT – fertility postponement link
Lithuania
Russia
Belarus
Bulgaria
Estonia
Slovakia
Romania
Latvia
Poland
Ireland
Czech Republic
Hungary
Portugal
Austria
Slovenia
Croatia
GreeceItaly
Spain
France
United Kingdom
Denmark
Germany
The Netherlands
Finland
Sw eden
0.0
1.0
2.0
3.0
4.0
5.0
6.0
7.0
8.0
9.0
1980 1985 1990 1995 2000 2005 2010
Year when mean age at first birth increased by 2 years
SDT2Index
SDT vanguard
SDT tail
Source: T. Sobotka 2008.
Deficits CCFR Netherlands
-1000
-800
-600
-400
-200
0
200
<20 <20-24 <20-30 <20-34 <20-39 <20-44 <20-45+
Age Brackets and Baseline (1940-44)
Deficets,ThousandsofBirths
1945-1949
1950-1954
1955-1959
1960-1964
1965-1969
1970-1974
1975-1979
1980-1984
Deficits CCFR Portugal
-900
-800
-700
-600
-500
-400
-300
-200
-100
0
100
200
<20 <20-24 <20-30 <20-34 <20-39 <20-44 <20-45+
Age Brackets and Baseline (1940-44)
Deficets,ThousandsofBirths
1945-1949
1950-1954
1955-1959
1960-1964
1965-1969
1970-1974
1975-1979
1980-1984
TROUGH RECUP
PTFR(t+30) = A + B1*BaseCTFR(t=0) + B2*TROUGH(t) + B3*RECUP(t) + e
Trough = deficit in cumulated CASFR at age 30 compared to base
Recup = part of trough recuperated by age 40
Sample= all never communist European countries, baseline = cohort born 1940-44,
predicting PTFRs in period 1960-2005.
RESULT : baseCTFR only Rsq. = .505, baseCTFR + Trough Rsq= .673,
all 3 including Recup then Rsq= .793. Hence : RECUP IS ESSENTIAL.
ONLY countries dip below a TFR below 1.5 that have no or weak recuperation.
The “Bongaarts’ babies” have remained in his cupboard in a large number of
countries, and will stay there for as long as there is no recuperation of fertility after
age 30.
-1.60
-1.40
-1.20
-1.00
-0.80
-0.60
-0.40
-0.20
0.00
0.20
15 20 25 30 35 40
Age
Cumulateddifferencefromthebenchmarkcohort…....
1940
1945
1950
1955
1960
1965
1970
1975
1980
Benchmark C TF R (1940 cohort): 2.93
-1.60
-1.40
-1.20
-1.00
-0.80
-0.60
-0.40
-0.20
0.00
0.20
15 20 25 30 35 40
Age
Cumulateddifferencefromthebenchmarkcohort…....
1955
1960
1965
1970
1975
1980
Benchmark C TF R (1955 cohort): 1.90
-0.50
-0.40
-0.30
-0.20
-0.10
0.00
0.10
15 20 25 30 35 40
Age
Cumulateddifferencefromthebenchmarkcohort…....
1955
1960
1965
1970
1975
1980
Benchmark C TF R1 (1955 cohort): 0.896
-0.50
-0.40
-0.30
-0.20
-0.10
0.00
0.10
15 20 25 30 35 40
Age
Cumulateddifferencefromthebenchmarkcohort…....
1955
1960
1965
1970
1975
1980
Benchmark C TF R3+ (1955 cohort): 0.334
Postponement and recuperation in Spanish cohort fertility
Source: Sobotka,
Szeman,
Lesthaeghe &
Frejka, 2010
SDT and TFRs : inconsistent
or double effect ?
Social & Economic
constraints (education,
employment, housing
…)
Self-actualisation;
“open future”
Emancipation: gender
equity
Affirmative policies re
gender roles, child
care, reduced
opportunity costs of
motherhood.
Postponement
Recuperation
Overall fertility
+
+
_
+
SDT
Conclusions and expectations :
1. SDT clearly spread beyond northwestern Europe and their overseas
counterparts (Canada, Australia, New Zealand, USA) to Mediterranean
countries, all the formerly Communist ones, and even to the Far East. Also
very large increase of the “non-conformist” part of the SDT in Latin America.
2. New contexts obviously translate into greater pattern heterogeneity, as was
plainly evident during the First DT.
e.g. * strong period effects that act as either catalysts or breaks;
* different bottlenecks in the RWA conditions;
* different levels of sub-replacement fertility can result, from close to replacement to
“lowest-low” (=> degree of recuperation essential factor);
* different mitigating effects of institutional factors and policies (e.g. in the domain of
gender equity,facilities for working parents, schooling hours & day care, income
redistribution).
3. The motor of the SDT – the Maslowian mechanism – is a universal one, and
the global development of the SDT in the 21st Century is therefore likely to
broadly follow the increases in both GDP AND the spread of democracy.
4. All scientific propositions are falsifiable => Keep testing empirically !!
…and the link with the ideational dimensions ?
• Values and household formation paths: Selection &
adaptation and the “footprints” model.
• Empirical checks in all Europe’s corners, data base =
1999-2000 EVS with “ever cohabited” question
• The European Values Surveys (EVS) : 80 items used
here
Link with values also in the far East ?
World Values Studies has nothing on cohabitation in Asian
countries or more detailed household structure : just current
marital status and number of children. Current cohabitation
(“living as married”) in Latin American WVS.
But we can relate timing of marriage and parenthood to age,
education, occupational status, urbanity, and to the wealth of
value orientations.
Data for women in Japan, South Korea and Singapore, ages
18-45. But pooling of survey rounds again necessary to
compensate for small sample sizes.
Use is again made of the items that were used in the EVS-
based “footprints model”.
Number of items with effects on postponement of parenthood in
expected direction (net effects after controls for age, education, job status) World Values
Studies, Women aged 18-45.
Japan South Korea Singapore
1995, 2000 1994, 2001 2002
a.Family and gender items 15 of 16
15 of
16 13 of 16
b.Socialization traits 7 of 9 9 of 9 7 of 9
c.Work characteristics 5 of 5 na 9 of 10
d.Political orientations 19 of 20
17 of
19 7 of 9
e. Ethics and morality
issues 8 of 10 7 of 9 9 of 9
d.Religion 4 of 10 2 of 3 8of 10
Total 58 of 70
50 of
56 53 of 63
total % 82.9 89.3 84.10%
Postponmt + weak
or no recuperation
Postponement +
stronger recuperation
Less
postponement but
quantum drop
How do countries line up ?
SDT-based expectation very good when considering the postponement of
marriage and parenthood : high on SDT => earlier and stronger
postponement.
But TFR line-up goes the other way : high on SDT => higher TFR, no
“lowest-low fertility”.
Essential to distinguish between the postponement and catching up
effect. Latter now MAJOR determinant of national differentials in overall
fertility in “never Communist” Europe where SDT started earliest. Pure
postponement models are INADEQUATE.
Differential catching up will lead to differential childlessness as well.
Some SDT-values foster postponement, but some ( gender equity ones)
may be associated with low childlessness and better catching up at later
ages.
Flawed conclusions are popping up …..
• True: in many societies (Eastern Europe, Latin America) both cohabitation
and percentages of births out-of-wedlock have risen more (often much more
!!) among the less educated men and women.
• True: there are both economic and historical reasons why cohabitation rose
more rapidly at the lower end of the educational spectrum.(e.g. low entry
and exit costs; pre-existing cohabitation models, marriage =
“enbourgeoisement”).
• False: “this proves that the rise in cohabitation has nothing to do with
values changes and that SDT theory does not hold”. (e.g. Perelli-Harris
et al.)
• Reason: The values changes in the direction of greater individual autonomy
(the W-condition) have changed for EVERYBODY over the last decades.
Without that there wouldn’t have been a rise in cohabitation ANYWHERE to
start with. Cross-sectional educational differentials do NOT account for the
trend (composition effect of rising education would imply less, not more
cohabitation !).
• Conclusion : AGAIN “Ready AND Willing AND Able” and the Willingness
condition is no longer the brake (= SDT verified !).
Extra-marital births as percent all births -- Northern and Western Europe
0
10
20
30
40
50
60
70
1960 1970 1980 1990 2002
Year
%
Iceland
Sweden
Norway
France
UK
Germany-East
Germany-West
Netherlands
Austria
Belgium
Switzerland
Ireland
1986 : SDT
conceptualized
Extra-maritalbirthsaspercentofallbirths--Baltic,CentralandEasternEurope
0
10
20
30
40
50
60
1960 1970 1980 1990 2002
Year
%
Estonia
Latvia
Lithuania
Poland
SlovakRepub.
CzechRepub
Hungary
Slovenia
Croatia
Serbia+Montenegro
Bulgaria
RussianFederat.
Romania
Moldova
Ukraine
1986= SDT
conceptualized
Extra-marital births as percent of all births -- Southern Europe
0
5
10
15
20
25
30
1960 1970 1980 1990 2002
Year
%
Portugal
Spain
Italy
Greece
Macedonia
Malta
Cyprus
1986 = SDT
conceptualized
Number of positive (= unconventional) net deviations,
80 items, EVS 1999
0
10
20
30
40
50
60
70
80Res.par.
Single
Coh
0
Coh
+
M
ar0
M
ar+
n
M
ar+
e
Fm
Nu
Household position respondents
Positivenetdeviations
Austria
Germany
Belgium
France
Czech R.
Cro/Slvn
Pol/Lith.
Hun/Slvk
Spa/Port
Swe/Den
item mns
Eastern Europe is
NOT different from the
rest with respect to the
values profiles !
Former Communist Europe : Crisis or transition ?
Countries line up :
1. Countries that recovered best re real GDP recovery by 2000 have the larger
increases in mean ages at first marriage and at first birth. Contrary to crisis
hypothesis.
2. Countries that score highest on index of gender empowerment and on self-
realization ( Inglehart & Welzel ) have the highest increases in mean ages at
first birth. Consistent with SDT.
3. No other significant correlations with size drop TFR 1989-2000, or size
increase extra-marital fertility 1990-2000.
Social class differentials.
Greater / earlier rise of premarital cohabitation among lower educated or lower
socio-econ strata is by no means an indicator of the crisis hypothesis. This
feature is often found in other societies as well (e.g. Sweden and USA).
Historically: cohabitation was lower class feature in most societies.
Timing
Postponement trends in FCC’s often predate the 1989-Wende.
Former Communist Countries and Demographic change in the period 1989-
2000 : do they line up ?
Zero order correlations between indicators of economic performance,
indicators of Value orientations ( Inglehart & Welzel), and indicators of
demographic change.
Size Drop Size Rise in Size Rise in Mean Age:
in TFR extramar. Fert. 1st marr. 1st birth
Index recovery real GDP ’90=100 .283 ns .008 ns .665 * .622 *
Index recovery total employment ’89=100 -.408 ns .119 ns .078 ns .264 ns
Index recovery industrial output ’89=100 -.195 ns .011 ns .267 ns .165 ns
UN Index gender empowerment ca 2000 .139 ns -.010 ns .289 ns .581 *
Percent self-expressiveness ca mid-90s .065 ns -.250 ns .283 ns .517 *
Conclusion :
*Not much of a line up expected on the basis of the differences in strength of
economic recovery. Where there is a significant correlation (* at.05), it’s
reversed : best GDP-recovering countries have largest postponements.
*SDT based line up not strong either, but significant correlations are at least
in line with expectations.
Sources : UNECE ESE 2002-1;Council of Europe, 2002; Inglehart & Welzel, 2005, UN Human Development Report.
Can the SDT spread to non-western populations ?
• Overall answer : spread of SDT already occurring in other societies,
but not necessarily according to a western sequence:
• Far East: Marriage and fertility postponement starts BEFORE rise in
cohabitation, but in Latin America it is the other way around.
• Lowest-Low fertility in Japan, S. Korea, Singapore, Hong Kong caused by
massive postponement and weak recuperation.
• Sub-replacement fertility in Caribbean area (from Cuba to Trinidad ), in 2
Indian states and several Indian metropolitan areas, and even in several
Muslim populations (Tunisia, Iran). Lowest-low fertility widespread in most
populated Chinese provinces.
• Take off of premarital cohabitation documented in Japan and Taiwan.
• In Japan, Korea, Singapore : postponement of parenthood equally linked to
expressive and individualistic value orientations at the micro level ( but not
or less strongly to religion/secularism).
• Major increase of cohabitation in all Latin American countries.
Source: S. Klüsener et al, 2012

More Related Content

Similar to Ced nov 2012 25years sdt values focus

Ready willing_and_able paradigm as precondition behavioural change
Ready  willing_and_able paradigm as precondition behavioural changeReady  willing_and_able paradigm as precondition behavioural change
Ready willing_and_able paradigm as precondition behavioural changeRon Lesthaeghe
 
Barcelona fertility in sdt march 2010
Barcelona fertility in sdt  march 2010Barcelona fertility in sdt  march 2010
Barcelona fertility in sdt march 2010Ron Lesthaeghe
 
Women in a Bind: The Decline of Marriage, Markets and the State - Mimi Abramo...
Women in a Bind: The Decline of Marriage, Markets and the State - Mimi Abramo...Women in a Bind: The Decline of Marriage, Markets and the State - Mimi Abramo...
Women in a Bind: The Decline of Marriage, Markets and the State - Mimi Abramo...rpesapan
 
The Second Demographic Transition: Trends and Expectations for the new Century
The Second Demographic Transition: Trends and Expectations for the new CenturyThe Second Demographic Transition: Trends and Expectations for the new Century
The Second Demographic Transition: Trends and Expectations for the new CenturyFundación Ramón Areces
 
Changes in latin american family formation 25 05
Changes in latin american family formation 25 05Changes in latin american family formation 25 05
Changes in latin american family formation 25 05Ron Lesthaeghe
 
Aa lesthaeghe lopez stockholm version belg spain rwa[2]
Aa lesthaeghe lopez stockholm version belg spain rwa[2]Aa lesthaeghe lopez stockholm version belg spain rwa[2]
Aa lesthaeghe lopez stockholm version belg spain rwa[2]Ron Lesthaeghe
 
Age &amp; sex, population growth (30 1-2017) by dr min ko ko
Age &amp; sex, population growth  (30 1-2017)  by dr min ko koAge &amp; sex, population growth  (30 1-2017)  by dr min ko ko
Age &amp; sex, population growth (30 1-2017) by dr min ko koMmedsc Hahm
 
IPC IG Seminar- SAE : "Middle class values"
IPC IG Seminar- SAE : "Middle class values"IPC IG Seminar- SAE : "Middle class values"
IPC IG Seminar- SAE : "Middle class values"UNDP Policy Centre
 
Unit 10. Population & demographic tensions
Unit 10. Population & demographic tensionsUnit 10. Population & demographic tensions
Unit 10. Population & demographic tensionsRocío Bautista
 
Kaow arsom lesthaeghe cohabitationglobal -
Kaow arsom lesthaeghe cohabitationglobal -Kaow arsom lesthaeghe cohabitationglobal -
Kaow arsom lesthaeghe cohabitationglobal -Ron Lesthaeghe
 
Population Geography
Population Geography Population Geography
Population Geography Ran Li
 
Cmss Vi Nations Units Analysis
Cmss Vi Nations Units AnalysisCmss Vi Nations Units Analysis
Cmss Vi Nations Units Analysisjdubrow2000
 
Digital Demography - WWW'17 Tutorial - Part I
Digital Demography - WWW'17 Tutorial - Part IDigital Demography - WWW'17 Tutorial - Part I
Digital Demography - WWW'17 Tutorial - Part IBogdan State
 
GEOGRAPHY CAMBRIDGE IGCSE: POPULATION AND MIGRATION
GEOGRAPHY CAMBRIDGE IGCSE: POPULATION AND MIGRATIONGEOGRAPHY CAMBRIDGE IGCSE: POPULATION AND MIGRATION
GEOGRAPHY CAMBRIDGE IGCSE: POPULATION AND MIGRATIONGeorge Dumitrache
 

Similar to Ced nov 2012 25years sdt values focus (20)

Ready willing_and_able paradigm as precondition behavioural change
Ready  willing_and_able paradigm as precondition behavioural changeReady  willing_and_able paradigm as precondition behavioural change
Ready willing_and_able paradigm as precondition behavioural change
 
Barcelona fertility in sdt march 2010
Barcelona fertility in sdt  march 2010Barcelona fertility in sdt  march 2010
Barcelona fertility in sdt march 2010
 
Women in a Bind: The Decline of Marriage, Markets and the State - Mimi Abramo...
Women in a Bind: The Decline of Marriage, Markets and the State - Mimi Abramo...Women in a Bind: The Decline of Marriage, Markets and the State - Mimi Abramo...
Women in a Bind: The Decline of Marriage, Markets and the State - Mimi Abramo...
 
Poverty reduction, Charles Waldegrave
Poverty reduction, Charles WaldegravePoverty reduction, Charles Waldegrave
Poverty reduction, Charles Waldegrave
 
The Second Demographic Transition: Trends and Expectations for the new Century
The Second Demographic Transition: Trends and Expectations for the new CenturyThe Second Demographic Transition: Trends and Expectations for the new Century
The Second Demographic Transition: Trends and Expectations for the new Century
 
Changes in latin american family formation 25 05
Changes in latin american family formation 25 05Changes in latin american family formation 25 05
Changes in latin american family formation 25 05
 
Aa lesthaeghe lopez stockholm version belg spain rwa[2]
Aa lesthaeghe lopez stockholm version belg spain rwa[2]Aa lesthaeghe lopez stockholm version belg spain rwa[2]
Aa lesthaeghe lopez stockholm version belg spain rwa[2]
 
Age &amp; sex, population growth (30 1-2017) by dr min ko ko
Age &amp; sex, population growth  (30 1-2017)  by dr min ko koAge &amp; sex, population growth  (30 1-2017)  by dr min ko ko
Age &amp; sex, population growth (30 1-2017) by dr min ko ko
 
Ined lesthaeghe
Ined lesthaegheIned lesthaeghe
Ined lesthaeghe
 
IPC IG Seminar- SAE : "Middle class values"
IPC IG Seminar- SAE : "Middle class values"IPC IG Seminar- SAE : "Middle class values"
IPC IG Seminar- SAE : "Middle class values"
 
Unit 10. Population & demographic tensions
Unit 10. Population & demographic tensionsUnit 10. Population & demographic tensions
Unit 10. Population & demographic tensions
 
Kaow arsom lesthaeghe cohabitationglobal -
Kaow arsom lesthaeghe cohabitationglobal -Kaow arsom lesthaeghe cohabitationglobal -
Kaow arsom lesthaeghe cohabitationglobal -
 
Demography
DemographyDemography
Demography
 
FES_valarino
FES_valarinoFES_valarino
FES_valarino
 
Population Geography
Population Geography Population Geography
Population Geography
 
Cmss Vi Nations Units Analysis
Cmss Vi Nations Units AnalysisCmss Vi Nations Units Analysis
Cmss Vi Nations Units Analysis
 
Lecture01.pdf
Lecture01.pdfLecture01.pdf
Lecture01.pdf
 
Digital Demography - WWW'17 Tutorial - Part I
Digital Demography - WWW'17 Tutorial - Part IDigital Demography - WWW'17 Tutorial - Part I
Digital Demography - WWW'17 Tutorial - Part I
 
Pop. Dynamics
Pop. DynamicsPop. Dynamics
Pop. Dynamics
 
GEOGRAPHY CAMBRIDGE IGCSE: POPULATION AND MIGRATION
GEOGRAPHY CAMBRIDGE IGCSE: POPULATION AND MIGRATIONGEOGRAPHY CAMBRIDGE IGCSE: POPULATION AND MIGRATION
GEOGRAPHY CAMBRIDGE IGCSE: POPULATION AND MIGRATION
 

More from Ron Lesthaeghe

Us elections 1968 2016 plus sdt
Us elections 1968 2016 plus   sdtUs elections 1968 2016 plus   sdt
Us elections 1968 2016 plus sdtRon Lesthaeghe
 
The fertility transition in Sub-Sahara Africa: Quo Vadis ?
The fertility transition in Sub-Sahara Africa: Quo Vadis ?The fertility transition in Sub-Sahara Africa: Quo Vadis ?
The fertility transition in Sub-Sahara Africa: Quo Vadis ?Ron Lesthaeghe
 
Rl acad 2, 15mei2018 krimp, vergrijzing, ontgroening, vervangingsmigratie
Rl acad 2, 15mei2018 krimp, vergrijzing, ontgroening, vervangingsmigratieRl acad 2, 15mei2018 krimp, vergrijzing, ontgroening, vervangingsmigratie
Rl acad 2, 15mei2018 krimp, vergrijzing, ontgroening, vervangingsmigratieRon Lesthaeghe
 
Belgium immigr lesthaeghe
Belgium immigr lesthaegheBelgium immigr lesthaeghe
Belgium immigr lesthaegheRon Lesthaeghe
 
Mexico eur hist_leuven_lesthaeghe_et_al (1)
Mexico eur hist_leuven_lesthaeghe_et_al (1)Mexico eur hist_leuven_lesthaeghe_et_al (1)
Mexico eur hist_leuven_lesthaeghe_et_al (1)Ron Lesthaeghe
 
Lesthaeghe spatial continuities in demographic transitions &amp; the rwa model
Lesthaeghe spatial continuities in demographic transitions &amp; the rwa modelLesthaeghe spatial continuities in demographic transitions &amp; the rwa model
Lesthaeghe spatial continuities in demographic transitions &amp; the rwa modelRon Lesthaeghe
 
Am cohab ced_paa_2016 corrected
Am cohab ced_paa_2016 correctedAm cohab ced_paa_2016 corrected
Am cohab ced_paa_2016 correctedRon Lesthaeghe
 
Alghero presentation lesthaeghe
Alghero presentation lesthaegheAlghero presentation lesthaeghe
Alghero presentation lesthaegheRon Lesthaeghe
 

More from Ron Lesthaeghe (9)

Us elections 1968 2016 plus sdt
Us elections 1968 2016 plus   sdtUs elections 1968 2016 plus   sdt
Us elections 1968 2016 plus sdt
 
The fertility transition in Sub-Sahara Africa: Quo Vadis ?
The fertility transition in Sub-Sahara Africa: Quo Vadis ?The fertility transition in Sub-Sahara Africa: Quo Vadis ?
The fertility transition in Sub-Sahara Africa: Quo Vadis ?
 
Rl acad 2, 15mei2018 krimp, vergrijzing, ontgroening, vervangingsmigratie
Rl acad 2, 15mei2018 krimp, vergrijzing, ontgroening, vervangingsmigratieRl acad 2, 15mei2018 krimp, vergrijzing, ontgroening, vervangingsmigratie
Rl acad 2, 15mei2018 krimp, vergrijzing, ontgroening, vervangingsmigratie
 
Belgium immigr lesthaeghe
Belgium immigr lesthaegheBelgium immigr lesthaeghe
Belgium immigr lesthaeghe
 
Mexico eur hist_leuven_lesthaeghe_et_al (1)
Mexico eur hist_leuven_lesthaeghe_et_al (1)Mexico eur hist_leuven_lesthaeghe_et_al (1)
Mexico eur hist_leuven_lesthaeghe_et_al (1)
 
Rep migpptmaastricht
Rep migpptmaastrichtRep migpptmaastricht
Rep migpptmaastricht
 
Lesthaeghe spatial continuities in demographic transitions &amp; the rwa model
Lesthaeghe spatial continuities in demographic transitions &amp; the rwa modelLesthaeghe spatial continuities in demographic transitions &amp; the rwa model
Lesthaeghe spatial continuities in demographic transitions &amp; the rwa model
 
Am cohab ced_paa_2016 corrected
Am cohab ced_paa_2016 correctedAm cohab ced_paa_2016 corrected
Am cohab ced_paa_2016 corrected
 
Alghero presentation lesthaeghe
Alghero presentation lesthaegheAlghero presentation lesthaeghe
Alghero presentation lesthaeghe
 

Recently uploaded

GFP in rDNA Technology (Biotechnology).pptx
GFP in rDNA Technology (Biotechnology).pptxGFP in rDNA Technology (Biotechnology).pptx
GFP in rDNA Technology (Biotechnology).pptxAleenaTreesaSaji
 
GBSN - Microbiology (Unit 2)
GBSN - Microbiology (Unit 2)GBSN - Microbiology (Unit 2)
GBSN - Microbiology (Unit 2)Areesha Ahmad
 
Recombination DNA Technology (Nucleic Acid Hybridization )
Recombination DNA Technology (Nucleic Acid Hybridization )Recombination DNA Technology (Nucleic Acid Hybridization )
Recombination DNA Technology (Nucleic Acid Hybridization )aarthirajkumar25
 
STERILITY TESTING OF PHARMACEUTICALS ppt by DR.C.P.PRINCE
STERILITY TESTING OF PHARMACEUTICALS ppt by DR.C.P.PRINCESTERILITY TESTING OF PHARMACEUTICALS ppt by DR.C.P.PRINCE
STERILITY TESTING OF PHARMACEUTICALS ppt by DR.C.P.PRINCEPRINCE C P
 
Green chemistry and Sustainable development.pptx
Green chemistry  and Sustainable development.pptxGreen chemistry  and Sustainable development.pptx
Green chemistry and Sustainable development.pptxRajatChauhan518211
 
Botany 4th semester file By Sumit Kumar yadav.pdf
Botany 4th semester file By Sumit Kumar yadav.pdfBotany 4th semester file By Sumit Kumar yadav.pdf
Botany 4th semester file By Sumit Kumar yadav.pdfSumit Kumar yadav
 
Animal Communication- Auditory and Visual.pptx
Animal Communication- Auditory and Visual.pptxAnimal Communication- Auditory and Visual.pptx
Animal Communication- Auditory and Visual.pptxUmerFayaz5
 
Discovery of an Accretion Streamer and a Slow Wide-angle Outflow around FUOri...
Discovery of an Accretion Streamer and a Slow Wide-angle Outflow around FUOri...Discovery of an Accretion Streamer and a Slow Wide-angle Outflow around FUOri...
Discovery of an Accretion Streamer and a Slow Wide-angle Outflow around FUOri...Sérgio Sacani
 
All-domain Anomaly Resolution Office U.S. Department of Defense (U) Case: “Eg...
All-domain Anomaly Resolution Office U.S. Department of Defense (U) Case: “Eg...All-domain Anomaly Resolution Office U.S. Department of Defense (U) Case: “Eg...
All-domain Anomaly Resolution Office U.S. Department of Defense (U) Case: “Eg...Sérgio Sacani
 
Chemistry 4th semester series (krishna).pdf
Chemistry 4th semester series (krishna).pdfChemistry 4th semester series (krishna).pdf
Chemistry 4th semester series (krishna).pdfSumit Kumar yadav
 
Lucknow 💋 Russian Call Girls Lucknow Finest Escorts Service 8923113531 Availa...
Lucknow 💋 Russian Call Girls Lucknow Finest Escorts Service 8923113531 Availa...Lucknow 💋 Russian Call Girls Lucknow Finest Escorts Service 8923113531 Availa...
Lucknow 💋 Russian Call Girls Lucknow Finest Escorts Service 8923113531 Availa...anilsa9823
 
Botany krishna series 2nd semester Only Mcq type questions
Botany krishna series 2nd semester Only Mcq type questionsBotany krishna series 2nd semester Only Mcq type questions
Botany krishna series 2nd semester Only Mcq type questionsSumit Kumar yadav
 
Unlocking the Potential: Deep dive into ocean of Ceramic Magnets.pptx
Unlocking  the Potential: Deep dive into ocean of Ceramic Magnets.pptxUnlocking  the Potential: Deep dive into ocean of Ceramic Magnets.pptx
Unlocking the Potential: Deep dive into ocean of Ceramic Magnets.pptxanandsmhk
 
Chromatin Structure | EUCHROMATIN | HETEROCHROMATIN
Chromatin Structure | EUCHROMATIN | HETEROCHROMATINChromatin Structure | EUCHROMATIN | HETEROCHROMATIN
Chromatin Structure | EUCHROMATIN | HETEROCHROMATINsankalpkumarsahoo174
 
Pests of cotton_Borer_Pests_Binomics_Dr.UPR.pdf
Pests of cotton_Borer_Pests_Binomics_Dr.UPR.pdfPests of cotton_Borer_Pests_Binomics_Dr.UPR.pdf
Pests of cotton_Borer_Pests_Binomics_Dr.UPR.pdfPirithiRaju
 
Isotopic evidence of long-lived volcanism on Io
Isotopic evidence of long-lived volcanism on IoIsotopic evidence of long-lived volcanism on Io
Isotopic evidence of long-lived volcanism on IoSérgio Sacani
 
Raman spectroscopy.pptx M Pharm, M Sc, Advanced Spectral Analysis
Raman spectroscopy.pptx M Pharm, M Sc, Advanced Spectral AnalysisRaman spectroscopy.pptx M Pharm, M Sc, Advanced Spectral Analysis
Raman spectroscopy.pptx M Pharm, M Sc, Advanced Spectral AnalysisDiwakar Mishra
 
Spermiogenesis or Spermateleosis or metamorphosis of spermatid
Spermiogenesis or Spermateleosis or metamorphosis of spermatidSpermiogenesis or Spermateleosis or metamorphosis of spermatid
Spermiogenesis or Spermateleosis or metamorphosis of spermatidSarthak Sekhar Mondal
 

Recently uploaded (20)

CELL -Structural and Functional unit of life.pdf
CELL -Structural and Functional unit of life.pdfCELL -Structural and Functional unit of life.pdf
CELL -Structural and Functional unit of life.pdf
 
GFP in rDNA Technology (Biotechnology).pptx
GFP in rDNA Technology (Biotechnology).pptxGFP in rDNA Technology (Biotechnology).pptx
GFP in rDNA Technology (Biotechnology).pptx
 
GBSN - Microbiology (Unit 2)
GBSN - Microbiology (Unit 2)GBSN - Microbiology (Unit 2)
GBSN - Microbiology (Unit 2)
 
Recombination DNA Technology (Nucleic Acid Hybridization )
Recombination DNA Technology (Nucleic Acid Hybridization )Recombination DNA Technology (Nucleic Acid Hybridization )
Recombination DNA Technology (Nucleic Acid Hybridization )
 
STERILITY TESTING OF PHARMACEUTICALS ppt by DR.C.P.PRINCE
STERILITY TESTING OF PHARMACEUTICALS ppt by DR.C.P.PRINCESTERILITY TESTING OF PHARMACEUTICALS ppt by DR.C.P.PRINCE
STERILITY TESTING OF PHARMACEUTICALS ppt by DR.C.P.PRINCE
 
Green chemistry and Sustainable development.pptx
Green chemistry  and Sustainable development.pptxGreen chemistry  and Sustainable development.pptx
Green chemistry and Sustainable development.pptx
 
Botany 4th semester file By Sumit Kumar yadav.pdf
Botany 4th semester file By Sumit Kumar yadav.pdfBotany 4th semester file By Sumit Kumar yadav.pdf
Botany 4th semester file By Sumit Kumar yadav.pdf
 
Animal Communication- Auditory and Visual.pptx
Animal Communication- Auditory and Visual.pptxAnimal Communication- Auditory and Visual.pptx
Animal Communication- Auditory and Visual.pptx
 
Discovery of an Accretion Streamer and a Slow Wide-angle Outflow around FUOri...
Discovery of an Accretion Streamer and a Slow Wide-angle Outflow around FUOri...Discovery of an Accretion Streamer and a Slow Wide-angle Outflow around FUOri...
Discovery of an Accretion Streamer and a Slow Wide-angle Outflow around FUOri...
 
All-domain Anomaly Resolution Office U.S. Department of Defense (U) Case: “Eg...
All-domain Anomaly Resolution Office U.S. Department of Defense (U) Case: “Eg...All-domain Anomaly Resolution Office U.S. Department of Defense (U) Case: “Eg...
All-domain Anomaly Resolution Office U.S. Department of Defense (U) Case: “Eg...
 
Chemistry 4th semester series (krishna).pdf
Chemistry 4th semester series (krishna).pdfChemistry 4th semester series (krishna).pdf
Chemistry 4th semester series (krishna).pdf
 
Lucknow 💋 Russian Call Girls Lucknow Finest Escorts Service 8923113531 Availa...
Lucknow 💋 Russian Call Girls Lucknow Finest Escorts Service 8923113531 Availa...Lucknow 💋 Russian Call Girls Lucknow Finest Escorts Service 8923113531 Availa...
Lucknow 💋 Russian Call Girls Lucknow Finest Escorts Service 8923113531 Availa...
 
Botany krishna series 2nd semester Only Mcq type questions
Botany krishna series 2nd semester Only Mcq type questionsBotany krishna series 2nd semester Only Mcq type questions
Botany krishna series 2nd semester Only Mcq type questions
 
Unlocking the Potential: Deep dive into ocean of Ceramic Magnets.pptx
Unlocking  the Potential: Deep dive into ocean of Ceramic Magnets.pptxUnlocking  the Potential: Deep dive into ocean of Ceramic Magnets.pptx
Unlocking the Potential: Deep dive into ocean of Ceramic Magnets.pptx
 
Chromatin Structure | EUCHROMATIN | HETEROCHROMATIN
Chromatin Structure | EUCHROMATIN | HETEROCHROMATINChromatin Structure | EUCHROMATIN | HETEROCHROMATIN
Chromatin Structure | EUCHROMATIN | HETEROCHROMATIN
 
Pests of cotton_Borer_Pests_Binomics_Dr.UPR.pdf
Pests of cotton_Borer_Pests_Binomics_Dr.UPR.pdfPests of cotton_Borer_Pests_Binomics_Dr.UPR.pdf
Pests of cotton_Borer_Pests_Binomics_Dr.UPR.pdf
 
Isotopic evidence of long-lived volcanism on Io
Isotopic evidence of long-lived volcanism on IoIsotopic evidence of long-lived volcanism on Io
Isotopic evidence of long-lived volcanism on Io
 
Engler and Prantl system of classification in plant taxonomy
Engler and Prantl system of classification in plant taxonomyEngler and Prantl system of classification in plant taxonomy
Engler and Prantl system of classification in plant taxonomy
 
Raman spectroscopy.pptx M Pharm, M Sc, Advanced Spectral Analysis
Raman spectroscopy.pptx M Pharm, M Sc, Advanced Spectral AnalysisRaman spectroscopy.pptx M Pharm, M Sc, Advanced Spectral Analysis
Raman spectroscopy.pptx M Pharm, M Sc, Advanced Spectral Analysis
 
Spermiogenesis or Spermateleosis or metamorphosis of spermatid
Spermiogenesis or Spermateleosis or metamorphosis of spermatidSpermiogenesis or Spermateleosis or metamorphosis of spermatid
Spermiogenesis or Spermateleosis or metamorphosis of spermatid
 

Ced nov 2012 25years sdt values focus

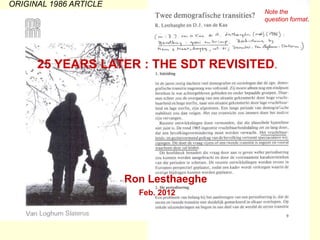
  • 1. 25 YEARS LATER : THE SDT REVISITED. Ron Lesthaeghe Feb. 2012 Note the question format. ORIGINAL 1986 ARTICLE
  • 2. Sources of inspiration • Philippe Ariès : the end of the period of the “enfant-roi”. • Reaction to Richard Easterlin’s economic theory for baby-boom and baby-bust. • Ronald Inglehart (and A. Maslow): rise of “post-materialist” needs & values.
  • 3. The super-narratives ( paradigms) • Economics (neo-classical): Homo-economicus, rationality, cost-benefit calculation. NO Preference shifts, no ethics or values. • Sociology & Psychology : Accept cost-benefit calculus. Add Preferences & Values: e.g. derived from Maslowian drift of needs. (e.g.: R. Inglehart Post- materialism, Lesthaeghe & van de Kaa SDT)
  • 4. A. Maslow’s pyramid of needs 1943 R. Inglehart’s postmodernism transition 2005 Lifestyle contrast added Social Class contrasts Survival stressed Well-being stressed
  • 5. The twin transitions: Contrast first & second demographic transitions • FDT • EARLIER MARRIAGE • LOW + DECLINING COHABITATION • DECLINING ILLEGITIMACY • LOW DIVORCE • HIGH REMARRIAGE • FERTILITY CONTROL AT HIGHER AGES • SHORT Marr-1st Birth Interval • DEFICIENT CONTRACEPTION, PARITY FAILURES • LOW CHILDLESSNESS • SDT • LATER MARRIAGE • RISE COHABITATION, RISE SINGLE LIVING • RISING EXTRA-MARITAL FERTILITY • RISE DIVORCE • LOW REMARRIAGE • FERTILITY POSTPONEMENT • EFFICIENT CONTRACEPTION • HIGHER CHILDLESSNESS Non-conformism Postponement
  • 6. Derived research topics • 1. Trends and the geographic spread of the SDT • 2. Fertility postponement & recuperation. • 3. The links between the SDT and shifting values orientations. • 4. SDT and political voting outcomes. • 5. Innovation models • 6. Regional continuities
  • 7.
  • 8. Life course progression neutral Respar Single Coh 0 Mar 0 Coh + Mar+E Mar+N FmNu Non-conformism = secular,stress individual autonomy, weaker civil morality, expressive values, distrust institutions, protest prone, tolerant minorities,world orientation,"postmaterialist" Conformism = religious, respect for authority, trust institutions, conservative morality, lower tolerance minorities, local or national identification, expressive values not stressed. Respar = resident w ith parents; Single = never married & not in a union; Coh0 = cohabiting & no children; Mar0 = married & no children; Coh+ = cohabiting w ith children; Mar+E = married w ith children & ever cohabited; Mar+N = married w ith children & never cohabited; FmNu = formerly married or in union, not yet in new union. Figure 1 : Flow chart of life course development and hypothesised changes in value orientations stemming from selection-adaptation mechanism. Full selection and adaptation model requires panel data. The “footprints” model is only based on repeated cross- sections.
  • 9. European Values Survey 1999-2000 Round : analysis of 80 items via MCA and Benzecry Correspondence Analysis. Population : men and women 18 through 49. Step 1: Recode the 80 items so that 1 = non-conformist attitude 0 = conformist. Dichotomization Step 2: Run Multiple Classification Analysis for each item with 8 categories of household type/trajectory ( Living with parents, living alone, Cohab no children, Cohab + children, Married 0 children, Married + children never cohab, idem ever cohab, Formerly Married and not yet in new union), controlling for : gender (2), age and age squared, Education (4), Employment (5), Urbanity (2). This gives for each item the net deviations from the mean (= overall % non-conformist) by household category. Step 3: for each item by household category, recode net deviation to 1 if above the mean, 0 if below. This creates a distances matrix. Example: Respar Single Coh0 Coh+ Mar0 Mar+E Mar+N FMNU item 1 0 0 1 1 0 1 0 1 item 2 0 1 1 1 0 1 0 0 item 80 1 0 1 1 0 0 0 0 Total 43 53 67 62 31 49 25 48 Step 4: Run Correspondence Analysis on above matrix, use projection of items and of household categories in 2 dimensions (discard higher dimensions).
  • 10. Chart7.1:Number ofpositive netdeviations (= non-conformist) for 80 items according to household position;1999 EVS results for five groups ofEuropean countries after control for other covariates. 0 10 20 30 40 50 60 70 80 Respar Single Coh0 Coh+ Mar0 Mar+N Mar+E FmNu Household position respondents Numberofpositivenetdeviations Scandinavia-2 West-3 Iberia-2 Central-7 East-5 Number of positive NET deviations from item means for a total of 80 items indicating a systematic preference for the non-conformist position. Controls for: education (4 cat.), employment position (5), urban- rural (2), gender (2), age & age squared. Respondents aged 18-49. Deviations for 8 types of household situations and for 5 groups of European countries, EVS 1999
  • 11. 0 items picked All items picked A: Picks a lot with strong preference for specific items of particular type ( e.g. fruits) B: a lot but indiscriminate C: picks few items, but with clear preference that is opposite from A’s. D: picks less than average, a little from everything Floris van Dijck :”Laid Table”,1622 Jan Davidz de Heem :”A Dessert”,1640 Correspondence Analysis.
  • 12.
  • 14. South = E + P
  • 15. SDT – Presidential elections USA 2000 to 2012 Ron Lesthaeghe & Lisa Neidert
  • 16. Demographic indicators and their two underlying dimensions: definitions and factor loadings (50 states) Loading = correlation with: Factor1: SDT* Factor 2 . Vulnerability * * % non-Hisp white women 25-29 without children in household, 2000 .933 -.186 % non-Hisp white women 25-29 never married, 2000 .905 -.370 % non-Hisp white ever married women 25-29 without own children in household, 2000 .902 -.097 Abortions per 1000 live births, 1992 .887 .057 % non-Hisp white women 30-34 never married, 2000 .882 -.326 Abortion rate per 1000 women 15-44, 1996 .836 .136 Fertility postponement ratio (fert.30+/ fert.20-29), 2002 .794 -.411 Same sex households per 1000 households, 2000 .754 .191 Non-Hisp white total fertility rate, 2002 -.725 .009 Non-Hisp. white fertility rate 15-19, 2002 -.675 .633 % households that are “families”, 1990 -.642 .328 % households with same or different sex cohabitors, 2000 .517 -.148 Divorce rate per 1000 population, 1990 -.457 .548 Total fertility rate, all races, 2002 .338 -.155 % non-marital births, 1990 .329 .803 % teen births, 1986 -.303 .875 Divorce rate per 1000 population, 1962 -.277 .462 % population 30+ living with and responsible for grandchildren,2000 -.189 .886 % non-marital births, 2000 .182 .851 Factor loadings = or > .500 in bold. * SDT = Second Demographic Transition dimension ** = Vulnerability of young women and children dimension.
  • 17. Map of the “Second Demographic Transition” dimension in US counties, ca 2000. Measured in standard deviations from the counties’ mean (equal to zero).
  • 18. SDT ca 2000 and Presidential elections 2012 Extra Hispanic Extra black
  • 19. Cartogram of counties : SDT (left) and Election results 2012 (right). (Areas of counties proportional to population size) Blue = Democrat Red = Republican
  • 20. r = -.880 r = -.871 r = -.839 r = -.887
  • 21. Zero and partial correlation coefficients between the Second Demographic Transition dimension in the USA* and the percentage vote for the Republican candidate in 4 presidential elections. ZERO/PARTIAL CORRELATIONS: SDT factor Vote for Republican in 2000 2004 2008 2012 No controls -.880 -.871 -.839 -.887 After controls for: Three structural variables: Disposable personal income 2001 % population 25+ with BA, 1990 % population metropolitan, 2000 -.787 -.812 -.761 -.847 Three structural variables + Ethnicity % black, 2000 % Hispanic, 2000 -.841 -.853 -.816 -.866 Three structural variables + Religion % Evangelical/Mormon % Catholic -.734 -.742 -.654 -.784 Religion alone % Evangelical/Mormon % Catholic -.788 -.755 -.699 -.794 * Indicators measured in years around 2000
  • 22. Reactions : 1990s : Southern and Eastern European colleagues : “not us, we’re different”. 2003 : Japanese demographers: “not us, we’re different” 2003: British demographer (Oxford): “just a northwestern European idiosyncracy” “only a secondary feature, not a second transition”
  • 24.
  • 25. Source : D.J. vandeKaa, 2002 Mat = fighting rising prices & maintaining order Postmat = giving people greater say & defending freedom of expression.
  • 26. Just a Northwestern European idiosyncracy ? Clearly not ! Well, maybe just a “Western” idiosyncracy ? => Far East ? => Latin America ?
  • 27. A glimpse of the Asian marriage postponement : cohabitation creeping in ?
  • 28. Incidence and duration of premarital cohabitation in Japan and Taiwan, 2004 • Japan: Gender and Generation Survey, 2004 (Tsuya, 2006) % Ever-cohabiting Women Men Age 25-29 (C 1975-80) 20.2 20.6 30-34 (C 1970-75) 16.5 20.6 35-39 (C1965-70) 15.7 15.9 40-44 (C 1960-65) 11.5 15.5 45-49 (C 1955-60) 7.5 10.7 • Japan: Mainichi Shimbun newspaper, 2004 (Raymo, Iwasawa, Bumpass, 2008) Women % ever cohabiting Mean duration (mths) Age 25-29 (C 1975-80) 21 21 30-34 (C 1970-75) 21 20 35-39 (C 1965-70) 17 26 40-44 (C 1960-65) 10 21 • Taiwan KAP surveys (Li-Shou Yang) All married women 20-49 1998 2004 % Ever-cohabiting 12.6 21.6
  • 30. % cohabiting union Data column: M_25_29 0 - 5 5 - 10 10 - 15 15 - 20 20 - 25 25 - 30 30 - 40 40 - 50 50 - 60 60 - 100 No Data Percentage cohabiting among all women 25-29 currently in a union Ca 1970 Ca 1980 Ca 1990 Ca 2000
  • 31. The presumed SDT-TFR conundrum • The TFR fallacy • SDT and the onset of the postponement transition. • The neglected part : differential catching up. • Getting things right: the cohort approach
  • 32. SOURCE : D.J. vandeKaa, 2002. (Inglehart index)
  • 33. Tomas Sobotka’s replication: SDT2 index with 7 items (attitudes and values dimension) This index is based on the 1999/2000 results of the European Values Study, published in Halman (2001). It is based on the responses in 29 countries to the following questions and statements.: “…how important it is in your life: leisure time” (LEISURE, % “very important”) “How often do you spend time in church, mosque, or synagogue” (CHURCH, % “every week”); “Please use the scale to indicate how much freedom of choice and control you feel you have over the way your life turns out?” (CONTROL, mean value on the scale of 1 (=none control at all) to 10 (= a great deal of control)); “Do you think that a woman has to have children in order to be fulfilled or is this not necessary?” (NEED_KIDS, % responses “not necessary”); “Marriage is an outdated institution” (MARRIAGE, % “agree”); “A job is alright, but what women really want is a home and children” (F_HOME, % “agree strongly”); “One does not have the duty to respect and love parents who have not earned it by their behaviour and attitudes” (PAR_RESPECT, % “agree”); “Do you approve or disapprove abortion (…) where a married couple does not want to have any more children?” (ABORTION, % “approve”). Several questions were not asked in all the participating countries; the SDT2 index for these countries was based on the mean score of the responses to the remaining items. Maximum, minimum and mean values of these indicators and the assigned SDT scores are displayed in table AP-2.
  • 34. But a positive association between SDT and period total fertility : classic case of split correlation Bulgaria Poland GreeceSlovakia Luxembourg The Netherlands United Kingdom Finland Denmark France Sweden Lithuania Latvia Spain Italy Hungary Austria Estonia Czech Rep. Portugal Germany Russia Croatia Ukraine Romania Ireland Iceland Slovenia Belarus 0 1 2 3 4 5 6 7 8 9 10 1.00 1.20 1.40 1.60 1.80 2.00 2.20TFR SDTIndex Figure 8a: SDT Index and TFR in 2004 (r=0.71) All stronger recuperation countries No or weak recup & late starters Source of plot : Tomas Sobotka, 2008. Interpretation : Ron Lesthaeghe 2008. 1.50
  • 35. A strong SDT – fertility postponement link Lithuania Russia Belarus Bulgaria Estonia Slovakia Romania Latvia Poland Ireland Czech Republic Hungary Portugal Austria Slovenia Croatia GreeceItaly Spain France United Kingdom Denmark Germany The Netherlands Finland Sw eden 0.0 1.0 2.0 3.0 4.0 5.0 6.0 7.0 8.0 9.0 1980 1985 1990 1995 2000 2005 2010 Year when mean age at first birth increased by 2 years SDT2Index SDT vanguard SDT tail Source: T. Sobotka 2008.
  • 36. Deficits CCFR Netherlands -1000 -800 -600 -400 -200 0 200 <20 <20-24 <20-30 <20-34 <20-39 <20-44 <20-45+ Age Brackets and Baseline (1940-44) Deficets,ThousandsofBirths 1945-1949 1950-1954 1955-1959 1960-1964 1965-1969 1970-1974 1975-1979 1980-1984 Deficits CCFR Portugal -900 -800 -700 -600 -500 -400 -300 -200 -100 0 100 200 <20 <20-24 <20-30 <20-34 <20-39 <20-44 <20-45+ Age Brackets and Baseline (1940-44) Deficets,ThousandsofBirths 1945-1949 1950-1954 1955-1959 1960-1964 1965-1969 1970-1974 1975-1979 1980-1984 TROUGH RECUP PTFR(t+30) = A + B1*BaseCTFR(t=0) + B2*TROUGH(t) + B3*RECUP(t) + e Trough = deficit in cumulated CASFR at age 30 compared to base Recup = part of trough recuperated by age 40 Sample= all never communist European countries, baseline = cohort born 1940-44, predicting PTFRs in period 1960-2005. RESULT : baseCTFR only Rsq. = .505, baseCTFR + Trough Rsq= .673, all 3 including Recup then Rsq= .793. Hence : RECUP IS ESSENTIAL. ONLY countries dip below a TFR below 1.5 that have no or weak recuperation. The “Bongaarts’ babies” have remained in his cupboard in a large number of countries, and will stay there for as long as there is no recuperation of fertility after age 30.
  • 37. -1.60 -1.40 -1.20 -1.00 -0.80 -0.60 -0.40 -0.20 0.00 0.20 15 20 25 30 35 40 Age Cumulateddifferencefromthebenchmarkcohort….... 1940 1945 1950 1955 1960 1965 1970 1975 1980 Benchmark C TF R (1940 cohort): 2.93 -1.60 -1.40 -1.20 -1.00 -0.80 -0.60 -0.40 -0.20 0.00 0.20 15 20 25 30 35 40 Age Cumulateddifferencefromthebenchmarkcohort….... 1955 1960 1965 1970 1975 1980 Benchmark C TF R (1955 cohort): 1.90 -0.50 -0.40 -0.30 -0.20 -0.10 0.00 0.10 15 20 25 30 35 40 Age Cumulateddifferencefromthebenchmarkcohort….... 1955 1960 1965 1970 1975 1980 Benchmark C TF R1 (1955 cohort): 0.896 -0.50 -0.40 -0.30 -0.20 -0.10 0.00 0.10 15 20 25 30 35 40 Age Cumulateddifferencefromthebenchmarkcohort….... 1955 1960 1965 1970 1975 1980 Benchmark C TF R3+ (1955 cohort): 0.334 Postponement and recuperation in Spanish cohort fertility Source: Sobotka, Szeman, Lesthaeghe & Frejka, 2010
  • 38. SDT and TFRs : inconsistent or double effect ? Social & Economic constraints (education, employment, housing …) Self-actualisation; “open future” Emancipation: gender equity Affirmative policies re gender roles, child care, reduced opportunity costs of motherhood. Postponement Recuperation Overall fertility + + _ + SDT
  • 39. Conclusions and expectations : 1. SDT clearly spread beyond northwestern Europe and their overseas counterparts (Canada, Australia, New Zealand, USA) to Mediterranean countries, all the formerly Communist ones, and even to the Far East. Also very large increase of the “non-conformist” part of the SDT in Latin America. 2. New contexts obviously translate into greater pattern heterogeneity, as was plainly evident during the First DT. e.g. * strong period effects that act as either catalysts or breaks; * different bottlenecks in the RWA conditions; * different levels of sub-replacement fertility can result, from close to replacement to “lowest-low” (=> degree of recuperation essential factor); * different mitigating effects of institutional factors and policies (e.g. in the domain of gender equity,facilities for working parents, schooling hours & day care, income redistribution). 3. The motor of the SDT – the Maslowian mechanism – is a universal one, and the global development of the SDT in the 21st Century is therefore likely to broadly follow the increases in both GDP AND the spread of democracy. 4. All scientific propositions are falsifiable => Keep testing empirically !!
  • 40. …and the link with the ideational dimensions ? • Values and household formation paths: Selection & adaptation and the “footprints” model. • Empirical checks in all Europe’s corners, data base = 1999-2000 EVS with “ever cohabited” question • The European Values Surveys (EVS) : 80 items used here
  • 41. Link with values also in the far East ? World Values Studies has nothing on cohabitation in Asian countries or more detailed household structure : just current marital status and number of children. Current cohabitation (“living as married”) in Latin American WVS. But we can relate timing of marriage and parenthood to age, education, occupational status, urbanity, and to the wealth of value orientations. Data for women in Japan, South Korea and Singapore, ages 18-45. But pooling of survey rounds again necessary to compensate for small sample sizes. Use is again made of the items that were used in the EVS- based “footprints model”.
  • 42. Number of items with effects on postponement of parenthood in expected direction (net effects after controls for age, education, job status) World Values Studies, Women aged 18-45. Japan South Korea Singapore 1995, 2000 1994, 2001 2002 a.Family and gender items 15 of 16 15 of 16 13 of 16 b.Socialization traits 7 of 9 9 of 9 7 of 9 c.Work characteristics 5 of 5 na 9 of 10 d.Political orientations 19 of 20 17 of 19 7 of 9 e. Ethics and morality issues 8 of 10 7 of 9 9 of 9 d.Religion 4 of 10 2 of 3 8of 10 Total 58 of 70 50 of 56 53 of 63 total % 82.9 89.3 84.10%
  • 43.
  • 44. Postponmt + weak or no recuperation Postponement + stronger recuperation Less postponement but quantum drop
  • 45. How do countries line up ? SDT-based expectation very good when considering the postponement of marriage and parenthood : high on SDT => earlier and stronger postponement. But TFR line-up goes the other way : high on SDT => higher TFR, no “lowest-low fertility”. Essential to distinguish between the postponement and catching up effect. Latter now MAJOR determinant of national differentials in overall fertility in “never Communist” Europe where SDT started earliest. Pure postponement models are INADEQUATE. Differential catching up will lead to differential childlessness as well. Some SDT-values foster postponement, but some ( gender equity ones) may be associated with low childlessness and better catching up at later ages.
  • 46. Flawed conclusions are popping up ….. • True: in many societies (Eastern Europe, Latin America) both cohabitation and percentages of births out-of-wedlock have risen more (often much more !!) among the less educated men and women. • True: there are both economic and historical reasons why cohabitation rose more rapidly at the lower end of the educational spectrum.(e.g. low entry and exit costs; pre-existing cohabitation models, marriage = “enbourgeoisement”). • False: “this proves that the rise in cohabitation has nothing to do with values changes and that SDT theory does not hold”. (e.g. Perelli-Harris et al.) • Reason: The values changes in the direction of greater individual autonomy (the W-condition) have changed for EVERYBODY over the last decades. Without that there wouldn’t have been a rise in cohabitation ANYWHERE to start with. Cross-sectional educational differentials do NOT account for the trend (composition effect of rising education would imply less, not more cohabitation !). • Conclusion : AGAIN “Ready AND Willing AND Able” and the Willingness condition is no longer the brake (= SDT verified !).
  • 47. Extra-marital births as percent all births -- Northern and Western Europe 0 10 20 30 40 50 60 70 1960 1970 1980 1990 2002 Year % Iceland Sweden Norway France UK Germany-East Germany-West Netherlands Austria Belgium Switzerland Ireland 1986 : SDT conceptualized
  • 48. Extra-maritalbirthsaspercentofallbirths--Baltic,CentralandEasternEurope 0 10 20 30 40 50 60 1960 1970 1980 1990 2002 Year % Estonia Latvia Lithuania Poland SlovakRepub. CzechRepub Hungary Slovenia Croatia Serbia+Montenegro Bulgaria RussianFederat. Romania Moldova Ukraine 1986= SDT conceptualized
  • 49. Extra-marital births as percent of all births -- Southern Europe 0 5 10 15 20 25 30 1960 1970 1980 1990 2002 Year % Portugal Spain Italy Greece Macedonia Malta Cyprus 1986 = SDT conceptualized
  • 50. Number of positive (= unconventional) net deviations, 80 items, EVS 1999 0 10 20 30 40 50 60 70 80Res.par. Single Coh 0 Coh + M ar0 M ar+ n M ar+ e Fm Nu Household position respondents Positivenetdeviations Austria Germany Belgium France Czech R. Cro/Slvn Pol/Lith. Hun/Slvk Spa/Port Swe/Den item mns Eastern Europe is NOT different from the rest with respect to the values profiles !
  • 51. Former Communist Europe : Crisis or transition ? Countries line up : 1. Countries that recovered best re real GDP recovery by 2000 have the larger increases in mean ages at first marriage and at first birth. Contrary to crisis hypothesis. 2. Countries that score highest on index of gender empowerment and on self- realization ( Inglehart & Welzel ) have the highest increases in mean ages at first birth. Consistent with SDT. 3. No other significant correlations with size drop TFR 1989-2000, or size increase extra-marital fertility 1990-2000. Social class differentials. Greater / earlier rise of premarital cohabitation among lower educated or lower socio-econ strata is by no means an indicator of the crisis hypothesis. This feature is often found in other societies as well (e.g. Sweden and USA). Historically: cohabitation was lower class feature in most societies. Timing Postponement trends in FCC’s often predate the 1989-Wende.
  • 52. Former Communist Countries and Demographic change in the period 1989- 2000 : do they line up ? Zero order correlations between indicators of economic performance, indicators of Value orientations ( Inglehart & Welzel), and indicators of demographic change. Size Drop Size Rise in Size Rise in Mean Age: in TFR extramar. Fert. 1st marr. 1st birth Index recovery real GDP ’90=100 .283 ns .008 ns .665 * .622 * Index recovery total employment ’89=100 -.408 ns .119 ns .078 ns .264 ns Index recovery industrial output ’89=100 -.195 ns .011 ns .267 ns .165 ns UN Index gender empowerment ca 2000 .139 ns -.010 ns .289 ns .581 * Percent self-expressiveness ca mid-90s .065 ns -.250 ns .283 ns .517 * Conclusion : *Not much of a line up expected on the basis of the differences in strength of economic recovery. Where there is a significant correlation (* at.05), it’s reversed : best GDP-recovering countries have largest postponements. *SDT based line up not strong either, but significant correlations are at least in line with expectations. Sources : UNECE ESE 2002-1;Council of Europe, 2002; Inglehart & Welzel, 2005, UN Human Development Report.
  • 53. Can the SDT spread to non-western populations ? • Overall answer : spread of SDT already occurring in other societies, but not necessarily according to a western sequence: • Far East: Marriage and fertility postponement starts BEFORE rise in cohabitation, but in Latin America it is the other way around. • Lowest-Low fertility in Japan, S. Korea, Singapore, Hong Kong caused by massive postponement and weak recuperation. • Sub-replacement fertility in Caribbean area (from Cuba to Trinidad ), in 2 Indian states and several Indian metropolitan areas, and even in several Muslim populations (Tunisia, Iran). Lowest-low fertility widespread in most populated Chinese provinces. • Take off of premarital cohabitation documented in Japan and Taiwan. • In Japan, Korea, Singapore : postponement of parenthood equally linked to expressive and individualistic value orientations at the micro level ( but not or less strongly to religion/secularism). • Major increase of cohabitation in all Latin American countries.
  • 54. Source: S. Klüsener et al, 2012