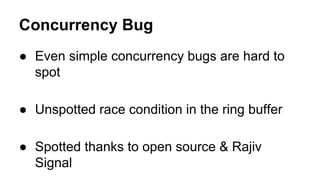
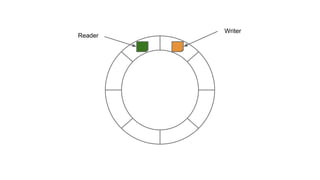
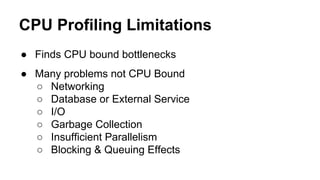
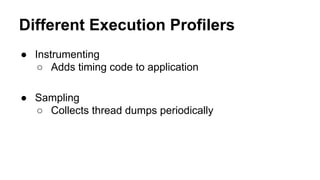
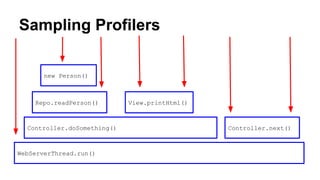
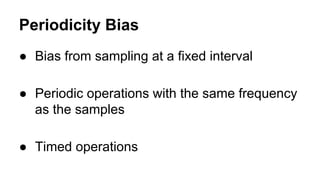
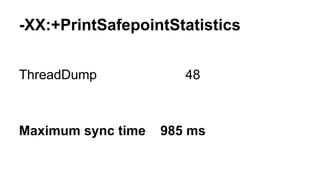
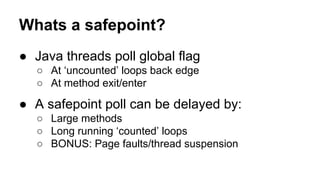
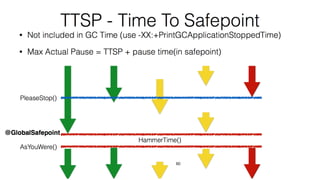
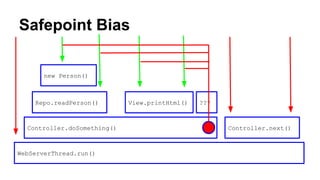
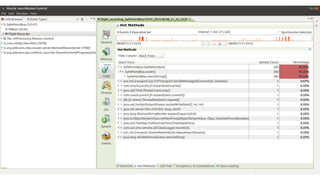
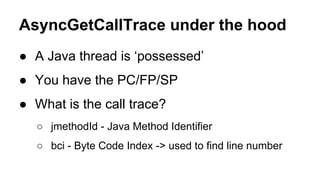
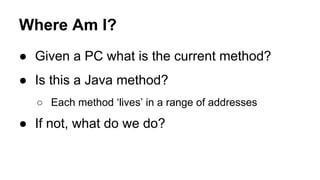
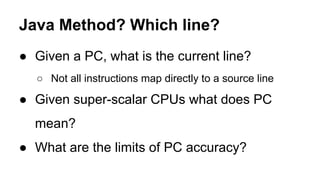
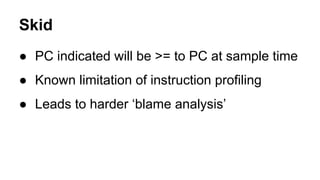
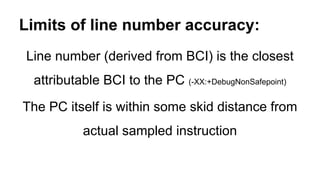
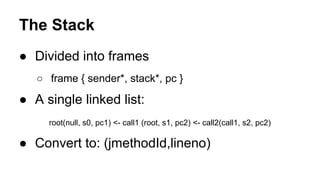
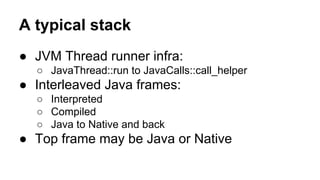
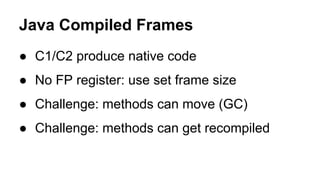
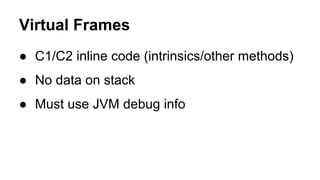
The document discusses various aspects of Java Virtual Machine (JVM) profiling, including the importance of profiling, types of profiling (execution and CPU), and the biases associated with different profiling techniques. It covers the mechanics of sampling profilers, such as stack trace sampling and safepoint polling, and highlights limitations in accuracy and effectiveness. Additionally, it introduces tools for native profiling and emphasizes the need for careful evaluation of profiling instruments.


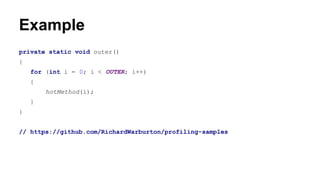
![Example (2)
private static void hotMethod(final int i)
{
for (int k = 0; k < N; k++)
{
final int[] array = SafePointBias. array;
final int index = i % SIZE;
for (int j = index; j < SIZE; j++)
{
array[index] += array[j];
}
}
}](https://image.slidesharecdn.com/jvmprofilingunderthehood-150618100908-lva1-app6892/85/Jvm-profiling-under-the-hood-17-320.jpg)
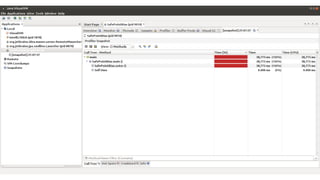


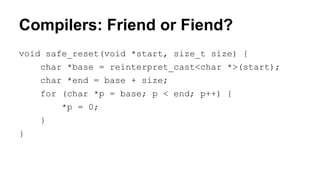
![Compilers: Friend or Fiend?
safe_reset(void*, unsigned long):
lea rdx, [rdi+rsi]
cmp rdi, rdx
jae .L3
sub rdx, rdi
xor esi, esi
jmp memset
.L3:
rep ret](https://image.slidesharecdn.com/jvmprofilingunderthehood-150618100908-lva1-app6892/85/Jvm-profiling-under-the-hood-48-320.jpg)