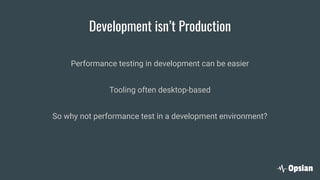
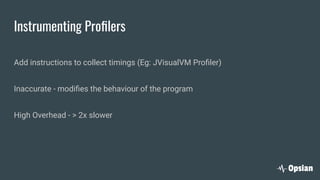
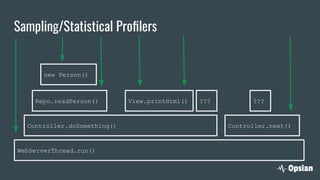
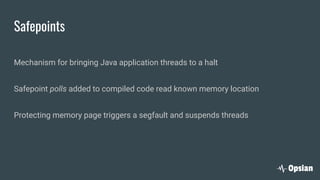
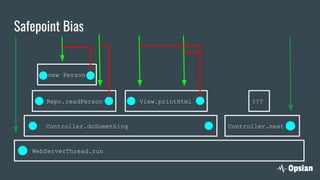
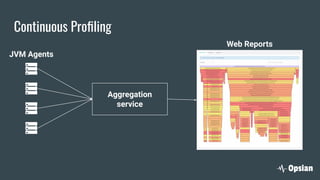
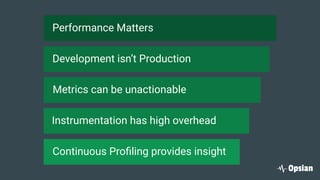
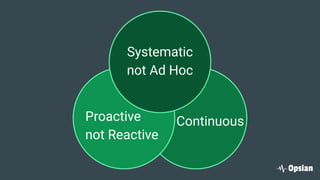
Continuous Profiling in
Production: What, Why and How
Richard Warburton (@richardwarburto)
Sadiq Jaffer (@sadiqj)
https://www.opsian.com
Why Performance Tools Matter
Development isn’t Production
Profiling vs Monitoring
Continuous Profiling
Conclusion
Known Knowns
Known Unknowns
Unknown Unknowns
Why Performance Tools Matter
Development isn’t Production
Profiling vs Monitoring
Continuous Profiling
Conclusion
Development isn’t Production
Performance testing in development can be easier
Tooling often desktop-based
So why not performance test in a development environment?
Unrepresentative Hardware
vs
Unrepresentative Software
Unrepresentative Workloads
vs
The JVM may have very different behaviour in production
Hotspot does adaptive optimisation
Production may optimise differently
Why Performance Tools Matter
Development isn’t Production
Profiling vs Monitoring
Continuous Profiling
Conclusion
Ambient/Passive/System Metrics
Preconfigured Numerical Measure
CPU Time Usage / Page-load Times
Cheap and sometimes effective
Logging
Records arbitrary events emitted by the system being monitored
log4j/slf4j/logback
Logs of GC events
Often manual, aids system understanding, expensive
Coarse Grained Instrumentation
Measures time within some instrumented section of the code
Time spent inside the controller layer of your web-app or performing SQL queries
More detailed and actionable though expensive
Production Profiling
What methods use up CPU time?
What lines of code allocate the most objects?
Where are your CPU Cache misses coming from?
Automatic, can be cheap but often isn’t
Where Instrumentation can be blind in the Real World
Problem: every 5 seconds an HTTP endpoint would be really slow.
Instrumentation: on the servlet request, didn’t even show the pause!
Cause: Tomcat expired its resources cache every 5 seconds, on load one resource
scanned the entire classpath
Surely a better way?
Not just Metrics - Actionable Insights
Diagnostics aren’t Diagnosis
What about Profiling?
Why Performance Tools Matter
Development isn’t Production
Profiling vs Monitoring
Continuous Profiling
Conclusion
How to use Continuous Profilers
1) Extract relevant time period and apps/machines
2) Choose a type of profile: CPU Time/Wallclock Time/Memory
3) View results to tell you what the dominant consumer of a resource is
4) Fix biggest bottleneck
5) Deploy / Iterate
CPU Time vs Wallclock Time
You need both CPU Time and Wallclock Time
CPU - Diagnose expensive computational hotspots and inefficient algorithms
Spot code that should not be executing but is ...
Wallclock - Diagnose blocking that stops CPU usage
e.g blocking on external IO and lock contention issues
Profiling Hotspots
Profiling Flamegraphs
Instrumenting Profilers
Add instructions to collect timings (Eg: JVisualVM Profiler)
Inaccurate - modifies the behaviour of the program
High Overhead - > 2x slower
Sampling/Statistical Profilers
WebServerThread.run()
Controller.doSomething() Controller.next()
Repo.readPerson()
new Person()
View.printHtml() ??? ???
Safepoints
Mechanism for bringing Java application threads to a halt
Safepoint polls added to compiled code read known memory location
Protecting memory page triggers a segfault and suspends threads
Safepoint Bias
WebServerThread.run
Controller.doSomething Controller.next()
Repo.readPerson
new Person
View.printHtml ???
Safepoint Bias after Inlining
Repo.readPerson
new Person
View.printHtml ??? ???
WebServerThread.run
Controller.doSomething Controller.next()
Time to Safepoint
-XX:+PrintSafepointStatistics
Threads
Safepoint poll
VMOperation
Statistical Profiling in Java
Problem: getAllStackTraces is expensive to do frequently and inaccurate, also only
gives us Wallclock time
Need ways to:
1. Interrupt application
2. Sample resource of interest
Advanced Statistical Profiling in Java
● Interrupt with OS signals
○ Delivered to handler on only one thread
○ Lightweight
● Sample resource of interest
○ Use AsyncGetCallTrace to sample stack
○ Examine JVM internals for other resources
Advanced Statistical Profiling in Java
Approach not used by existing profilers (VisualVM and desktop commercial
alternatives)
Can give very low overheads (<1%) for reasonable sampling rates
Low Overhead Ad-Hoc Production Profilers
● Async-profiler
● Honest profiler
● Perf + perf-mapper-agent
● Java Flight Recorder
● Solaris Studio
People are put off by practical as
much as technical issues
Barriers to Ad-Hoc Production Profiling
Generally requires access to
production
Process involves manual work - hard
to automate
Low-overhead open source profilers
without commercial support
What if we profiled all the time?
Historical Data
Allows for post-hoc incident analysis
Enables correlation with other data/metrics
Performance regression analysis
Putting Samples in Context
Application version
Environment parameters (machine type, CPU, location, etc.)
Ad-hoc profiling we can’t do this
Google-wide profiling
Article: Google-Wide Profiling: A Continuous Profiling Infrastructure for Data Centers
Profiling data and binaries collected, processed and made available for
browser-based reporting
“The system has been actively profiling nearly all machines at Google for several
years”
https://ai.google/research/pubs/pub36575
How to do Production Profiling
Continuous Profiling
Aggregation
service
Web Reports
JVM Agents
Summary
It’s possible to profile in production with low overhead
To overcome practical issues we can profile production all the time
We gain new capabilities by profiling all the time
Why Performance Tools Matter
Development isn’t Production
Profiling vs Monitoring
Continuous Profiling
Conclusion
With Thanks To
Brendan Greg for Flamegraphs
Andre Pangin for Async-Profiler
Jeremy Manson for the original Lightweight Profiler
Johannes Rudolph for Java Perf Mapper Agent
Nitsan Wakart
The Solaris Studio and Mission Control Teams
Performance Matters
Development isn’t Production
Metrics can be unactionable
Instrumentation has high overhead
Continuous Profiling provides insight
We need an attitude shift on profiling
+ monitoring
ContinuousProactive
not Reactive
Systematic
not Ad Hoc
Please do Production Profiling.
All the time.
Any Questions?
https://www.opsian.com/
"It's like a magnifying glass for our servers"
The End

Production profiling what, why and how technical audience (3)