2018 Resonate Pollie Awards Presentation
•Download as PPTX, PDF•
0 likes•106 views

2018 Resonate Pollie Awards Presentation

Recommended
Recommended
More Related Content
What's hot
What's hot (19)
Similar to 2018 Resonate Pollie Awards Presentation
Similar to 2018 Resonate Pollie Awards Presentation (20)
More from Resonate
More from Resonate (18)
Recently uploaded
Recently uploaded (20)
2018 Resonate Pollie Awards Presentation
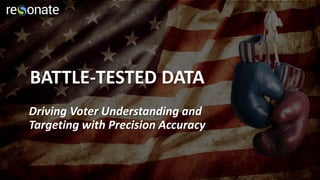
- 1. BATTLE-TESTED DATA Driving Voter Understanding and Targeting with Precision Accuracy
- 2. 2018 SWING STATES WHAT YOU KNOW AI 2 TRUTHS & A LIE vs
- 3. Which voter insight is a lie? of All Missouri Voters: 39% Want Obamacare Repealed B C 46% Are persuadable on DACA 31% Will likely vote in the midterms A
- 4. LIE A) 31% Will likely vote in the midterms 56% of Show-Me State voters will likely turn out in November
- 5. RESONATE AI IDENTIFIES TARGETABLE MEDIA BUBBLES IN MISSOURI Proportion of Conservative vs Liberal online news consumption at zip code level
- 6. Which voter insight is a lie? of All Ohio Voters: 39% Believe China is the biggest threat to the U.S. B C 41% Are anti free trade deals 28% Are swing voters A
- 7. LIE B) 39% Believe China is the biggest threat to the U.S. Only 5% of Buckeye State voters believe China is the biggest threat to the U.S. Ohio voters view terrorism and domestic crime as the biggest national threats
- 8. RESONATE AI IDENTIFIES TARGETABLE MEDIA BUBBLES IN OHIO Proportion of Conservative vs Liberal online news consumption at zip code level
- 9. Which voter insight is a lie? of All Arizona Voters: 30% Support building “The Wall” B C 58% Are party-line voters 54% Vote based on healthcare policy A
- 10. LIE C) 58% Are party-line voters Only 21% of Grand Canyon State voters value party-affiliation when choosing candidates By contrast, 59% vote based on a policy issue important to them
- 11. RESONATE AI IDENTIFIES TARGETABLE MEDIA BUBBLES IN ARIZONA Proportion of Conservative vs Liberal online news consumption at zip code level
- 12. Which voter insight is a lie? of All Pennsylvania Voters: 33% Favor taxing U.S. companies moving jobs oversees B C 55% Support increasing the corporate tax rate 49% Support clean coal production A
- 13. LIE B) 33% Favor taxing U.S. companies moving jobs oversees 69% of all registered voters in the Keystone State favor taxing companies that ship jobs to foreign countries
- 14. RESONATE AI IDENTIFIES TARGETABLE MEDIA BUBBLES IN PENNSYLVANIA Proportion of Conservative vs Liberal online news consumption at zip code level
- 15. PRO TIP Leverage AI to identify & disrupt the most harmful media bubbles Change voter behavior with 1:1 targeting of sympathetic voters in hostile media environments
- 16. BATTLE-TESTED DATA Driving Voter Understanding and Targeting with Precision Accuracy
- 17. QUIZ Who’s more likely to tune into country radio while in Music City? A) Democrats B) Republicans
- 18. QUIZ RESULTS REPUBLICANS are… 58% more likely to listen to country radio than Democrats
- 19. CHALLENGE I need to target beyond party affiliation in order to engage and persuade swing voters in close races SOLUTION 1. Append the voter file with the most up-to-date issue position survey data. 2. Identify and target swing voters based on issue positions driving ballot decisions. 3. Activate digital media and measure engagement.
- 20. INSIDE THE ONE PERCENT Where Midterm Voters Stand Today In 2016 Districts decided by Less than 1%
- 21. CA-49 Voter Insights Compared to Average California Voters CA-49 Midterm Voters Are: 15% More likely to identify as Independents 82% More likely to value financial stability 74% More likely to support Donald Trump AND AND
- 22. RESONATE AI IDENTIFIES TARGETABLE MEDIA BUBBLES IN CA-49 Proportion of Conservative vs Liberal online news consumption at zip code level
- 23. MN-08 Voter Insights Compared to Average Minnesota Voters MN-08 Midterm Voters Are: 96% More likely to attend a rally/protest 54% More likely to be concerned by crime levels 98% More likely to be concerned with climate change AND AND
- 24. RESONATE AI IDENTIFIES TARGETABLE MEDIA BUBBLES IN MN-08 Proportion of Conservative vs Liberal online news consumption at zip code level
- 25. BATTLE-TESTED DATA Driving Voter Understanding and Targeting with Precision Accuracy
- 26. PRO TIP Leverage dynamic behavioral models to understand and respond to voter shifts in real-time Static models can’t quantify individual-level shifts in the electorate throughout campaign lifecycles. Dynamic models can identify shifts in voters within days, allowing rapid campaign response that shores up the base or welcomes new voters to the fold.
- 27. QUIZ Who’s more likely to hit Broad Street for a drink this week? A) Democrats B) Republicans
- 28. QUIZ RESULTS DEMOCRATS are… 16% more likely to have a drink at a bar than Republicans
- 29. CHALLENGE I need a strategy aimed at getting additional voters to engage with our ads SOLUTION Combine detailed analytics with ad effectiveness studies to truly understand who just saw your ad compared to who engaged with it.
- 30. 2018 MIDTERM VOTERS KEY AUDIENCE INSIGHTS
- 31. Millennials 46% More likely to support free trade deals 36% More likely to vote because of social issues 70% More likely to support Obamacare Compared to Average U.S. Voters Millennial Midterm Voters are: AND AND
- 32. Seniors 47% More likely to believe North Korea is the biggest U.S. threat 49% More likely to vote based on entitlement policies 70% More likely to donate to campaigns Compared to Average U.S. Voters Senior Midterm Voters are: AND AND
- 33. Hispanics 38% More likely to be concerned with crime 36% More likely to support EPA regulations 15% More likely to be an education policy voter Compared to Average U.S. Voters Hispanic Midterm Voters are: AND AND
- 34. CHALLENGE I need to amplify my email marketing strategy SOLUTION Increase your fundraising effectiveness, open and engagement rates by analyzing and segmenting your list into detailed personas. Enhancing your intelligence on each segments’ interests, values and motivations empowers you to personalize messaging to most efficiently activate your target.