
Recommended
Recommended
More Related Content
What's hot
What's hot (17)
Similar to Route Stability Prediction Using Machine Learning Modelling of Route Table Features
Similar to Route Stability Prediction Using Machine Learning Modelling of Route Table Features (20)
Recently uploaded
Recently uploaded (20)
Route Stability Prediction Using Machine Learning Modelling of Route Table Features
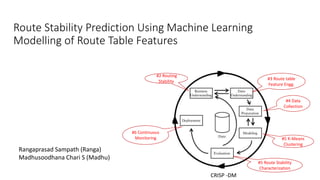
- 1. Route Stability Prediction Using Machine Learning Modelling of Route Table Features Rangaprasad Sampath (Ranga) Madhusoodhana Chari S (Madhu) #2 Routing Stability CRISP -DM #3 Route table Feature Engg. #4 Data Collection #5 Route Stability Characterization #5 K-Means Clustering #6 Continuous Monitoring
- 2. Routing Stability Objective To categorize routes in the network based on their presence and consequently infer network changes and instability from such a characterization of routes. What will this help address? Provide alerts tied to Routing performance degradation. Detect large scale network routing anomalies. Provision networks for efficiency Derive actionable insights Business Understanding
- 3. Route Table Feature Engineering A typical Route Table within a Router Defining Route Statistics Route Uptime - The cumulative time for which a Route is in the Active state from the time it gets added, within a defined time interval, t. Route Downtime - The cumulative time for which a Route is in the Inactive state from the time it gets added, within a defined time interval, t. Route Toggle Count - The number of times a Route went from Active to Inactive or vice versa. Data Understanding Route IP address/mask Nexthop IP address Nexthop Type Interface R1 16.10.10.100/24 N1 16.10.10.1 VLAN 1 R2 15.10.10.100/24 N1 15.10.10.1 VLAN 10 R3 15.10.5.100/24 N3 15.10.5.1 Interface 1/1/1 R4 0.0.0.0/0 N4 10.0.0.1 Interface 1/2/2
- 4. Experimentation and Data Collection Methodology • For every route r in the routing table, note Route Uptime in minutes, rup within a bounded time interval, t say 60 minutes. • Within the bounded time interval t, note the Route Toggle Count, rtc. • The same may be repeated over multiple time intervals t that could span over days or weeks. Factors that may influence rup and rtc • Network topology changes • Network devices downtime • Network configuration changes e.g. addition of policy rules at a given node Sample representative dataset Data Preparation Route Route Uptime (minutes), rup Route Toggle Count, rtc R1 15 20 R2 35 10 R3 45 5 R4 20 17 R5 20 16 R6 55 2
- 5. Unsupervised Machine Learning: K-Means Clustering Cluster Labeling • Reliable Routes– Red boundary • Fickle Routes– Green boundary • Intermittent Routes– Blue boundary Route Stability Characterization A data point’s location in a certain cluster is indicative of the stability of that Route. Data prior to Clustering Data post Clustering Modelling and Evaluation
- 6. Continuous Monitoring and Insights Observation Inference A group of routes transition from Intermittent to Fickle. Traffic congestion on links may be leading to delayed convergence of the routing protocol. The ratio of Reliable routes to overall routes in the system shows a downward trend. New paths through the network opening up that may lead to temporary instability. A Reliable Route address is inactive for more than the expected time. A possible H/W or S/W failure on a device that has not recovered. The ratio of Fickle routes to overall routes in the system decreases over time. The network routes are becoming stable i.e. churn in the network is decreasing. Insights guide Bandwidth Allocation, Efficient Operations, Security Profiling Deployment
- 7. Reach out to… Rangaprasad Sampath https://www.linkedin.com/in/rangaprasad-sampath ranga.sampath@gmail.com Twitter @rangas_ Madhusoodhana Chari S https://www.linkedin.com/in/madhucharis/ madhucharis@gmail.com