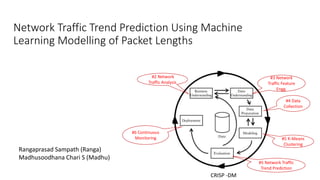
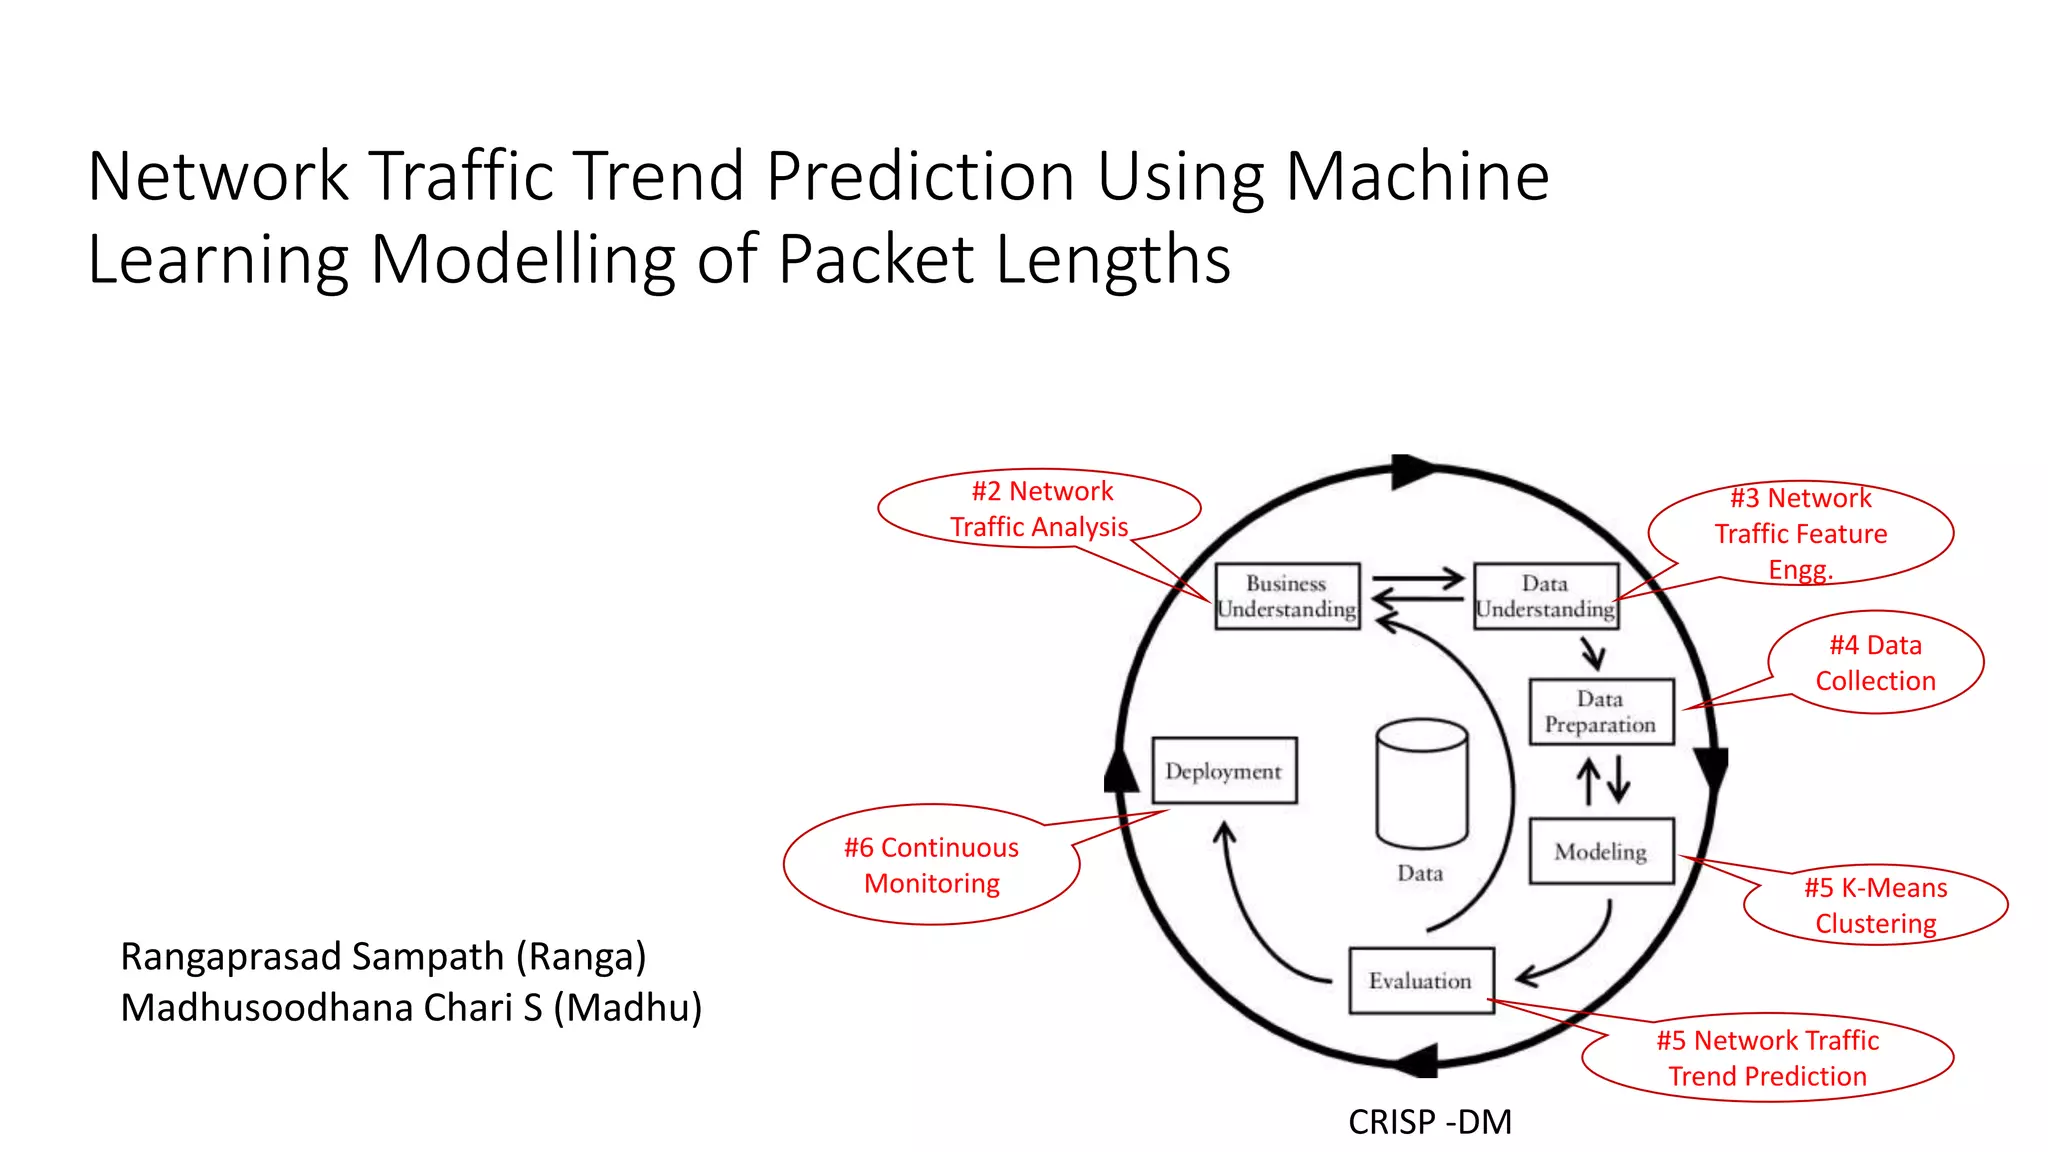
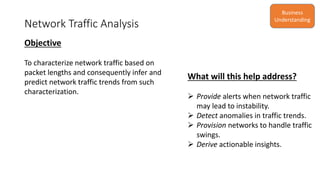
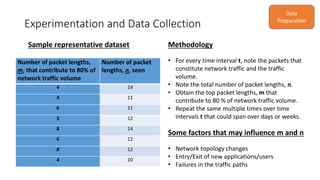
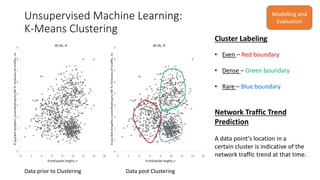
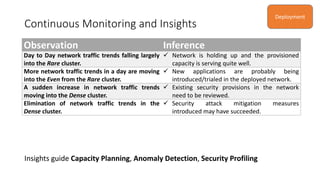
Network Traffic Trend Prediction Using Machine
Learning Modelling of Packet Lengths
Rangaprasad Sampath (Ranga)
Madhusoodhana Chari S (Madhu)
#2 Network
Traffic Analysis
CRISP -DM
#3 Network
Traffic Feature
Engg.
#4 Data
Collection
#5 Network Traffic
Trend Prediction
#5 K-Means
Clustering
#6 Continuous
Monitoring
Network Traffic Analysis
Objective
To characterize network traffic based on
packet lengths and consequently infer and
predict network traffic trends from such
characterization.
What will this help address?
 Provide alerts when network traffic
may lead to instability.
 Detect anomalies in traffic trends.
 Provision networks to handle traffic
swings.
 Derive actionable insights.
Business
Understanding
Network Traffic Feature Engineering
Observations
• In time t, packets of 14 different lengths
constitute traffic, n.
• In time t, packets of only 4 different lengths
contribute to 80 % of traffic volume, m.
Data
Understanding
Packet length (in
bytes)
Number of
packets
Volume (in
bytes)
Contribution to
overall volume
in %
40 15 600 0.02
64 580 37120 1.61
70 300 21000 0.91
360 230 82800 3.61
420 110 46200 2.01
680 25 17000 0.74
700 90 63000 2.74
790 80 63200 2.75
840 55 46200 2.01
870 40 34800 1.51
1020 280 285600 12.45
1140 340 387600 16.89
1260 340 428400 18.67
1500 520 780000 34.00
Key Takeaway
A traffic histogram for time t is mapped to a data point (m, n) .
Experimentation and Data Collection
Methodology
• For every time interval t, note the packets that
constitute network traffic and the traffic
volume.
• Note the total number of packet lengths, n.
• Obtain the top packet lengths, m that
contribute to 80 % of network traffic volume.
• Repeat the same multiple times over time
intervals t that could span over days or weeks.
Some factors that may influence m and n
• Network topology changes
• Entry/Exit of new applications/users
• Failures in the traffic paths
Sample representative dataset
Data
Preparation
Number of packet lengths,
m, that contribute to 80% of
network traffic volume
Number of packet
lengths, n, seen
4 14
4 11
6 11
3 12
8 14
6 12
8 12
4 10
Unsupervised Machine Learning:
K-Means Clustering
Cluster Labeling
• Even – Red boundary
• Dense – Green boundary
• Rare – Blue boundary
Network Traffic Trend
Prediction
A data point’s location in a
certain cluster is indicative of the
network traffic trend at that time.
Data prior to Clustering Data post Clustering
Modelling and
Evaluation
Continuous Monitoring and Insights
Observation Inference
Day to Day network traffic trends falling largely
into the Rare cluster.
 Network is holding up and the provisioned
capacity is serving quite well.
More network traffic trends in a day are moving
into the Even from the Rare cluster.
 New applications are probably being
introduced/trialed in the deployed network.
A sudden increase in network traffic trends
moving into the Dense cluster.
 Existing security provisions in the network
need to be reviewed.
Elimination of network traffic trends in the
Dense cluster.
 Security attack mitigation measures
introduced may have succeeded.
Insights guide Capacity Planning, Anomaly Detection, Security Profiling
Deployment
Reach out to…
Rangaprasad Sampath
https://www.linkedin.com/in/rangaprasad-sampath
ranga.sampath@gmail.com
Twitter @rangas_
Madhusoodhana Chari S
https://www.linkedin.com/in/madhucharis/
madhucharis@gmail.com

Network Traffic Trends Prediction Using Machine Learning Modelling of Packet Lengths

  • 1.
    Network Traffic TrendPrediction Using Machine Learning Modelling of Packet Lengths Rangaprasad Sampath (Ranga) Madhusoodhana Chari S (Madhu) #2 Network Traffic Analysis CRISP -DM #3 Network Traffic Feature Engg. #4 Data Collection #5 Network Traffic Trend Prediction #5 K-Means Clustering #6 Continuous Monitoring
  • 2.
    Network Traffic Analysis Objective Tocharacterize network traffic based on packet lengths and consequently infer and predict network traffic trends from such characterization. What will this help address?  Provide alerts when network traffic may lead to instability.  Detect anomalies in traffic trends.  Provision networks to handle traffic swings.  Derive actionable insights. Business Understanding
  • 3.
    Network Traffic FeatureEngineering Observations • In time t, packets of 14 different lengths constitute traffic, n. • In time t, packets of only 4 different lengths contribute to 80 % of traffic volume, m. Data Understanding Packet length (in bytes) Number of packets Volume (in bytes) Contribution to overall volume in % 40 15 600 0.02 64 580 37120 1.61 70 300 21000 0.91 360 230 82800 3.61 420 110 46200 2.01 680 25 17000 0.74 700 90 63000 2.74 790 80 63200 2.75 840 55 46200 2.01 870 40 34800 1.51 1020 280 285600 12.45 1140 340 387600 16.89 1260 340 428400 18.67 1500 520 780000 34.00 Key Takeaway A traffic histogram for time t is mapped to a data point (m, n) .
  • 4.
    Experimentation and DataCollection Methodology • For every time interval t, note the packets that constitute network traffic and the traffic volume. • Note the total number of packet lengths, n. • Obtain the top packet lengths, m that contribute to 80 % of network traffic volume. • Repeat the same multiple times over time intervals t that could span over days or weeks. Some factors that may influence m and n • Network topology changes • Entry/Exit of new applications/users • Failures in the traffic paths Sample representative dataset Data Preparation Number of packet lengths, m, that contribute to 80% of network traffic volume Number of packet lengths, n, seen 4 14 4 11 6 11 3 12 8 14 6 12 8 12 4 10
  • 5.
    Unsupervised Machine Learning: K-MeansClustering Cluster Labeling • Even – Red boundary • Dense – Green boundary • Rare – Blue boundary Network Traffic Trend Prediction A data point’s location in a certain cluster is indicative of the network traffic trend at that time. Data prior to Clustering Data post Clustering Modelling and Evaluation
  • 6.
    Continuous Monitoring andInsights Observation Inference Day to Day network traffic trends falling largely into the Rare cluster.  Network is holding up and the provisioned capacity is serving quite well. More network traffic trends in a day are moving into the Even from the Rare cluster.  New applications are probably being introduced/trialed in the deployed network. A sudden increase in network traffic trends moving into the Dense cluster.  Existing security provisions in the network need to be reviewed. Elimination of network traffic trends in the Dense cluster.  Security attack mitigation measures introduced may have succeeded. Insights guide Capacity Planning, Anomaly Detection, Security Profiling Deployment
  • 7.
    Reach out to… RangaprasadSampath https://www.linkedin.com/in/rangaprasad-sampath ranga.sampath@gmail.com Twitter @rangas_ Madhusoodhana Chari S https://www.linkedin.com/in/madhucharis/ madhucharis@gmail.com