3. R. Ghosh, N. Deb and K. Sengupta et al. / Data in Brief 40 (2022) 107772 3
Value of the Data
• This dataset of EEG signals is recorded to monitor the stress-induced among individuals
while performing various tasks such as: performing the Stroop color-word test, solving math-
ematical problems, identification of symmetric mirror images, and a state of relaxation. The
goal of the dataset was aimed at capturing the induced stress due to each of the individual
tasks.
• This dataset will help the research communities in the identification of patterns in EEG
elicited due to stress and can also be used to identify perceived stress in an individual.
• Behavioral ratings of stress levels were also collected from the participants for each of the
tasks- Stroop color-word test, arithmetic problem solving, and mirror image recognition task.
The ratings of the individual subjects are also provided with this dataset. These measures
may prove useful for additional analysis that has not yet been explored.
• The dataset can also be utilized in clinical diagnosis for the identification of stress among
subjects.
• Additional research on the source localization of the EEG signals responsible for stress can
be carried out from the data. Classification of EEG signals based on cognitive tasks of an
individual can be used for additional inference. Moreover, the type of task that elicits the
maximum amount of stress can be analyzed from the dataset.
1. Data Description
This dataset is structured in two main folders (/raw_data and /filtered_data). The /raw_data
folder contains the EEG time-series segmented in epochs corresponding to the experimental tri-
als and has been named accordingly to identify the experimental events and the trial. The EEG
data present in the /raw_data folder contains noise and is also corrupted with artifacts. The /fil-
tered_data folder contains the clean EEG data and is free from different artifacts. Both raw and
clean data have been provided to facilitate the research activity as different filtering methods
may be applied by different researchers to remove artifacts from the EEG data. Moreover, a .xls
file named scales.xls is also given along with the EEG data. The file provides the feedback by the
subjects on a scale of 1–10 depending on the stress levels experienced by the subject during a
particular task in a trial. Besides, a .locs file named as Coordinates.locs has also been provided to
facilitate the plotting of the EEG data. Moreover, another folder named /artifact_removal is also
provided which contains the code for artifact removal. The correct_EEG.m file provides the code
for the artifact removal procedure implemented in Matlab. The /artifact_removal folder contains
two .mat files namely Corrupted_EEG.mat and Cleaned_EEG.mat which represent a sample EEG
recording before and after the removal of artifacts respectively. The two files have been provided
in the folder for the purpose of demonstration of the Matlab code and have been extracted from
subject 10 while performing the arithmetic task. It is to be noted that both raw EEG data and
filtered EEG data have been uploaded to the portal. The /filtered data folder contains the fil-
tered EEG data of all the segmented trials which have been obtained using the correct_EEG.m
file provided in the /artifact_removal folder and the /raw_data folder contains the unfiltered raw
EEG data. The artifact removal procedure has been described in the data pre-processing section.
The EEG data provided in the folders are segmented according to the respective tasks- Stroop
color-word test, arithmetic task, mirror image recognition task, and a state of relaxation. The
corresponding files are provided in EEGLAB format and can be loaded into EEGLAB using ‘Load
existing dataset’ from the ‘File’ menu. In order to visualize individual channels, ‘Channel data
(scroll)’ from the ‘Plot’ menu has to be selected to generate the plot (Figs. 6 and 7 are generated
using the described procedure). The description of the corresponding experimental tasks and the
methodology to generate the data are described in the next section.
The past decade has witnessed an ever-increasing growth in the field of brain-computer in-
terface (BCI). BCI’s have been developed for various applications like motor imagery, prosthesis,
emotion recognition, etc. Emotion plays a significant role in cognition, motivation, perception,
4. 4 R. Ghosh, N. Deb and K. Sengupta et al. / Data in Brief 40 (2022) 107772
creativity, attention, learning, and decision-making [4]. The visualization of mental states has a
lot of potentials and can greatly aid psychologists in diagnosing mental disorders.
The primary goal of this dataset is to capture the level of stress elicited in individuals while
performing different types of tasks such as performing the Stroop color-word test, solving arith-
metic problems, and recognizing symmetric mirror images. The dataset can be used to identify
the levels of stress induced in an individual, while performing different tasks.
2. Description of the Different Mental Tasks
The dataset is created to primarily monitor the stress induced in an individual while per-
forming different cognitive tasks. The different cognitive tasks considered for the experiment
are: the Stroop color word test, arithmetic problem solving, and recognition of symmetric im-
ages. The different tasks are described below.
2.1. Stroop color word test
The Stroop Color- Word Test (SCWT) is a neuropsychological test used to assess the cognitive
inference ability while processing multiple stimuli [1]. SCWT has been used in the literature
[2] to induce stress in subjects and therefore has been adopted in the present work. The subjects
are asked to identify the names of colors printed in different color patches. Accordingly, there
are two conditions- congruent condition and incongruent condition. In congruent condition, the
name of the color matches with the color of the ink with which the word is printed and in
incongruent condition, the name of the color does not match with the ink with which the word
is printed. Both the conditions are represented in Fig. 1(a) and Fig. 1(b), respectively. 11 such
impulses comprising of both congruent and incongruent conditions are presented to the subject
in a trial during the course of the experiment.
2.2. Mirror image recognition task
Images have also been used in the literature to induce various types of emotions [3,4] and
thus have been adopted in the present work to induce stress in the subjects. In the proposed
work, mirror images are presented to the subject and is asked to identify whether the displayed
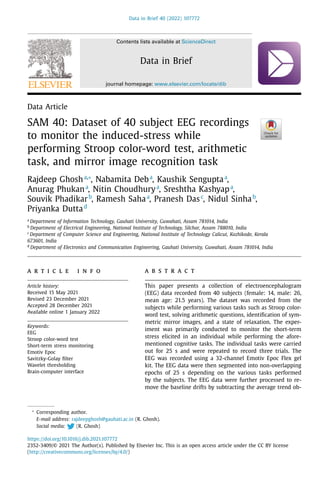
images are symmetric or asymmetric to each other. Fig. 2(a) and (b) shows one such symmetric
and asymmetric mirror images used in the present work respectively. The mirror images have
been designed so as to induce stress in students during the course of experimentation. 8 such
images have been used in the proposed work for eliciting stress in individuals during a trial.
2.3. Arithmetic problem solving task
Arithmetic problem solving task is known to elicit stress in individuals [5]. In the proposed
work, the subject is asked to mentally solve the problem and respond with a thumbs up or
thumbs down gesture depending on whether the answer displayed on the screen is a correct
solution for the arithmetic problem or not. Fig. 3 depicts one such arithmetic stimuli used in the
proposed work. 6 such arithmetic stimuli involving different arithmetic operators are presented
in a trial to the subject during the course of the experiment.
5. R. Ghosh, N. Deb and K. Sengupta et al. / Data in Brief 40 (2022) 107772 5
Fig. 1. (a) Congruent condition in SCWT. (b) Incongruent condition in SCWT.
3. Experimental Design, Materials and Methods
The data were collected primarily from the students studying in the institute. 14 female and
26 male students participated in the experiment. The age of the subjects ranged from 18 to
25 years with a mean age of 21.5 years. The subjects were asked to solve the tasks within a
specified time. Written consent was obtained from the individual subject before participating in
the experiment. EEG data were recorded from 32-channels using Emotiv Epoc Flex gel kit at a
sampling frequency of 128 Hz. The channels considered for recording the brain activity were- CZ,
FZ, Fp1, F7, F3, FC1, C3, FC5, FT9, T7, CP5, CP1, P3, P7, PO9, O1, PZ, OZ, O2, PO10, P8, P4, CP2, CP6,
T8, FT10, FC6, C4, FC2, F4, F8, and, Fp2. Fig. 4 shows the placement of the different electrodes on
the head of an individual. CMS and DRL are two reference electrodes connected to the left and
the right mastoid region of the head respectively. Three trials were recorded for an individual
subject. The trail recording paradigm is described in the next section.
6. 6 R. Ghosh, N. Deb and K. Sengupta et al. / Data in Brief 40 (2022) 107772
Fig. 2. (a) Symmetric mirror image. (b) Asymmetric mirror image.
3.1. Data recording methodology
The experiment is set up by the experimenters in the beginning. Then the EEG device is
mounted over the subject and instructions are given to the subject regarding the experiment.
Then the experimenter starts to record the EEG data and the subject is asked to perform the
various tasks. The subject is initially asked to relax for 25 s where relaxing music is played to
ease the subject. After which, the instructions for the Stroop color-word test is shown to the
subjects. The subject is asked to perform the Stroop color-word test for 25 s. The subject then
relaxes for 5 s and then the instructions for the next task are displayed for 10 s. In the next
7. R. Ghosh, N. Deb and K. Sengupta et al. / Data in Brief 40 (2022) 107772 7
Fig. 3. An Arithmetic task stimuli.
Fig. 4. Placement of the 32 electrodes.
8. 8 R. Ghosh, N. Deb and K. Sengupta et al. / Data in Brief 40 (2022) 107772
Table 1
Tabular representation of verbal feedback from the observer after each trial on a scale of 1–10.
Trial_1 Trial_2 Trial_3
Subject
No.
Stroop
Color-word
Test
Arithmetic
Task
Mirror Image
Recognition
Task
Stroop
Color-word
Test
Arithmetic
Task
Mirror Image
Recognition
Task
Stroop
Color-word
Test
Arithmetic
Task
Mirror Image
Recognition
Task
1 3 6 3 2 7 5 4 4 7
2 5 3 4 4 3 4 3 7 5
3 4 5 3 5 3 5 5 8 7
4 4 5 3 2 3 5 5 7 5
5 6 6 6 2 5 3 3 5 7
6 2 5 4 3 4 3 5 8 6
7 4 5 5 3 3 3 6 6 3
8 4 3 5 3 6 6 3 5 6
9 4 3 6 4 4 4 6 7 4
10 4 3 4 3 4 5 5 6 4
11 4 7 3 5 6 5 5 5 6
12 2 5 7 5 5 4 3 8 6
13 3 3 5 2 3 4 1 3 5
14 3 3 4 2 6 4 4 6 3
15 5 9 6 3 7 5 5 6 5
16 1 4 4 1 5 6 6 8 5
17 8 8 9 4 6 8 6 7 7
18 6 6 5 5 5 6 7 9 6
19 6 4 6 3 2 4 3 4 1
20 7 10 9 5 10 9 6 10 8
21 9 7 8 9 8 8 9 7 8
22 5 9 8 6 8 8 5 7 6
23 1 3 2 1 4 2 5 8 4
24 1 4 2 1 2 1 4 5 7
25 2 2 1 2 2 1 5 5 7
26 8 6 7 7 6 8 6 4 5
27 3 5 5 2 3 4 3 5 3
28 7 7 8 5 7 7 4 6 5
29 6 6 7 6 8 7 5 6 6
30 5 7 6 5 8 6 4 7 5
31 4 10 8 3 9 7 7 6 3
32 1 5 5 1 1 2 3 7 6
33 3 5 4 2 3 2 6 8 3
34 1 2 3 1 3 1 3 2 2
35 1 6 5 1 5 2 5 4 6
36 6 4 4 3 5 4 5 5 5
37 4 6 5 2 5 3 6 8 4
38 5 6 4 3 5 6 3 4 5
39 3 6 4 3 5 5 5 6 3
40 5 3 5 5 4 6 3 4 4
phase, the subject is shown different mirror images and is asked to identify whether the images
are symmetric or asymmetric and respond with a thumbs up or thumbs down gesture depend-
ing on whether the images displayed represent symmetric mirror images or not. The mirror
image symmetry task is carried out for 25 s, after which the subject again relaxes for 5 s and
then the instructions for the next task are displayed for 10 s. Finally, the subject is instructed to
solve arithmetic problems where the subject is asked to mentally solve the problem and respond
with a thumbs up or thumbs down gesture depending on whether the answer displayed on the
screen is a correct solution for the corresponding arithmetic problem or not. The arithmetic task
is also carried out for 25 s. The completion of the arithmetic task marks the completion of a
trial. Moreover, when the subject is responding, an operator also gives feedback as to whether
the answers provided by the subject are incorrect or correct.
After finishing an individual trial, the subject is asked to rate the tasks on a scale of 1–10 de-
pending on the level of stress experienced during the particular tasks. A rating of 10 on the scale
represents a high level of stress being induced on the subjects and a rating of 1 representing the
minimal amount of stress being experienced by the subjects.
After collecting the responses from the subject, the next trial is recorded. The next trial is
repeated in the same order, but with a different set of questions as the subject might become
familiarized with the questions. 3 trials were recorded from an individual subject. Fig. 5 repre-
sents the trail recording paradigm followed in the experiment and Table 1 lists the individual
ratings for different tasks in a trial given by a specific subject.
9. R. Ghosh, N. Deb and K. Sengupta et al. / Data in Brief 40 (2022) 107772 9
Fig.
5.
Trial
recording
paradigm.
10. 10 R. Ghosh, N. Deb and K. Sengupta et al. / Data in Brief 40 (2022) 107772
Fig. 6. EEG Data of Subject 10 before artifact removal.
3.2. Data pre-processing
The raw data was imported and clipped in Matlab R2019a. Band-pass filtering in the range of
0.5–45 Hz was applied to the data initially. The collected data were contaminated with different
types of artifacts. Fig. 6 represents one such plot of EEG data before artifact removal for subject
10 while performing the arithmetic task in the third trial. The figure has been generated using
the EEGLAB toolbox as described in the data description section. It is evident from Fig. 6 that
the EEG data is corrupted with different types of artifacts.
Components containing artifacts (i.e., eye movements, eye blinks, muscular activity, etc.) were
identified and removed using a combination of Savitzky-Golay filter and wavelet thresholding
[6,7]. Artifacts are signals caused by muscle movements and eye movements which corrupt the
original EEG signal. Savitzky-Golay smoothing filters are used to "smooth out" a noisy signal. The
Savitzky-Golay filter is created with a frame length of 127 and an order of 5. The Savitzky-Golay
smoothing filters are used to create a reference signal, which is subtracted from the EEG data
to remove the average trend in the EEG data. After removing the average trend from the EEG
signal, wavelet thresholding is applied to remove the components which have amplitude values
over a certain threshold in different scales. The signal is decomposed up to 4 levels with ‘db2’
(Daubechies 2) as the mother wavelet. A threshold of 0.8 times the standard deviation of the
detailed coefficient at the third level of decomposition is selected for thresholding. The thresh-
olding removes the remaining components which were not removed after subtraction of the av-
erage trend from the EEG. The artifact removal procedure has been given in the correct_EEG.m
file within the /artifact_removal folder.
Both Raw EEG data and filtered EEG data have been uploaded to facilitate research as differ-
ent artifact removal methods can be applied by different researchers on the EEG data which can
make the analysis more efficient.
Fig. 7 represents the corrected version of the EEG represented in Fig. 6. It can be observed
from Fig. 7 that the artifact removal procedure adopted in the proposed work efficiently removes
the artifacts from the EEG data and preserves good correlation in the EEG data.
11. R. Ghosh, N. Deb and K. Sengupta et al. / Data in Brief 40 (2022) 107772 11
Fig. 7. EEG Data of Subject 10 after artifact removal.
Fig. 8. EEG topography plot from clean data.
3.3. Naming convention
EEG data files contain four types of event codes: (i) Mat files that correspond to the relax-
ation phase are marked as ‘relax’. Please note that the files also mark the subject and the trials.
(ii) Mat files that correspond to the Stroop color-word test are marked as ‘Stroop’ (iii) Mat files
that correspond to the mirror image recognition task are marked as ‘Mirror_image’ and (iv) Mat
files that correspond to the arithmetic problems are marked as ‘Arithmetic’. Fig. 8 represents
the topographic plot of the CZ electrode of subject 17 w.r.t the different tasks performed by the
subject. The plots have been generated by using the ‘topoplot’ function available in the EEGLAB
toolbox.
3.4. Observer’s feedback
After each trial, the subject’s feedback in terms of the level of stress experienced during dif-
ferent tasks is taken on a scale of 1 to 10. The ratings have been taken to correlate the EEG
data to the amount of stress experienced by the subjects. A rating of 10 on the scale represents
12. 12 R. Ghosh, N. Deb and K. Sengupta et al. / Data in Brief 40 (2022) 107772
a high level of stress getting induced on the subjects and a rating of 1 represents the minimal
amount of stress getting induced on the subjects.
Ethics Statement
Ethical approval was obtained from the Institutional Ethics Committee, Gauhati University,
reference no. GUIEC/2019/019 dated: 15/10/2019. The experiment involved human subjects in
research whose participation was completely consensual, anonymous, and voluntary. Before opt-
ing to partake in the study, the participants were informed about the nature of the study. The
data collection was conducted according to the Declaration of Helsinki.
Consent from Participants
Informed consent was obtained from all the subjects participating in the study.
Declaration of Competing Interest
The authors declare that there is no known competing financial interests or personal rela-
tionships which have, or could have influenced the work reported in this article.
CRediT Author Statement
Rajdeep Ghosh: Conceptualization, Methodology, Data curation, Project administration;
Nabamita Deb: Conceptualization, Supervision, Writing – original draft; Kaushik Sengupta: In-
vestigation, Software, Validation; Anurag Phukan: Investigation, Writing – review & editing;
Nitin Choudhury: Software, Data curation; Sreshtha Kashyap: Visualization; Souvik Phadikar:
Formal analysis; Ramesh Saha: Writing – review & editing; Pranesh Das: Conceptualization;
Nidul Sinha: Conceptualization, Methodology; Priyanka Dutta: Visualization.
Acknowledgments
The research work is funded by NPIU-MHRD, Govt. of India under the CRS Project entitled
“Monitoring Stress in Students using EEG” with CRS-Id-:- 1-5770264050.
References
[1] F. Scarpina, S. Tagini, The Stroop color and word test, Front. Psychol. 8 (2017) 557 1-8.
[2] X. Hou, Y. Liu, O. Sourina, W. Mueller-Wittig, CogniMeter: EEG-based emotion, mental workload and stress visual
monitoring, in: Proceedings of the International Conference on Cyberworlds, Visby, Sweden, 2015, pp. 153–160.
[3] K.S. Rahnuma, A. Wahab, N. Kamaruddin, H. Majid, EEG analysis for understanding stress based on affective model
basis function, in: Proceedings of the IEEE 15th International Symposium on Consumer Electronics (ISCE), Singapore,
2011, pp. 592–597.
[4] S.A. Hosseini, M.A. Khalilzadeh, M.B. Naghibi-Sistani, S.M. Homam, Emotional stress recognition using a new fusion
link between electroencephalogram and peripheral signals, Iran J. Neurol. 14 (3) (2015) 142–151.
[5] C. Kirschbaum, K.M. Pirke, D.H. Hellhammer, The Trier Social Stress Test—–a tool for investigating psychobiological
stress responses in a laboratory setting, Neuropsychobiology 28 (1, 2) (1993) 76—81.
[6] P. Gajbhiye, N. Mingchinda, W. Chen, S.C. Mukhopadhyay, T. Wilaiprasitporn, R.K. Tripathy, Wavelet domain optimized
Savitzky–Golay filter for the removal of motion artifacts From EEG recordings, IEEE Trans. Instrum. Meas. 70 (2021)
1–11.
[7] S. Phadikar, N. Sinha, R. Ghosh, Automatic eyeblink artifact removal from EEG signal using wavelet transform with
heuristically optimized threshold, IEEE J. Biomed. Health Inform. 25 (2) (2021) 475–484.