More Related Content
Similar to Raddon Chart of the Day May 1, 2012 (15)
More from Raddon Financial Group (20)
Raddon Chart of the Day May 1, 2012
- 1. Raddon Chart of the Day
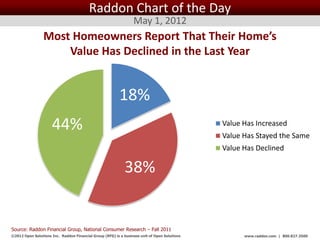
May 1, 2012
Most Homeowners Report That Their Home’s
Value Has Declined in the Last Year
18%
44% Value Has Increased
Value Has Stayed the Same
Value Has Declined
38%
Source: Raddon Financial Group, National Consumer Research – Fall 2011
©2012 Open Solutions Inc. Raddon Financial Group (RFG) is a business unit of Open Solutions Inc. www.raddon.com | 800.827.3500
- 2. Raddon Chart of the Day
April 26, 2012
Consumers That Anticipate a Home/Condo
Purchase In the Next Five Years
3% 4%
7%
Within the Next Year
Within the Next One to Two
Years
Within the Next Three to
Five Years
Do Not Anticipate Buying a
House
86%
Source: Raddon Financial Group, National Consumer Research – Fall 2011
©2012 Open Solutions Inc. Raddon Financial Group (RFG) is a business unit of Open Solutions Inc. www.raddon.com | 800.827.3500
- 3. Raddon Chart of the Day
April 24, 2012
Consumers Current Home Ownership Status
5% 2%
22% Own a Home
Rent
Live with Parents/Relatives
Other
71%
Source: Raddon Financial Group, National Consumer Research – Fall 2011
©2012 Open Solutions Inc. Raddon Financial Group (RFG) is a business unit of Open Solutions Inc. www.raddon.com | 800.827.3500
- 4. Raddon Chart of the Day
April 19, 2012
Consumers That Have Applied and Been Turned
Down For a Loan in the Last 12 Months
Applied/Turned Down for Any Loan 11%
Credit Card 6%
Line of Credit 2%
Consumer Loan 1%
Mortgage for Refinance 1%
Mortgage for Home Purchase 1%
Home Equity Loan or Line 0%
None of the Above 89%
0% 20% 40% 60% 80% 100%
Source: Raddon Financial Group, National Consumer Research – Fall 2011
©2012 Open Solutions Inc. Raddon Financial Group (RFG) is a business unit of Open Solutions Inc. www.raddon.com | 800.827.3500
- 5. Raddon Chart of the Day
April 17, 2012
When Consumers Last Purchased
or Leased a Vehicle
35%
31%
30%
25%
20% 17%
15%
15% 12% 13%
11%
10%
5%
0%
Within the Between 1 Between 2 Between 3 Over Five Have Never
Past Year and 2 Years and 3 Years and 5 Years Years Ago Purchased or
Ago Ago Ago Leased a
Vehicle
Source: Raddon Financial Group, National Consumer Research – Fall 2011
©2012 Open Solutions Inc. Raddon Financial Group (RFG) is a business unit of Open Solutions Inc. www.raddon.com | 800.827.3500
- 6. Raddon Chart of the Day
April 13, 2012
Consumers That Are Currently in the
Market For a New Credit Card
6%
In the Market for a New
Credit Card
Not in the Market for a New
Credit Card
94%
Source: Raddon Financial Group, National Consumer Research – Fall 2011
©2012 Open Solutions Inc. Raddon Financial Group (RFG) is a business unit of Open Solutions Inc. www.raddon.com | 800.827.3500
- 7. Raddon Chart of the Day
April 10, 2012
Top Five Credit Card Features That Would Prompt
Consumers to Get a New Credit Card
No Annual Fee 81%
Low Interest Rate 60%
Annual Cash Back Rebate 43%
Identity Theft Protection 37%
0% Introductory Rate Offer 32%
0% 10% 20% 30% 40% 50% 60% 70% 80% 90%
Source: Raddon Financial Group, National Consumer Research – Fall 2011
©2012 Open Solutions Inc. Raddon Financial Group (RFG) is a business unit of Open Solutions Inc. www.raddon.com | 800.827.3500
- 8. Raddon Chart of the Day
April 5, 2012
Methods Consumers Use to Obtain Financing
for a Vehicle Purchase From an Auto Dealer
Total
Typically Would Obtain Financing from the Auto
Dealer
40%
Would Seek Out Loan Rates from Primary
Financial Institution
19%
Would Use Comparative Price Grids/Services on
the Internet to Get the Best Loan Deal
5%
Would Use a Home Equity Credit to Finance
Vehicle Purchases
2%
Other 7%
Do Not Borrow for Vehicle Purposes 27%
0% 5% 10% 15% 20% 25% 30% 35% 40% 45%
Source: Raddon Financial Group, National Consumer Research – Fall 2011
©2012 Open Solutions Inc. Raddon Financial Group (RFG) is a business unit of Open Solutions Inc. www.raddon.com | 800.827.3500
- 9. Raddon Chart of the Day
April 3, 2012
Consumers That Are Willing to Pay a $2 Monthly
35%
Fee For Basic Identity Theft Protection Coverage
33%
30%
27%
25%
20%
17%
15% 14%
10% 8%
5%
0%
Extremely Likely Very Likely Somewhat Likely Not Very Likely Not at All Likely
Source: Raddon Financial Group, National Consumer Research – Fall 2011
©2012 Open Solutions Inc. Raddon Financial Group (RFG) is a business unit of Open Solutions Inc. www.raddon.com | 800.827.3500