Download as PDF, PPTX

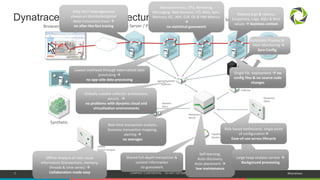
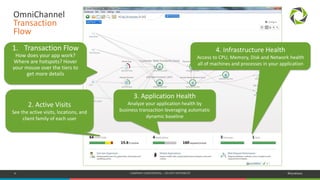
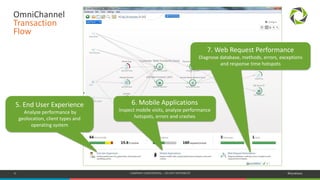
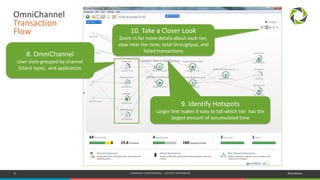
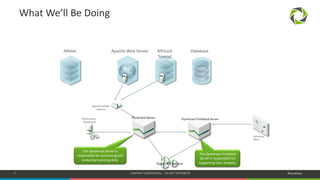
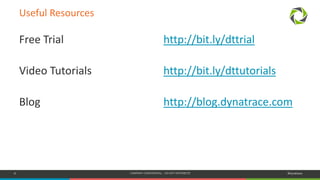
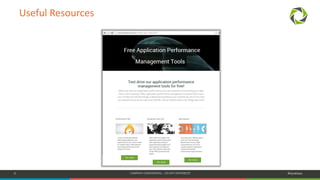

The document outlines an agenda for a Dynatrace free trial test drive. It includes an overview of Dynatrace application monitoring, what activities will be done during the test drive, and useful resources. The architecture of the Dynatrace solution is shown, with the Dynatrace server processing data and the frontend server supporting user analysis. Screenshots of the Dynatrace user interface are provided to demonstrate transaction flows, hotspots identification, and performance analysis.