
Recommended
More Related Content
What's hot
What's hot (20)
Similar to Flame Photometry
Similar to Flame Photometry (20)
Recently uploaded
Recently uploaded (20)
Flame Photometry
- 1. Presentation on Flame Photometry Prajjwal Ray PG Second Semester Department of Environmental Biology and Wildlife Sciences Cotton University, Guwahati 781001, Assam.
- 2. Flame Photometry What is it? • Flame photometry is the analysis method to determine the type and/or concentration of certain metal ions from the spectra they produce when exposed to a flame. • Metallic salts in solution are sprayed as aerosol in a high temperature flame source to be vaporized. • These metallic salts include sodium, potassium, calcium, lithium etc. • The atoms in the vapor, excited by the flame, release radiation which has the wavelength specific for different types of metals. • To estimate concentration of certain ions, the intensity of wavelength is measured.
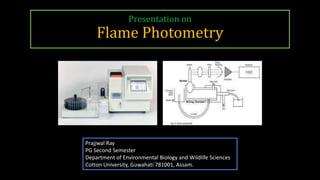
- 3. The picture below describes how does a flame photometry analysis work……
- 4. • The machine used to carry out flame photometry analysis is known as Photoelectric Flame Photometer. • Some renowned manufacturers are Kruss, Genway, Spectrolab etc.
- 5. History & Development • German metallurgist Georgius Agricola in his 1556s paper, commented on how to identify different metallic contents of an ore from the ‘colour of fumes’. • This was a qualitative analysis method to identify ore contents.
- 6. History & Development • Sir John Frederick William Herschel (1823) published emission spectra of an alcohol lamp after studying. • This was the first example of a lamp being studied for emission.
- 7. History & Development • Jean Bernard Leon Foucault (1849) linked sodium emission of a lamp with that of sun. • Kirchhoff & Bunsen (1859) developed first spectroscope hence beginning the trends in analytical spectroscopy and discovered rubidium and caesium in 1960.s • These events were followed by discovery of elements like indium, gallium, thallium etc. Janssen
- 8. History & Development • Pierre Jules Cesar Janssen (1870) stated quantitative estimation of sodium. • He used lamp as flame source and introduced ore to the flame on a platinum wire.les César Janssen • Champion, Pellet and Grenier (1873) measured sodium emission with the help of spectroscope with aid of visual photometry. They used two flames each for unknown and standard samples.kn • This was the invention of flame photometer as we see it today.o
- 9. History & Development • Louis Georges Gouy (1877) designed a pneumatic atomizer to inject a controlled amount of sample into the flame. • The result was increased precision and accuracy of analysis.an • H. Lundegårdh and T. Philipson (1938) used an air- acetylene burner for developing an entire system of flame excitation. • it produced a higher flame temperature while holding the flame excitation stability.
- 10. History & Development • Barnes et al. (1945) made first flame photometer consisting modern flame cell (Meeker air- natural gas burner), in United States of America.
- 11. History & Development • Beckman Corporation (1948) introduced DU spectrophotometer attached with flame aspirator. a • A. Walsh (1955) laid down the foundation of atomic absorption analysis.
- 13. Principle of Flame Photometry • At the temperature of flame the metal salts get thermally dissociated into atoms. • During this process the atoms get excited and move from ground state (GS) to excited state (ES). • When these excited atoms returns to the ground state, radiation of specific wavelength is emitted from these excited atoms.
- 14. Principle of Flame Photometry • This wavelength is specific to individual element. • This specific wavelength is isolated by an optical fibre and then photodetector converts it into electrical signal. • The intensity of the emitted wavelength is proportional to the concentration of element present and the number of atoms moving back to ground state from excited state is proportional to number of atoms excited i. e. the concentration of sample.
- 15. Calculations • The emitted radiation is calculated by the following equation: E2 - E1 = hν Where, E2 is excited state energy E1 is ground state energy h is Planck’s constant ν is the emitted radiation ν is the ratio of C (speed of wave) and λ (wavelength). Hence, ν = C/λ, Hence, E2 - E1 = hC/λ, Hence, λ = hC/E2 - E1 • This way, we can calculate the wavelength (λ).
- 16. Boltzmann Distribution • The fraction of free atom that are thermally exited is governed by a Boltzmann Distribution. N* / N = Ae–∆E/kT • N* =is the number of exited atom • N = is the number of atom remaining • in the ground state • AE = is the difference in energies levels • k = The Boltzmann constant • T = the temperature
- 17. Scheibe-Lomakin Equation • The intensity of emitted light is calculated by Scheibe- Lomakin equation. • The equation is as follows: I = k * cn Where, I is intensity of light k is the constant of proportionality c is the concentration of element n ~ 1 (at the linear part of calibration curve) • Hence, intensity of light is directly proportional to the concentration of sample.
- 18. Components of a modern Flame Photometer 1. Burner 2. Nebulizer and mixing chamber 3. Mirrors and Slits 4. Monochromator 5. Detector 6. Recorder and display unit
- 19. Components of a modern Flame Photometer Nebulizer + Burner Mirror and Slits + Monochromator Detector (Photomultiplier tube etc.) Recorder and Display Fuel + Oxidant Sample Sample Delivery Unit Selection Unit Read-out Unit • Notably, not all sample delivery system/unit consists of nebulizers. • Some other types are: Direct insertion (solid powder) Laser ablation (solid metal) Spark or arc ablation (conducting solid) Glow discharge sputtering (conducting solid)
- 20. 2. Nebulizer and mixing chamber • Nebulization is turning the sample solution in an aerosol by jet of highly compressed gas. • Function is to transport the aerosol to the flame at a steady rate. • In mixing chamber, fuels and oxidants are mixed together then transported to the flame. Design of a nebulizer
- 21. 2. Nebulizer and mixing chamber • Different types of nebulizers are: Pneumatic nebulizer Ultrasonic nebulizer Electro thermal vaporizer Pneumatic and ultrasonic nebulizers Electro thermal vaporizer
- 22. 1. Burner • The burner provides the flame. • Flame contains many zones based on differences in temperature. • A composition of fuel and oxidant is used to get the desired set up. Different combinations of fuel and oxidant
- 23. 1. Burner • Different types of burners are: a. Mecker burner b. Laminar flow burner c. Total consumption burner d. Lundegårdh burner e. Shielded burner a e d c b
- 24. 3. Mirror and Slits • A mirror is located behind the burner to reflect the radiation back to the slits of monochromator. • The reflecting surface of the mirror is front faced. • The slits allow a certain amount of radiation to get into monochromator. • The two slits are entrance and exit slit.
- 25. 4. Monochromator • Used to select the light of a specific wavelength from the flame. • Filter wheel having a filter for each element is used. • For analyzing an element its specific filter is used as it will filter all other non-specific wavelengths. Some elements with their respective flame colour and wavelength
- 26. 4. Monochromator • Monochromator types are: a. Prism monochromator b. Grating monochromator a b
- 27. 5. Detector • Three types of detectors are: a. Photomultiplier tube b. Photo emissive cell c. Photo voltaic cell
- 28. 6. Recorder and Display • Recorder records the data obtained from the detector. • Display unit aka Read-out unit displays this data. • Also consists electronic devices of amplifying and electrical apparatus for measuring and direct recording. Front panel of a photoelectric flame photometer
- 29. Calibration Curve of a Flame Photometer • In flame photometry, Scheibe-Lomakin equation says that emitted light intensity from the flame is directly proportional to the concentration of the species being aspirated. • The graph below shows that the direct relationship between the emission and concentration is true only at relatively low concentrations of mg/L level (up to 50 mg/L). • The curve in the graph is known as calibration curve which is obtained by using standard solutions containing known concentrations of the elements to be determined. • It is important to emphasize that each element has its own characteristic curve and separate curves must be constructed.
- 30. Calibration Curve of a Flame Photometer • The concentration range covered by the calibration curve depends on the expected concentration so that the sample readings fall somewhere inside the calibration curve. • Once the calibration curve has been plotted, the scale reading for the sample solution is compared with the curve to find the concentration.
- 31. Applications • It is used for qualitative analysis of elements by comparing emitted wavelength with the standard. • It is used in quantitative analysis for determining the concentration of I and II group elements. • It is used for examine hard water for determining the concentration of calcium present in it. • It is used for examine urine for determining the concentration of sodium and potassium present in it. • It is used for examine hard biogas and ceramic materials for determining the concentration of calcium present in it.
- 32. Limitations • Only few elements can be analyzed. • Many metallic salts, soil and other compounds are insoluble in common solvent, therefore these compounds cannot be examined by flame photometry as sample only can be introduced as a solution into the flame. • Amount of sample is very important because small amount of sample are tough to examine as samples are volatized (sample is lost during volatization). • In process of solubilisation of samples with solvent, there are chances of mixing of impurities with sample which leads to error in the observed spectra.
- 33. Assistance • https://en.wikipedia.org/wiki/Photoelectric_flame_photometer • Forensic Science: Paper no 4: Instrumental Methods & Analysis. Module no. 24: Flame Photometric Analysis. • https://nitsri.ac.in/Department/Civil%20Engineering/CWE- 301_WATER_QUALITY_AND_ENVIRONMENT_Flame_Photometry.pdf • Photos - Google