SlideShare a Scribd company logo
1 of 6
Download to read offline
QUESTION 1
( no explanation needed please help to answer all not just one subquestion)
i) You are given a report which states that a response variable decreases by a factor of 2.5
for each unit increase in , from the following model:
What was the original coefficient of in the model output?
A. 6.25
B. -0.9162907
C. 12.18249
D. -1.581139
E. 0.9162907
ii) Consider the following R code and output. These data are on distance taken to stop (ft)
in cars and speed (mph) at which they were driving.
------------------------------------------------------------------------------
> cars.lm <- lm(sqrt(dist) ~ speed, data = cars)
> summary(cars.lm)
Call:
lm(formula = sqrt(dist) ~ speed, data = cars)
Coefficients:
Estimate Std. Error t value Pr(>|t|)
(Intercept) 1.27705 0.48444 2.636 0.0113
speed 0.32241 0.02978 10.825 1.77e-14
Residual standard error: 1.102 on 48 degrees of freedom
Multiple R-squared: 0.7094, Adjusted R-squared: 0.7034
F-statistic: 117.2 on 1 and 48 DF, p-value: 1.773e-14
------------------------------------------------------------------------------
Predict the average distance to stop (to the nearest ft) for a car driving at a speed of 30mph: (
Answer................)
iii) What does the coefficient for the quadratic term I(map^2) tell us in the output below?
Estimate Std. Error t value Pr(>|t|)
(Intercept) 75.4563024 12.4152072 6.078 1.78e-07
I(map^2) 0.0002260 0.0000372 6.075 1.79e-07
map -0.2627011 0.0431129 -6.093 1.68e-07
height 1.3070829 0.2594272 5.038 6.78e-06
A. The curve that describes the relationship between the response and map has a minimum at
some value of map and the response increases on both sides of that map value.
B. The relationship between the response and map is negative, if it is the only explanatory
variable in the model.
C. The slope for the marginal relationship between map and the response.
iv) Consider the following R code and output:
------------------------------------------------------
> diox$logTEQ <- log(TEQ)
> m1 <- lm(logTEQ ~ Year, data = diox)
> summary(m1)
Call:
lm(formula = logTEQ ~ Year, data = diox)
Coefficients:
Estimate Std. Error t value Pr(>|t|)
(Intercept) 218.91364 42.79187 5.116 0.000255
Year -0.10762 0.02143 -5.021 0.000299
Residual standard error: 0.3233 on 12 degrees of freedom
Multiple R-squared: 0.6775, Adjusted R-squared: 0.6506
F-statistic: 25.21 on 1 and 12 DF, p-value: 0.0002986
------------------------------------------------------
Which of the following statements are correct?
A. Median TEQ is estimated to decrease by 0.10762 units per year.
B. The decrease in median TEQ is constant from year to year.
C. The decrease in mean log(TEQ) is constant from year to year.
D. Median TEQ is estimated to decrease by a factor of 0.10762 per year.
E. Median TEQ levels are estimated to change/decrease by a factor of 0.898 per year.
F. Median TEQ levels are estimated to decrease by approximately 10% per year.
v) In a multiple regression model you are trying to fit, one of the explanatory variables, x3,
shows a non-linear trend that you want to accommodate using a third order polynomial.
What is the correct model specification in R?
A. lm(y ~ x1 + x2 + I(x3^3))
B. lm(y ~ x1 + x2 + x3 + x3)
C. lm(y ~ x1 + x2 + x3 + I(x3^2) + I(x3^3))
D. lm(y ~ x1 + x2 + x3^2 + I(x3)^3)
QUESTION 2
i) The coefficient for a two-way interaction term between two continuous explanatory
variables (x1 and x2, say) gives the change in the slope between the response and x1 per
unit increase in x2.
Ii) Consider the R output from a linear regression model below. The response is soil
biomass, the explanatory variables are fertilizer (fert, continuous), and temperature (temp,
categorical with levels low and high).
Call:
lm(formula = y ~ temp * fert)
Coefficients:
Estimate Std. Error t value Pr(>|t|)
(Intercept) 1.30076 0.21582 6.027 2.64e-07
tempHigh -2.25373 0.31634 -7.124 5.93e-09
fert 2.93689 0.03616 81.220 < 2e-16
tempHigh:fert 1.54914 0.05368 28.856 < 2e-16
Residual standard error: 0.4866 on 46 degrees of freedom
Multiple R-squared: 0.9978, Adjusted R-squared: 0.9977
F-statistic: 7056 on 3 and 46 DF, p-value: < 2.2e-16
The estimated coefficient for the interaction term can be interpreted as follows:
A. For every one unit increase in temperature, fertilizer increases by 1.55 units.
B. For every one unit increase in fertilizer the effect of temperature on soil biomass increases by
1.55 units.
C. At high temperatures, for every one unit increase in fertilizer, mean soil biomass increases by
1.55 units.
iii) Consider the R output from a linear regression model below. The response is soil
biomass, the explanatory variables are fertilizer (fert, continuous), and temperature (temp,
categorical with levels low and high).
Call:
lm(formula = y ~ temp * fert)
Coefficients:
Estimate Std. Error t value Pr(>|t|)
(Intercept) 1.30076 0.21582 6.027 2.64e-07
tempHigh -2.25373 0.31634 -7.124 5.93e-09
fert 2.93689 0.03616 81.220 < 2e-16
tempHigh:fert 1.54914 0.05368 28.856 < 2e-16
Residual standard error: 0.4866 on 46 degrees of freedom
Multiple R-squared: 0.9978, Adjusted R-squared: 0.9977
F-statistic: 7056 on 3 and 46 DF, p-value: < 2.2e-16
What is the hypothesis tested on the tempHigh:fert line?
A. Temperature and fertilizer interact.
B. Temperature and fertilizer are correlated.
C. There is no interaction between temperature and fertilizer.
D. Temperature and fertilizer interact with the response.
E. Temperature and fertilizer do not interact with the response.
iv) What is the fitted value for the response in a model with an interaction term when
colour is red, length is 0.11 and mass is 10.2?
Estimate Std. Error t value Pr(>|t|)
(Intercept) 10.462891 1.183536 8.840 0.004021
colourRed 0.471709 0.269702 1.749 0.078420
colourWhite 0.519045 0.244247 2.125 0.057706
ColourBlue 1.574831 1.529718 1.029 0.154530
ColourYellow 0.991854 0.256221 3.871 0.019912
length -3.125657 0.611825 -5.109 0.011746
mass 0.871294 0.283496 3.073 0.030472
length:mass 15.462891 2.183536 7.082 0.006223
Answer...........
v) Consider the following R output. x1 and x2 are continuous explanatory variables.
Call:
lm(formula = y ~ x1 * x2)
Coefficients:
Estimate Std. Error t value Pr(>|t|)
(Intercept) 14.9710 8.0980 1.849 0.07093
x1 -0.4943 1.4795 -0.334 0.73983
x2 -2.6993 0.7714 -3.499 0.00105
x1:x2 1.7653 0.1399 12.614 < 2e-16
Residual standard error: 8.054 on 46 degrees of freedom
Multiple R-squared: 0.9812, Adjusted R-squared: 0.98
F-statistic: 801.3 on 3 and 46 DF, p-value: < 2.2e-16
Which of the following statements are correct?
A. There is no evidence that x1 affects the response.
B. Per unit increase in x2, the slope of the relationship between the response and x1 increases by
1.77 units.
C. The mean response is estimated to decrease by -2.6993 units per unit increase in x2,
independent of the value of x1.
A. Median TEQ is estimated to decrease by 0.10762 units per year.
B. The decrease in median TEQ is constant from year to year.
C. The decrease in mean log(TEQ) is constant from year to year.
D. Median TEQ is estimated to decrease by a factor of 0.10762 per year.
E. Median TEQ levels are estimated to change/decrease by a factor of 0.898 per year.
F. Median TEQ levels are estimated to decrease by approximately 10% per year.
QUESTION 1 ( no explanation needed please help to answer all not just.pdf

More Related Content

Similar to QUESTION 1 ( no explanation needed please help to answer all not just.pdf

IC Design of Power Management Circuits (III)
IC Design of Power Management Circuits (III)IC Design of Power Management Circuits (III)
IC Design of Power Management Circuits (III)Claudia Sin
 
New controllers efficient model based design method
New controllers efficient model based design methodNew controllers efficient model based design method
New controllers efficient model based design methodAlexander Decker
 
Robust PID Controller Design for Non-Minimum Phase Systems using Magnitude Op...
Robust PID Controller Design for Non-Minimum Phase Systems using Magnitude Op...Robust PID Controller Design for Non-Minimum Phase Systems using Magnitude Op...
Robust PID Controller Design for Non-Minimum Phase Systems using Magnitude Op...IRJET Journal
 
The_Mismatch_Noise_Cancellation_Architecture
The_Mismatch_Noise_Cancellation_ArchitectureThe_Mismatch_Noise_Cancellation_Architecture
The_Mismatch_Noise_Cancellation_ArchitectureShereef Shehata
 
MULTICOLLINERITY.pptx
MULTICOLLINERITY.pptxMULTICOLLINERITY.pptx
MULTICOLLINERITY.pptxYanYingLoh
 
Arna Friend Controls II Final
Arna Friend Controls II FinalArna Friend Controls II Final
Arna Friend Controls II FinalArna Friend
 
Design of a novel controller to increase the frequency response of an aerospace
Design of a novel controller to increase the frequency response of an aerospaceDesign of a novel controller to increase the frequency response of an aerospace
Design of a novel controller to increase the frequency response of an aerospaceIAEME Publication
 
CAPACITIVE SENSORS ELECTRICAL WAFER SORT
CAPACITIVE SENSORS ELECTRICAL WAFER SORTCAPACITIVE SENSORS ELECTRICAL WAFER SORT
CAPACITIVE SENSORS ELECTRICAL WAFER SORTMassimo Garavaglia
 
Chapter 09
Chapter 09Chapter 09
Chapter 09Tha Mike
 
Lect2 up390 (100329)
Lect2 up390 (100329)Lect2 up390 (100329)
Lect2 up390 (100329)aicdesign
 
Model reduction design for continuous systems with finite frequency specifications
Model reduction design for continuous systems with finite frequency specificationsModel reduction design for continuous systems with finite frequency specifications
Model reduction design for continuous systems with finite frequency specificationsIJECEIAES
 
controllers ITS TYPES AND CLASSIFICATION BASED ON APPLICATION
controllers ITS TYPES AND CLASSIFICATION BASED ON APPLICATIONcontrollers ITS TYPES AND CLASSIFICATION BASED ON APPLICATION
controllers ITS TYPES AND CLASSIFICATION BASED ON APPLICATIONrahulkatre9
 
chapter1digitalsystemsandbinarynumbers-151021072016-lva1-app6891.pptx
chapter1digitalsystemsandbinarynumbers-151021072016-lva1-app6891.pptxchapter1digitalsystemsandbinarynumbers-151021072016-lva1-app6891.pptx
chapter1digitalsystemsandbinarynumbers-151021072016-lva1-app6891.pptxSurendra Loya
 

Similar to QUESTION 1 ( no explanation needed please help to answer all not just.pdf (20)

IC Design of Power Management Circuits (III)
IC Design of Power Management Circuits (III)IC Design of Power Management Circuits (III)
IC Design of Power Management Circuits (III)
 
New controllers efficient model based design method
New controllers efficient model based design methodNew controllers efficient model based design method
New controllers efficient model based design method
 
ACS 22LIE12 lab Manul.docx
ACS 22LIE12 lab Manul.docxACS 22LIE12 lab Manul.docx
ACS 22LIE12 lab Manul.docx
 
Robust PID Controller Design for Non-Minimum Phase Systems using Magnitude Op...
Robust PID Controller Design for Non-Minimum Phase Systems using Magnitude Op...Robust PID Controller Design for Non-Minimum Phase Systems using Magnitude Op...
Robust PID Controller Design for Non-Minimum Phase Systems using Magnitude Op...
 
Progress 1st sem
Progress 1st semProgress 1st sem
Progress 1st sem
 
Finite frequency H∞ control for wind turbine systems in T-S form
Finite frequency H∞ control for wind turbine systems in T-S formFinite frequency H∞ control for wind turbine systems in T-S form
Finite frequency H∞ control for wind turbine systems in T-S form
 
E33018021
E33018021E33018021
E33018021
 
The_Mismatch_Noise_Cancellation_Architecture
The_Mismatch_Noise_Cancellation_ArchitectureThe_Mismatch_Noise_Cancellation_Architecture
The_Mismatch_Noise_Cancellation_Architecture
 
MULTICOLLINERITY.pptx
MULTICOLLINERITY.pptxMULTICOLLINERITY.pptx
MULTICOLLINERITY.pptx
 
Arna Friend Controls II Final
Arna Friend Controls II FinalArna Friend Controls II Final
Arna Friend Controls II Final
 
Design of a novel controller to increase the frequency response of an aerospace
Design of a novel controller to increase the frequency response of an aerospaceDesign of a novel controller to increase the frequency response of an aerospace
Design of a novel controller to increase the frequency response of an aerospace
 
CAPACITIVE SENSORS ELECTRICAL WAFER SORT
CAPACITIVE SENSORS ELECTRICAL WAFER SORTCAPACITIVE SENSORS ELECTRICAL WAFER SORT
CAPACITIVE SENSORS ELECTRICAL WAFER SORT
 
Chapter 09
Chapter 09Chapter 09
Chapter 09
 
Final Project
Final ProjectFinal Project
Final Project
 
DC servo motor
DC servo motorDC servo motor
DC servo motor
 
Lect2 up390 (100329)
Lect2 up390 (100329)Lect2 up390 (100329)
Lect2 up390 (100329)
 
Model reduction design for continuous systems with finite frequency specifications
Model reduction design for continuous systems with finite frequency specificationsModel reduction design for continuous systems with finite frequency specifications
Model reduction design for continuous systems with finite frequency specifications
 
controllers ITS TYPES AND CLASSIFICATION BASED ON APPLICATION
controllers ITS TYPES AND CLASSIFICATION BASED ON APPLICATIONcontrollers ITS TYPES AND CLASSIFICATION BASED ON APPLICATION
controllers ITS TYPES AND CLASSIFICATION BASED ON APPLICATION
 
chapter1digitalsystemsandbinarynumbers-151021072016-lva1-app6891.pptx
chapter1digitalsystemsandbinarynumbers-151021072016-lva1-app6891.pptxchapter1digitalsystemsandbinarynumbers-151021072016-lva1-app6891.pptx
chapter1digitalsystemsandbinarynumbers-151021072016-lva1-app6891.pptx
 
Final Project
Final ProjectFinal Project
Final Project
 

More from PhilzIGHudsonl

Question 1- Let A- Represent the work gender- and B- Represent the mar.pdf
Question 1- Let A- Represent the work gender- and B- Represent the mar.pdfQuestion 1- Let A- Represent the work gender- and B- Represent the mar.pdf
Question 1- Let A- Represent the work gender- and B- Represent the mar.pdfPhilzIGHudsonl
 
Question 1- A front is always named for the air mass that is being pus.pdf
Question 1- A front is always named for the air mass that is being pus.pdfQuestion 1- A front is always named for the air mass that is being pus.pdf
Question 1- A front is always named for the air mass that is being pus.pdfPhilzIGHudsonl
 
Question 1- (5 points)- Henrietta Lacks is a very important person in.pdf
Question 1- (5 points)- Henrietta Lacks is a very important person in.pdfQuestion 1- (5 points)- Henrietta Lacks is a very important person in.pdf
Question 1- (5 points)- Henrietta Lacks is a very important person in.pdfPhilzIGHudsonl
 
Question 1 - -12 points- Formally prove (using the definition of O not.pdf
Question 1 - -12 points- Formally prove (using the definition of O not.pdfQuestion 1 - -12 points- Formally prove (using the definition of O not.pdf
Question 1 - -12 points- Formally prove (using the definition of O not.pdfPhilzIGHudsonl
 
Question 1 Freight transport operations have become complex and differ.pdf
Question 1 Freight transport operations have become complex and differ.pdfQuestion 1 Freight transport operations have become complex and differ.pdf
Question 1 Freight transport operations have become complex and differ.pdfPhilzIGHudsonl
 
Question 1 joint provides a little -give- at the artzulation sates Bas.pdf
Question 1 joint provides a little -give- at the artzulation sates Bas.pdfQuestion 1 joint provides a little -give- at the artzulation sates Bas.pdf
Question 1 joint provides a little -give- at the artzulation sates Bas.pdfPhilzIGHudsonl
 
QuESTION 1 Fer nach inem- seiact ine comoct dofinibon a- A threat cart.pdf
QuESTION 1 Fer nach inem- seiact ine comoct dofinibon a- A threat cart.pdfQuESTION 1 Fer nach inem- seiact ine comoct dofinibon a- A threat cart.pdf
QuESTION 1 Fer nach inem- seiact ine comoct dofinibon a- A threat cart.pdfPhilzIGHudsonl
 
QUESTION 1 Category Number of Persons Part Time Employees 30 million P.pdf
QUESTION 1 Category Number of Persons Part Time Employees 30 million P.pdfQUESTION 1 Category Number of Persons Part Time Employees 30 million P.pdf
QUESTION 1 Category Number of Persons Part Time Employees 30 million P.pdfPhilzIGHudsonl
 
Question 1 6-76pts The diagram I represents a map view of a stream wit.pdf
Question 1 6-76pts The diagram I represents a map view of a stream wit.pdfQuestion 1 6-76pts The diagram I represents a map view of a stream wit.pdf
Question 1 6-76pts The diagram I represents a map view of a stream wit.pdfPhilzIGHudsonl
 
Question 1 -30 Marks- The systems development lifecycle (SDLC) is a fo.pdf
Question 1 -30 Marks- The systems development lifecycle (SDLC) is a fo.pdfQuestion 1 -30 Marks- The systems development lifecycle (SDLC) is a fo.pdf
Question 1 -30 Marks- The systems development lifecycle (SDLC) is a fo.pdfPhilzIGHudsonl
 
Question 1 (a) Explain Foreign Direct Investment in Malaysia and quote.pdf
Question 1 (a) Explain Foreign Direct Investment in Malaysia and quote.pdfQuestion 1 (a) Explain Foreign Direct Investment in Malaysia and quote.pdf
Question 1 (a) Explain Foreign Direct Investment in Malaysia and quote.pdfPhilzIGHudsonl
 
Question 1 2 pts Natural Selection Involves reproduction of individual.pdf
Question 1 2 pts Natural Selection Involves reproduction of individual.pdfQuestion 1 2 pts Natural Selection Involves reproduction of individual.pdf
Question 1 2 pts Natural Selection Involves reproduction of individual.pdfPhilzIGHudsonl
 
QUESTION 1 -12 marks- You are provided with the following financial da.pdf
QUESTION 1 -12 marks- You are provided with the following financial da.pdfQUESTION 1 -12 marks- You are provided with the following financial da.pdf
QUESTION 1 -12 marks- You are provided with the following financial da.pdfPhilzIGHudsonl
 
Question 1 (5 points) Which of the following is the correct output fro.pdf
Question 1 (5 points) Which of the following is the correct output fro.pdfQuestion 1 (5 points) Which of the following is the correct output fro.pdf
Question 1 (5 points) Which of the following is the correct output fro.pdfPhilzIGHudsonl
 
Question 1 Some agile and incremental methods- like extreme programmi.pdf
Question 1  Some agile and incremental methods- like extreme programmi.pdfQuestion 1  Some agile and incremental methods- like extreme programmi.pdf
Question 1 Some agile and incremental methods- like extreme programmi.pdfPhilzIGHudsonl
 
Question 1 (10 points) Listen What happens if a parent process does.pdf
Question 1 (10 points)   Listen What happens if a parent process does.pdfQuestion 1 (10 points)   Listen What happens if a parent process does.pdf
Question 1 (10 points) Listen What happens if a parent process does.pdfPhilzIGHudsonl
 
Question -#1- Create-a linear regression object called -lm1- inport th.pdf
Question -#1- Create-a linear regression object called -lm1- inport th.pdfQuestion -#1- Create-a linear regression object called -lm1- inport th.pdf
Question -#1- Create-a linear regression object called -lm1- inport th.pdfPhilzIGHudsonl
 
Question -#1 Do plants carry out cellular respiration- A- No- photosyn.pdf
Question -#1 Do plants carry out cellular respiration- A- No- photosyn.pdfQuestion -#1 Do plants carry out cellular respiration- A- No- photosyn.pdf
Question -#1 Do plants carry out cellular respiration- A- No- photosyn.pdfPhilzIGHudsonl
 
Question # 2 List the types of dividends and a brief description of.pdf
Question # 2   List the types of dividends and a brief description of.pdfQuestion # 2   List the types of dividends and a brief description of.pdf
Question # 2 List the types of dividends and a brief description of.pdfPhilzIGHudsonl
 
Quention s rio morhis 4- The death was accidental or the rictim was a.pdf
Quention s rio morhis 4- The death was accidental or the rictim was a.pdfQuention s rio morhis 4- The death was accidental or the rictim was a.pdf
Quention s rio morhis 4- The death was accidental or the rictim was a.pdfPhilzIGHudsonl
 

More from PhilzIGHudsonl (20)

Question 1- Let A- Represent the work gender- and B- Represent the mar.pdf
Question 1- Let A- Represent the work gender- and B- Represent the mar.pdfQuestion 1- Let A- Represent the work gender- and B- Represent the mar.pdf
Question 1- Let A- Represent the work gender- and B- Represent the mar.pdf
 
Question 1- A front is always named for the air mass that is being pus.pdf
Question 1- A front is always named for the air mass that is being pus.pdfQuestion 1- A front is always named for the air mass that is being pus.pdf
Question 1- A front is always named for the air mass that is being pus.pdf
 
Question 1- (5 points)- Henrietta Lacks is a very important person in.pdf
Question 1- (5 points)- Henrietta Lacks is a very important person in.pdfQuestion 1- (5 points)- Henrietta Lacks is a very important person in.pdf
Question 1- (5 points)- Henrietta Lacks is a very important person in.pdf
 
Question 1 - -12 points- Formally prove (using the definition of O not.pdf
Question 1 - -12 points- Formally prove (using the definition of O not.pdfQuestion 1 - -12 points- Formally prove (using the definition of O not.pdf
Question 1 - -12 points- Formally prove (using the definition of O not.pdf
 
Question 1 Freight transport operations have become complex and differ.pdf
Question 1 Freight transport operations have become complex and differ.pdfQuestion 1 Freight transport operations have become complex and differ.pdf
Question 1 Freight transport operations have become complex and differ.pdf
 
Question 1 joint provides a little -give- at the artzulation sates Bas.pdf
Question 1 joint provides a little -give- at the artzulation sates Bas.pdfQuestion 1 joint provides a little -give- at the artzulation sates Bas.pdf
Question 1 joint provides a little -give- at the artzulation sates Bas.pdf
 
QuESTION 1 Fer nach inem- seiact ine comoct dofinibon a- A threat cart.pdf
QuESTION 1 Fer nach inem- seiact ine comoct dofinibon a- A threat cart.pdfQuESTION 1 Fer nach inem- seiact ine comoct dofinibon a- A threat cart.pdf
QuESTION 1 Fer nach inem- seiact ine comoct dofinibon a- A threat cart.pdf
 
QUESTION 1 Category Number of Persons Part Time Employees 30 million P.pdf
QUESTION 1 Category Number of Persons Part Time Employees 30 million P.pdfQUESTION 1 Category Number of Persons Part Time Employees 30 million P.pdf
QUESTION 1 Category Number of Persons Part Time Employees 30 million P.pdf
 
Question 1 6-76pts The diagram I represents a map view of a stream wit.pdf
Question 1 6-76pts The diagram I represents a map view of a stream wit.pdfQuestion 1 6-76pts The diagram I represents a map view of a stream wit.pdf
Question 1 6-76pts The diagram I represents a map view of a stream wit.pdf
 
Question 1 -30 Marks- The systems development lifecycle (SDLC) is a fo.pdf
Question 1 -30 Marks- The systems development lifecycle (SDLC) is a fo.pdfQuestion 1 -30 Marks- The systems development lifecycle (SDLC) is a fo.pdf
Question 1 -30 Marks- The systems development lifecycle (SDLC) is a fo.pdf
 
Question 1 (a) Explain Foreign Direct Investment in Malaysia and quote.pdf
Question 1 (a) Explain Foreign Direct Investment in Malaysia and quote.pdfQuestion 1 (a) Explain Foreign Direct Investment in Malaysia and quote.pdf
Question 1 (a) Explain Foreign Direct Investment in Malaysia and quote.pdf
 
Question 1 2 pts Natural Selection Involves reproduction of individual.pdf
Question 1 2 pts Natural Selection Involves reproduction of individual.pdfQuestion 1 2 pts Natural Selection Involves reproduction of individual.pdf
Question 1 2 pts Natural Selection Involves reproduction of individual.pdf
 
QUESTION 1 -12 marks- You are provided with the following financial da.pdf
QUESTION 1 -12 marks- You are provided with the following financial da.pdfQUESTION 1 -12 marks- You are provided with the following financial da.pdf
QUESTION 1 -12 marks- You are provided with the following financial da.pdf
 
Question 1 (5 points) Which of the following is the correct output fro.pdf
Question 1 (5 points) Which of the following is the correct output fro.pdfQuestion 1 (5 points) Which of the following is the correct output fro.pdf
Question 1 (5 points) Which of the following is the correct output fro.pdf
 
Question 1 Some agile and incremental methods- like extreme programmi.pdf
Question 1  Some agile and incremental methods- like extreme programmi.pdfQuestion 1  Some agile and incremental methods- like extreme programmi.pdf
Question 1 Some agile and incremental methods- like extreme programmi.pdf
 
Question 1 (10 points) Listen What happens if a parent process does.pdf
Question 1 (10 points)   Listen What happens if a parent process does.pdfQuestion 1 (10 points)   Listen What happens if a parent process does.pdf
Question 1 (10 points) Listen What happens if a parent process does.pdf
 
Question -#1- Create-a linear regression object called -lm1- inport th.pdf
Question -#1- Create-a linear regression object called -lm1- inport th.pdfQuestion -#1- Create-a linear regression object called -lm1- inport th.pdf
Question -#1- Create-a linear regression object called -lm1- inport th.pdf
 
Question -#1 Do plants carry out cellular respiration- A- No- photosyn.pdf
Question -#1 Do plants carry out cellular respiration- A- No- photosyn.pdfQuestion -#1 Do plants carry out cellular respiration- A- No- photosyn.pdf
Question -#1 Do plants carry out cellular respiration- A- No- photosyn.pdf
 
Question # 2 List the types of dividends and a brief description of.pdf
Question # 2   List the types of dividends and a brief description of.pdfQuestion # 2   List the types of dividends and a brief description of.pdf
Question # 2 List the types of dividends and a brief description of.pdf
 
Quention s rio morhis 4- The death was accidental or the rictim was a.pdf
Quention s rio morhis 4- The death was accidental or the rictim was a.pdfQuention s rio morhis 4- The death was accidental or the rictim was a.pdf
Quention s rio morhis 4- The death was accidental or the rictim was a.pdf
 

Recently uploaded

Crayon Activity Handout For the Crayon A
Crayon Activity Handout For the Crayon ACrayon Activity Handout For the Crayon A
Crayon Activity Handout For the Crayon AUnboundStockton
 
AmericanHighSchoolsprezentacijaoskolama.
AmericanHighSchoolsprezentacijaoskolama.AmericanHighSchoolsprezentacijaoskolama.
AmericanHighSchoolsprezentacijaoskolama.arsicmarija21
 
Presiding Officer Training module 2024 lok sabha elections
Presiding Officer Training module 2024 lok sabha electionsPresiding Officer Training module 2024 lok sabha elections
Presiding Officer Training module 2024 lok sabha electionsanshu789521
 
How to Configure Email Server in Odoo 17
How to Configure Email Server in Odoo 17How to Configure Email Server in Odoo 17
How to Configure Email Server in Odoo 17Celine George
 
Framing an Appropriate Research Question 6b9b26d93da94caf993c038d9efcdedb.pdf
Framing an Appropriate Research Question 6b9b26d93da94caf993c038d9efcdedb.pdfFraming an Appropriate Research Question 6b9b26d93da94caf993c038d9efcdedb.pdf
Framing an Appropriate Research Question 6b9b26d93da94caf993c038d9efcdedb.pdfUjwalaBharambe
 
Capitol Tech U Doctoral Presentation - April 2024.pptx
Capitol Tech U Doctoral Presentation - April 2024.pptxCapitol Tech U Doctoral Presentation - April 2024.pptx
Capitol Tech U Doctoral Presentation - April 2024.pptxCapitolTechU
 
What is Model Inheritance in Odoo 17 ERP
What is Model Inheritance in Odoo 17 ERPWhat is Model Inheritance in Odoo 17 ERP
What is Model Inheritance in Odoo 17 ERPCeline George
 
Introduction to AI in Higher Education_draft.pptx
Introduction to AI in Higher Education_draft.pptxIntroduction to AI in Higher Education_draft.pptx
Introduction to AI in Higher Education_draft.pptxpboyjonauth
 
MICROBIOLOGY biochemical test detailed.pptx
MICROBIOLOGY biochemical test detailed.pptxMICROBIOLOGY biochemical test detailed.pptx
MICROBIOLOGY biochemical test detailed.pptxabhijeetpadhi001
 
Procuring digital preservation CAN be quick and painless with our new dynamic...
Procuring digital preservation CAN be quick and painless with our new dynamic...Procuring digital preservation CAN be quick and painless with our new dynamic...
Procuring digital preservation CAN be quick and painless with our new dynamic...Jisc
 
call girls in Kamla Market (DELHI) 🔝 >༒9953330565🔝 genuine Escort Service 🔝✔️✔️
call girls in Kamla Market (DELHI) 🔝 >༒9953330565🔝 genuine Escort Service 🔝✔️✔️call girls in Kamla Market (DELHI) 🔝 >༒9953330565🔝 genuine Escort Service 🔝✔️✔️
call girls in Kamla Market (DELHI) 🔝 >༒9953330565🔝 genuine Escort Service 🔝✔️✔️9953056974 Low Rate Call Girls In Saket, Delhi NCR
 
Solving Puzzles Benefits Everyone (English).pptx
Solving Puzzles Benefits Everyone (English).pptxSolving Puzzles Benefits Everyone (English).pptx
Solving Puzzles Benefits Everyone (English).pptxOH TEIK BIN
 
ENGLISH 7_Q4_LESSON 2_ Employing a Variety of Strategies for Effective Interp...
ENGLISH 7_Q4_LESSON 2_ Employing a Variety of Strategies for Effective Interp...ENGLISH 7_Q4_LESSON 2_ Employing a Variety of Strategies for Effective Interp...
ENGLISH 7_Q4_LESSON 2_ Employing a Variety of Strategies for Effective Interp...JhezDiaz1
 
Organic Name Reactions for the students and aspirants of Chemistry12th.pptx
Organic Name Reactions  for the students and aspirants of Chemistry12th.pptxOrganic Name Reactions  for the students and aspirants of Chemistry12th.pptx
Organic Name Reactions for the students and aspirants of Chemistry12th.pptxVS Mahajan Coaching Centre
 
Alper Gobel In Media Res Media Component
Alper Gobel In Media Res Media ComponentAlper Gobel In Media Res Media Component
Alper Gobel In Media Res Media ComponentInMediaRes1
 
ECONOMIC CONTEXT - LONG FORM TV DRAMA - PPT
ECONOMIC CONTEXT - LONG FORM TV DRAMA - PPTECONOMIC CONTEXT - LONG FORM TV DRAMA - PPT
ECONOMIC CONTEXT - LONG FORM TV DRAMA - PPTiammrhaywood
 
Introduction to ArtificiaI Intelligence in Higher Education
Introduction to ArtificiaI Intelligence in Higher EducationIntroduction to ArtificiaI Intelligence in Higher Education
Introduction to ArtificiaI Intelligence in Higher Educationpboyjonauth
 
ECONOMIC CONTEXT - PAPER 1 Q3: NEWSPAPERS.pptx
ECONOMIC CONTEXT - PAPER 1 Q3: NEWSPAPERS.pptxECONOMIC CONTEXT - PAPER 1 Q3: NEWSPAPERS.pptx
ECONOMIC CONTEXT - PAPER 1 Q3: NEWSPAPERS.pptxiammrhaywood
 
Gas measurement O2,Co2,& ph) 04/2024.pptx
Gas measurement O2,Co2,& ph) 04/2024.pptxGas measurement O2,Co2,& ph) 04/2024.pptx
Gas measurement O2,Co2,& ph) 04/2024.pptxDr.Ibrahim Hassaan
 

Recently uploaded (20)

Crayon Activity Handout For the Crayon A
Crayon Activity Handout For the Crayon ACrayon Activity Handout For the Crayon A
Crayon Activity Handout For the Crayon A
 
AmericanHighSchoolsprezentacijaoskolama.
AmericanHighSchoolsprezentacijaoskolama.AmericanHighSchoolsprezentacijaoskolama.
AmericanHighSchoolsprezentacijaoskolama.
 
Presiding Officer Training module 2024 lok sabha elections
Presiding Officer Training module 2024 lok sabha electionsPresiding Officer Training module 2024 lok sabha elections
Presiding Officer Training module 2024 lok sabha elections
 
OS-operating systems- ch04 (Threads) ...
OS-operating systems- ch04 (Threads) ...OS-operating systems- ch04 (Threads) ...
OS-operating systems- ch04 (Threads) ...
 
How to Configure Email Server in Odoo 17
How to Configure Email Server in Odoo 17How to Configure Email Server in Odoo 17
How to Configure Email Server in Odoo 17
 
Framing an Appropriate Research Question 6b9b26d93da94caf993c038d9efcdedb.pdf
Framing an Appropriate Research Question 6b9b26d93da94caf993c038d9efcdedb.pdfFraming an Appropriate Research Question 6b9b26d93da94caf993c038d9efcdedb.pdf
Framing an Appropriate Research Question 6b9b26d93da94caf993c038d9efcdedb.pdf
 
Capitol Tech U Doctoral Presentation - April 2024.pptx
Capitol Tech U Doctoral Presentation - April 2024.pptxCapitol Tech U Doctoral Presentation - April 2024.pptx
Capitol Tech U Doctoral Presentation - April 2024.pptx
 
What is Model Inheritance in Odoo 17 ERP
What is Model Inheritance in Odoo 17 ERPWhat is Model Inheritance in Odoo 17 ERP
What is Model Inheritance in Odoo 17 ERP
 
Introduction to AI in Higher Education_draft.pptx
Introduction to AI in Higher Education_draft.pptxIntroduction to AI in Higher Education_draft.pptx
Introduction to AI in Higher Education_draft.pptx
 
MICROBIOLOGY biochemical test detailed.pptx
MICROBIOLOGY biochemical test detailed.pptxMICROBIOLOGY biochemical test detailed.pptx
MICROBIOLOGY biochemical test detailed.pptx
 
Procuring digital preservation CAN be quick and painless with our new dynamic...
Procuring digital preservation CAN be quick and painless with our new dynamic...Procuring digital preservation CAN be quick and painless with our new dynamic...
Procuring digital preservation CAN be quick and painless with our new dynamic...
 
call girls in Kamla Market (DELHI) 🔝 >༒9953330565🔝 genuine Escort Service 🔝✔️✔️
call girls in Kamla Market (DELHI) 🔝 >༒9953330565🔝 genuine Escort Service 🔝✔️✔️call girls in Kamla Market (DELHI) 🔝 >༒9953330565🔝 genuine Escort Service 🔝✔️✔️
call girls in Kamla Market (DELHI) 🔝 >༒9953330565🔝 genuine Escort Service 🔝✔️✔️
 
Solving Puzzles Benefits Everyone (English).pptx
Solving Puzzles Benefits Everyone (English).pptxSolving Puzzles Benefits Everyone (English).pptx
Solving Puzzles Benefits Everyone (English).pptx
 
ENGLISH 7_Q4_LESSON 2_ Employing a Variety of Strategies for Effective Interp...
ENGLISH 7_Q4_LESSON 2_ Employing a Variety of Strategies for Effective Interp...ENGLISH 7_Q4_LESSON 2_ Employing a Variety of Strategies for Effective Interp...
ENGLISH 7_Q4_LESSON 2_ Employing a Variety of Strategies for Effective Interp...
 
Organic Name Reactions for the students and aspirants of Chemistry12th.pptx
Organic Name Reactions  for the students and aspirants of Chemistry12th.pptxOrganic Name Reactions  for the students and aspirants of Chemistry12th.pptx
Organic Name Reactions for the students and aspirants of Chemistry12th.pptx
 
Alper Gobel In Media Res Media Component
Alper Gobel In Media Res Media ComponentAlper Gobel In Media Res Media Component
Alper Gobel In Media Res Media Component
 
ECONOMIC CONTEXT - LONG FORM TV DRAMA - PPT
ECONOMIC CONTEXT - LONG FORM TV DRAMA - PPTECONOMIC CONTEXT - LONG FORM TV DRAMA - PPT
ECONOMIC CONTEXT - LONG FORM TV DRAMA - PPT
 
Introduction to ArtificiaI Intelligence in Higher Education
Introduction to ArtificiaI Intelligence in Higher EducationIntroduction to ArtificiaI Intelligence in Higher Education
Introduction to ArtificiaI Intelligence in Higher Education
 
ECONOMIC CONTEXT - PAPER 1 Q3: NEWSPAPERS.pptx
ECONOMIC CONTEXT - PAPER 1 Q3: NEWSPAPERS.pptxECONOMIC CONTEXT - PAPER 1 Q3: NEWSPAPERS.pptx
ECONOMIC CONTEXT - PAPER 1 Q3: NEWSPAPERS.pptx
 
Gas measurement O2,Co2,& ph) 04/2024.pptx
Gas measurement O2,Co2,& ph) 04/2024.pptxGas measurement O2,Co2,& ph) 04/2024.pptx
Gas measurement O2,Co2,& ph) 04/2024.pptx
 

QUESTION 1 ( no explanation needed please help to answer all not just.pdf

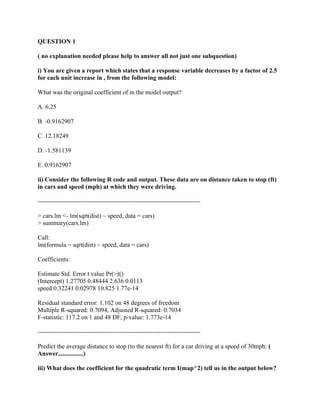
  • 1. QUESTION 1 ( no explanation needed please help to answer all not just one subquestion) i) You are given a report which states that a response variable decreases by a factor of 2.5 for each unit increase in , from the following model: What was the original coefficient of in the model output? A. 6.25 B. -0.9162907 C. 12.18249 D. -1.581139 E. 0.9162907 ii) Consider the following R code and output. These data are on distance taken to stop (ft) in cars and speed (mph) at which they were driving. ------------------------------------------------------------------------------ > cars.lm <- lm(sqrt(dist) ~ speed, data = cars) > summary(cars.lm) Call: lm(formula = sqrt(dist) ~ speed, data = cars) Coefficients: Estimate Std. Error t value Pr(>|t|) (Intercept) 1.27705 0.48444 2.636 0.0113 speed 0.32241 0.02978 10.825 1.77e-14 Residual standard error: 1.102 on 48 degrees of freedom Multiple R-squared: 0.7094, Adjusted R-squared: 0.7034 F-statistic: 117.2 on 1 and 48 DF, p-value: 1.773e-14 ------------------------------------------------------------------------------ Predict the average distance to stop (to the nearest ft) for a car driving at a speed of 30mph: ( Answer................) iii) What does the coefficient for the quadratic term I(map^2) tell us in the output below?
  • 2. Estimate Std. Error t value Pr(>|t|) (Intercept) 75.4563024 12.4152072 6.078 1.78e-07 I(map^2) 0.0002260 0.0000372 6.075 1.79e-07 map -0.2627011 0.0431129 -6.093 1.68e-07 height 1.3070829 0.2594272 5.038 6.78e-06 A. The curve that describes the relationship between the response and map has a minimum at some value of map and the response increases on both sides of that map value. B. The relationship between the response and map is negative, if it is the only explanatory variable in the model. C. The slope for the marginal relationship between map and the response. iv) Consider the following R code and output: ------------------------------------------------------ > diox$logTEQ <- log(TEQ) > m1 <- lm(logTEQ ~ Year, data = diox) > summary(m1) Call: lm(formula = logTEQ ~ Year, data = diox) Coefficients: Estimate Std. Error t value Pr(>|t|) (Intercept) 218.91364 42.79187 5.116 0.000255 Year -0.10762 0.02143 -5.021 0.000299 Residual standard error: 0.3233 on 12 degrees of freedom Multiple R-squared: 0.6775, Adjusted R-squared: 0.6506 F-statistic: 25.21 on 1 and 12 DF, p-value: 0.0002986 ------------------------------------------------------ Which of the following statements are correct? A. Median TEQ is estimated to decrease by 0.10762 units per year. B. The decrease in median TEQ is constant from year to year. C. The decrease in mean log(TEQ) is constant from year to year. D. Median TEQ is estimated to decrease by a factor of 0.10762 per year.
  • 3. E. Median TEQ levels are estimated to change/decrease by a factor of 0.898 per year. F. Median TEQ levels are estimated to decrease by approximately 10% per year. v) In a multiple regression model you are trying to fit, one of the explanatory variables, x3, shows a non-linear trend that you want to accommodate using a third order polynomial. What is the correct model specification in R? A. lm(y ~ x1 + x2 + I(x3^3)) B. lm(y ~ x1 + x2 + x3 + x3) C. lm(y ~ x1 + x2 + x3 + I(x3^2) + I(x3^3)) D. lm(y ~ x1 + x2 + x3^2 + I(x3)^3) QUESTION 2 i) The coefficient for a two-way interaction term between two continuous explanatory variables (x1 and x2, say) gives the change in the slope between the response and x1 per unit increase in x2. Ii) Consider the R output from a linear regression model below. The response is soil biomass, the explanatory variables are fertilizer (fert, continuous), and temperature (temp, categorical with levels low and high). Call: lm(formula = y ~ temp * fert) Coefficients: Estimate Std. Error t value Pr(>|t|) (Intercept) 1.30076 0.21582 6.027 2.64e-07 tempHigh -2.25373 0.31634 -7.124 5.93e-09 fert 2.93689 0.03616 81.220 < 2e-16 tempHigh:fert 1.54914 0.05368 28.856 < 2e-16 Residual standard error: 0.4866 on 46 degrees of freedom Multiple R-squared: 0.9978, Adjusted R-squared: 0.9977 F-statistic: 7056 on 3 and 46 DF, p-value: < 2.2e-16 The estimated coefficient for the interaction term can be interpreted as follows: A. For every one unit increase in temperature, fertilizer increases by 1.55 units. B. For every one unit increase in fertilizer the effect of temperature on soil biomass increases by 1.55 units.
  • 4. C. At high temperatures, for every one unit increase in fertilizer, mean soil biomass increases by 1.55 units. iii) Consider the R output from a linear regression model below. The response is soil biomass, the explanatory variables are fertilizer (fert, continuous), and temperature (temp, categorical with levels low and high). Call: lm(formula = y ~ temp * fert) Coefficients: Estimate Std. Error t value Pr(>|t|) (Intercept) 1.30076 0.21582 6.027 2.64e-07 tempHigh -2.25373 0.31634 -7.124 5.93e-09 fert 2.93689 0.03616 81.220 < 2e-16 tempHigh:fert 1.54914 0.05368 28.856 < 2e-16 Residual standard error: 0.4866 on 46 degrees of freedom Multiple R-squared: 0.9978, Adjusted R-squared: 0.9977 F-statistic: 7056 on 3 and 46 DF, p-value: < 2.2e-16 What is the hypothesis tested on the tempHigh:fert line? A. Temperature and fertilizer interact. B. Temperature and fertilizer are correlated. C. There is no interaction between temperature and fertilizer. D. Temperature and fertilizer interact with the response. E. Temperature and fertilizer do not interact with the response. iv) What is the fitted value for the response in a model with an interaction term when colour is red, length is 0.11 and mass is 10.2? Estimate Std. Error t value Pr(>|t|) (Intercept) 10.462891 1.183536 8.840 0.004021 colourRed 0.471709 0.269702 1.749 0.078420 colourWhite 0.519045 0.244247 2.125 0.057706 ColourBlue 1.574831 1.529718 1.029 0.154530 ColourYellow 0.991854 0.256221 3.871 0.019912 length -3.125657 0.611825 -5.109 0.011746 mass 0.871294 0.283496 3.073 0.030472 length:mass 15.462891 2.183536 7.082 0.006223
  • 5. Answer........... v) Consider the following R output. x1 and x2 are continuous explanatory variables. Call: lm(formula = y ~ x1 * x2) Coefficients: Estimate Std. Error t value Pr(>|t|) (Intercept) 14.9710 8.0980 1.849 0.07093 x1 -0.4943 1.4795 -0.334 0.73983 x2 -2.6993 0.7714 -3.499 0.00105 x1:x2 1.7653 0.1399 12.614 < 2e-16 Residual standard error: 8.054 on 46 degrees of freedom Multiple R-squared: 0.9812, Adjusted R-squared: 0.98 F-statistic: 801.3 on 3 and 46 DF, p-value: < 2.2e-16 Which of the following statements are correct? A. There is no evidence that x1 affects the response. B. Per unit increase in x2, the slope of the relationship between the response and x1 increases by 1.77 units. C. The mean response is estimated to decrease by -2.6993 units per unit increase in x2, independent of the value of x1. A. Median TEQ is estimated to decrease by 0.10762 units per year. B. The decrease in median TEQ is constant from year to year. C. The decrease in mean log(TEQ) is constant from year to year. D. Median TEQ is estimated to decrease by a factor of 0.10762 per year. E. Median TEQ levels are estimated to change/decrease by a factor of 0.898 per year. F. Median TEQ levels are estimated to decrease by approximately 10% per year.